Trade
Basic
Futures
Futures
Hundreds of contracts settled in USDT or BTC
Options
HOT
Trade European-style vanilla options
Unified Account
Maximize your capital efficiency
Demo Trading
Futures Kickoff
Get prepared for your futures trading
Futures Events
Futures Mall
Participate in events to win generous rewards
Demo Trading
Use virtual funds to experience risk-free trading
Earn
Launch
CandyDrop
Collect candies to earn airdrops
Launchpool
Quick staking, earn potential new tokens
HODLer Airdrop
Hold GT and get massive airdrops for free
Launchpad
Be early to the next big token project
Alpha Points
NEW
Trade on-chain assets and enjoy airdrop rewards!
Futures Points
NEW
Earn futures points and claim airdrop rewards
Investment
Simple Earn
Earn interests with idle tokens
Auto-Invest
Auto-invest on a regular basis
Dual Investment
Buy low and sell high to take profits from price fluctuations
Soft Staking
Earn rewards with flexible staking
Crypto Loan
0 Fees
Pledge one crypto to borrow another
Lending Center
One-stop lending hub
VIP Wealth Hub
Customized wealth management empowers your assets growth
Private Wealth Management
Customized asset management to grow your digital assets
Quant Fund
Top asset management team helps you profit without hassle
Staking
Stake cryptos to earn in PoS products
Smart Leverage
NEW
No forced liquidation before maturity, worry-free leveraged gains
GUSD Minting
Use USDT/USDC to mint GUSD for treasury-level yields
More
Asiftahsin
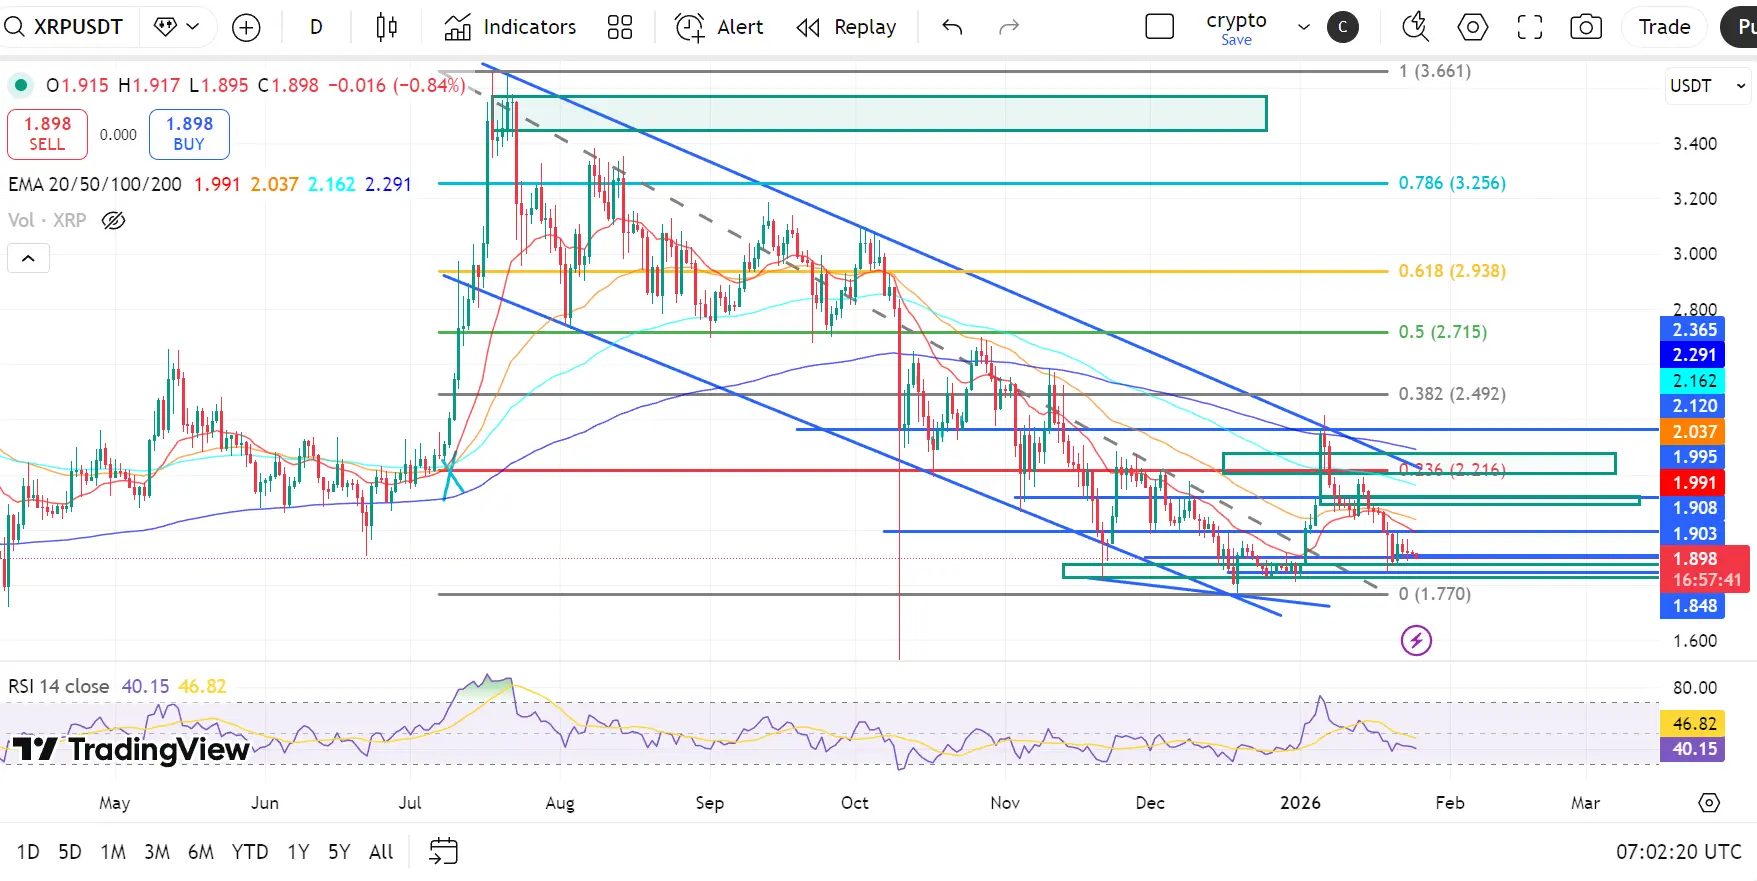
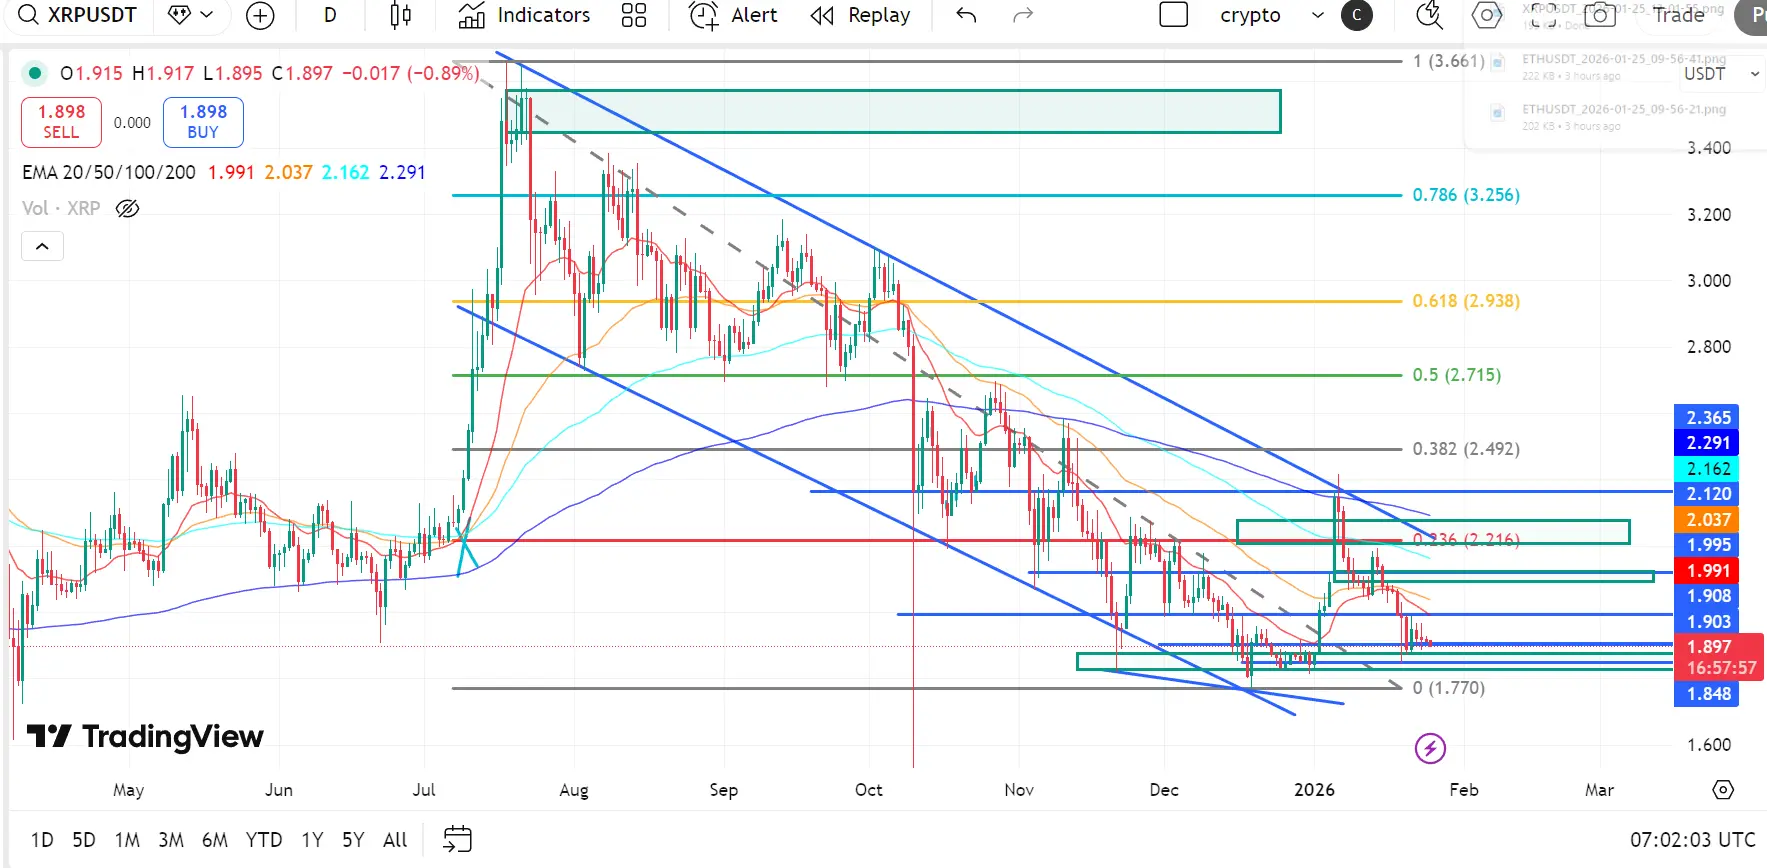
XRP Technical Outlook: Descending Channel Base Forms Near Macro Demand
XRP remains within a broader corrective structure after the sharp rejection from the $3.25–$3.65 macro supply zone (0.786–1 Fib). That rejection marked a distribution top, followed by sustained bearish continuation and now a range-bound stabilization phase near the lower end of the structure inside a descending channel.
Recent price action shows XRP defending the $1.85–$1.77 macro demand base, where buyers have started to build a rounded accumulation structure. Momentum has stabilized, though the higher-timeframe trend has
XRP-1,61%
- Reward
- 2
- 2
- Repost
- Share
KatyPaty:
Thank you for the information ☺️ℹ️View More
#GateWeb3UpgradestoGateDEX
#GateWeb3UpgradestoGateDEX shows how Gate is making decentralized trading more practical for everyday users.
The upgrade from Gate Web3 to Gate DEX focuses on simplicity without sacrificing functionality.
One-click login using a Gate account, Google account, or wallet removes a major barrier many users face in DeFi.
At the same time, access to spot, derivatives, and swaps creates a smooth experience close to centralized exchanges.
This feels like a strong bridge between CeFi convenience and DeFi freedom in one place.
Cleaner interface, clearer structure, and easier
DEFI-4,77%

- Reward
- 4
- 5
- Repost
- Share
楚老魔 :
:
2026 Go Go Go 👊View More
#GateSquareCreatorNewYearIncentives
✅ Gate.io Viral Post (Ready to Publish)
🎉 Gate Plaza Creator New Year Incentives is LIVE! 🚀
Want a share of $60,000 luxury prize pool? Just post on Gate Plaza and start earning rewards!
✅ How to join:
Fill the registration form
Post using any Plaza tool
Interact to increase your rank
🏆 Rewards include:
✨ $25,000 prize pool for posts
🎁 10 lucky users win 1 GT + Gate Duck Hat
🏅 Top posters can win Gate merch, backpacks & more
🎉 Beginners: First post = $50 reward + share in $10,000 beginner pool
📅 Event period: Jan 8 – Jan 26, 2026 (UTC+8)
👇 Who’s read
GT-0,7%

- Reward
- like
- Comment
- Repost
- Share
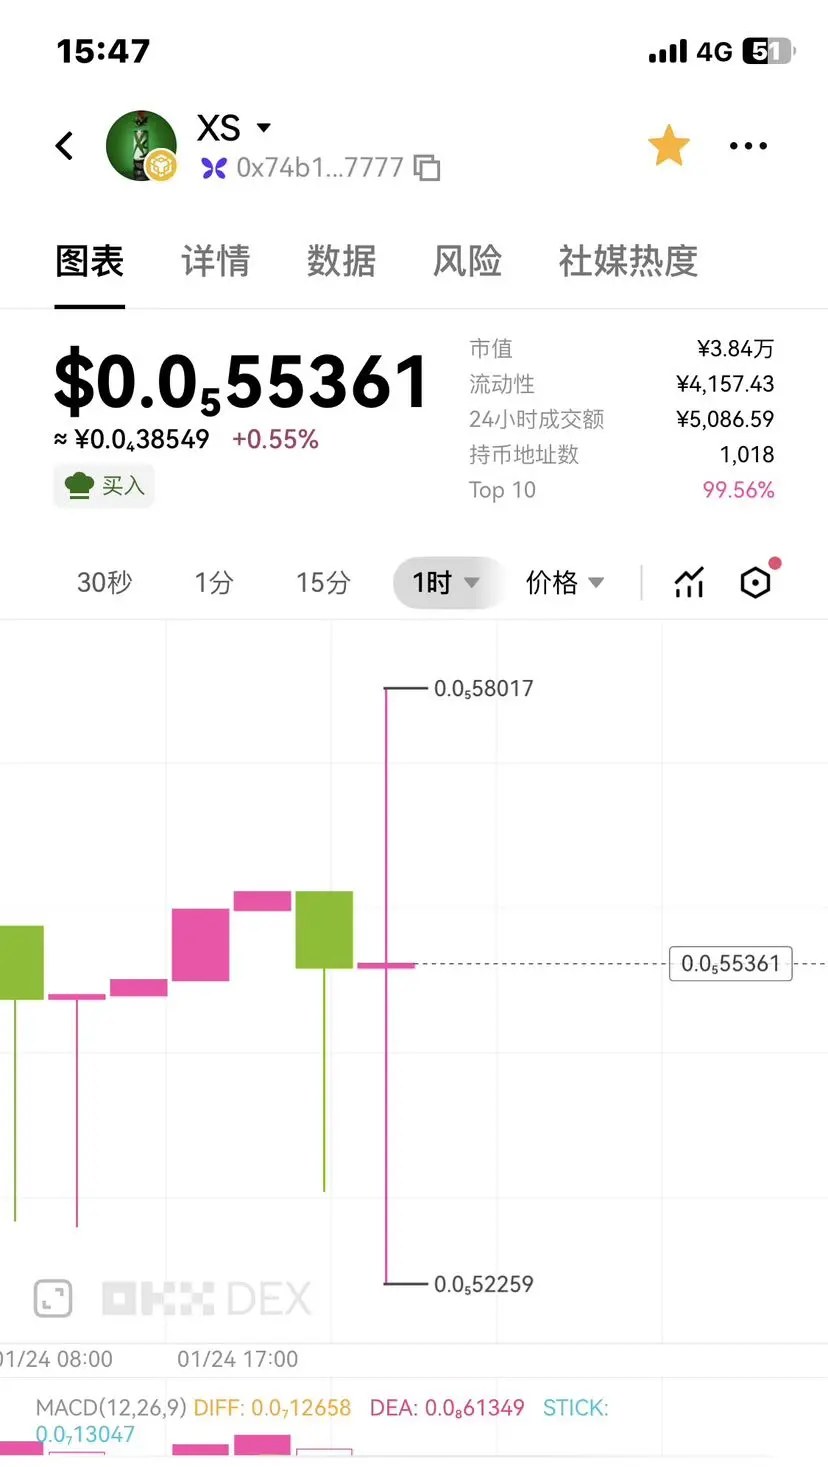
1个亿
一个小目标
Created By@ChainStrategyStudyGroup-Uncle
Listing Progress
0.05%
MC:
$3.45K
Create My Token
$btc Don't you really feel that this feeling is just like a bear market with no hope?
BTC-1,52%
- Reward
- like
- Comment
- Repost
- Share
🇪🇺🇮🇳 JUST IN: The European Union says it is closing in on a free trade agreement with India.A major step toward deeper trade ties between the two economies.


- Reward
- like
- Comment
- Repost
- Share
Review: Failed to bottom out, lost ten points, the entry timing was wrong, didn't enter on the 15-minute close, waited for the next K-line to confirm whether to enter, didn't exit when divergence signals appeared, and when officially trading, divergence floating profit must be exited.
View Original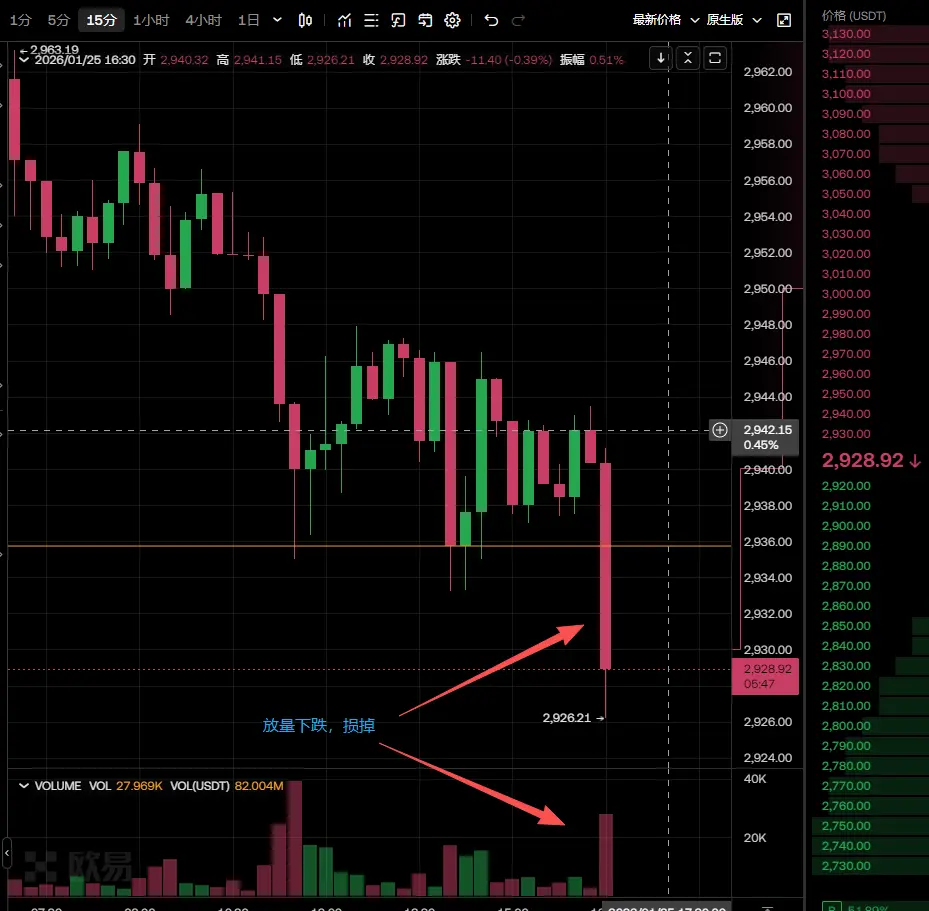
- Reward
- like
- Comment
- Repost
- Share
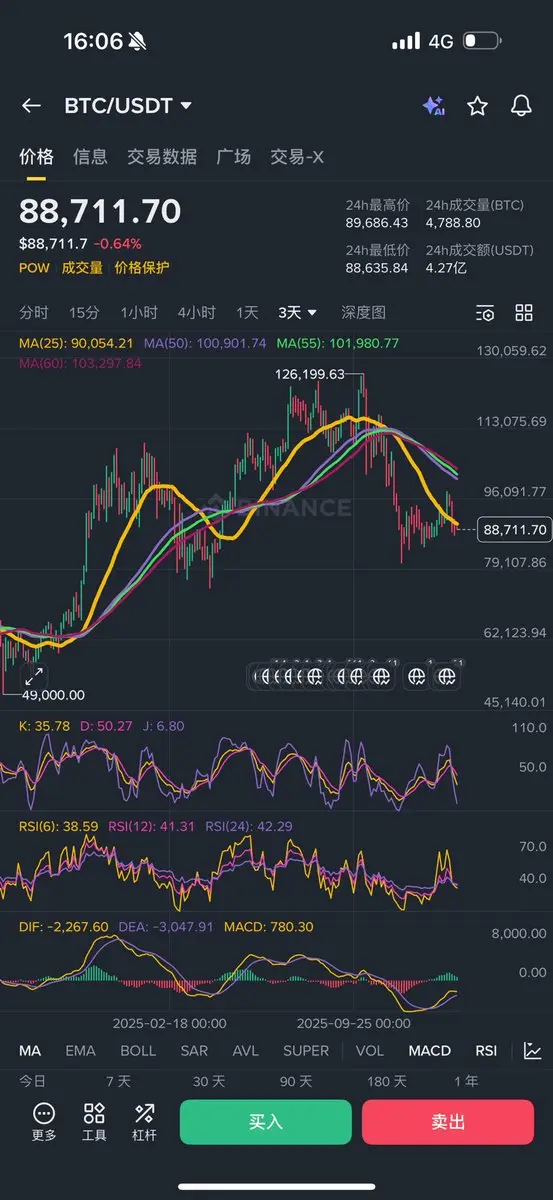
#黄金白银再创新高 Gold and silver both hit new all-time highs. Is "digital gold" Bitcoin really falling behind?
As of now, spot gold and silver have both reached record highs. In contrast, Bitcoin has been oscillating around $90,000.
This divergence highlights a structural shift in the global market: in uncertain environments, traditional safe-haven assets thrive, while Bitcoin is hampered by liquidity constraints and risk aversion.
Deep Drivers Behind the Continued New Highs of Gold and Silver
By January 2025, gold prices surged to $2,600, then continued to rise strongly, with nearly 100% gains.
Silv
BTC-1,52%

MC:$35.17KHolders:393
100.00%
- Reward
- 7
- 15
- Repost
- Share
Daligo :
:
坐稳扶好,马上起飞 🛫坐稳扶好,马上起飞 🛫View More
Discover Gate and join me in the most exciting event! https://www.gate.com/campaigns/3867?ref=VQVDUQTBAQ&ref_type=132
View Original
- Reward
- like
- Comment
- Repost
- Share
Market Volatility & Liquidity Explained
1
- Reward
- like
- Comment
- Repost
- Share
- Reward
- like
- 1
- Repost
- Share
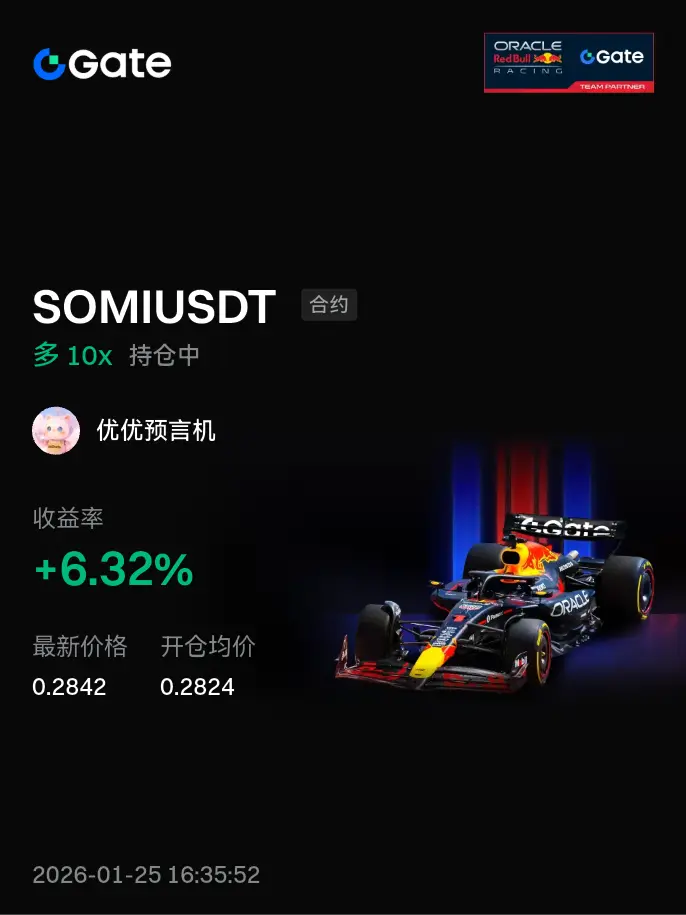
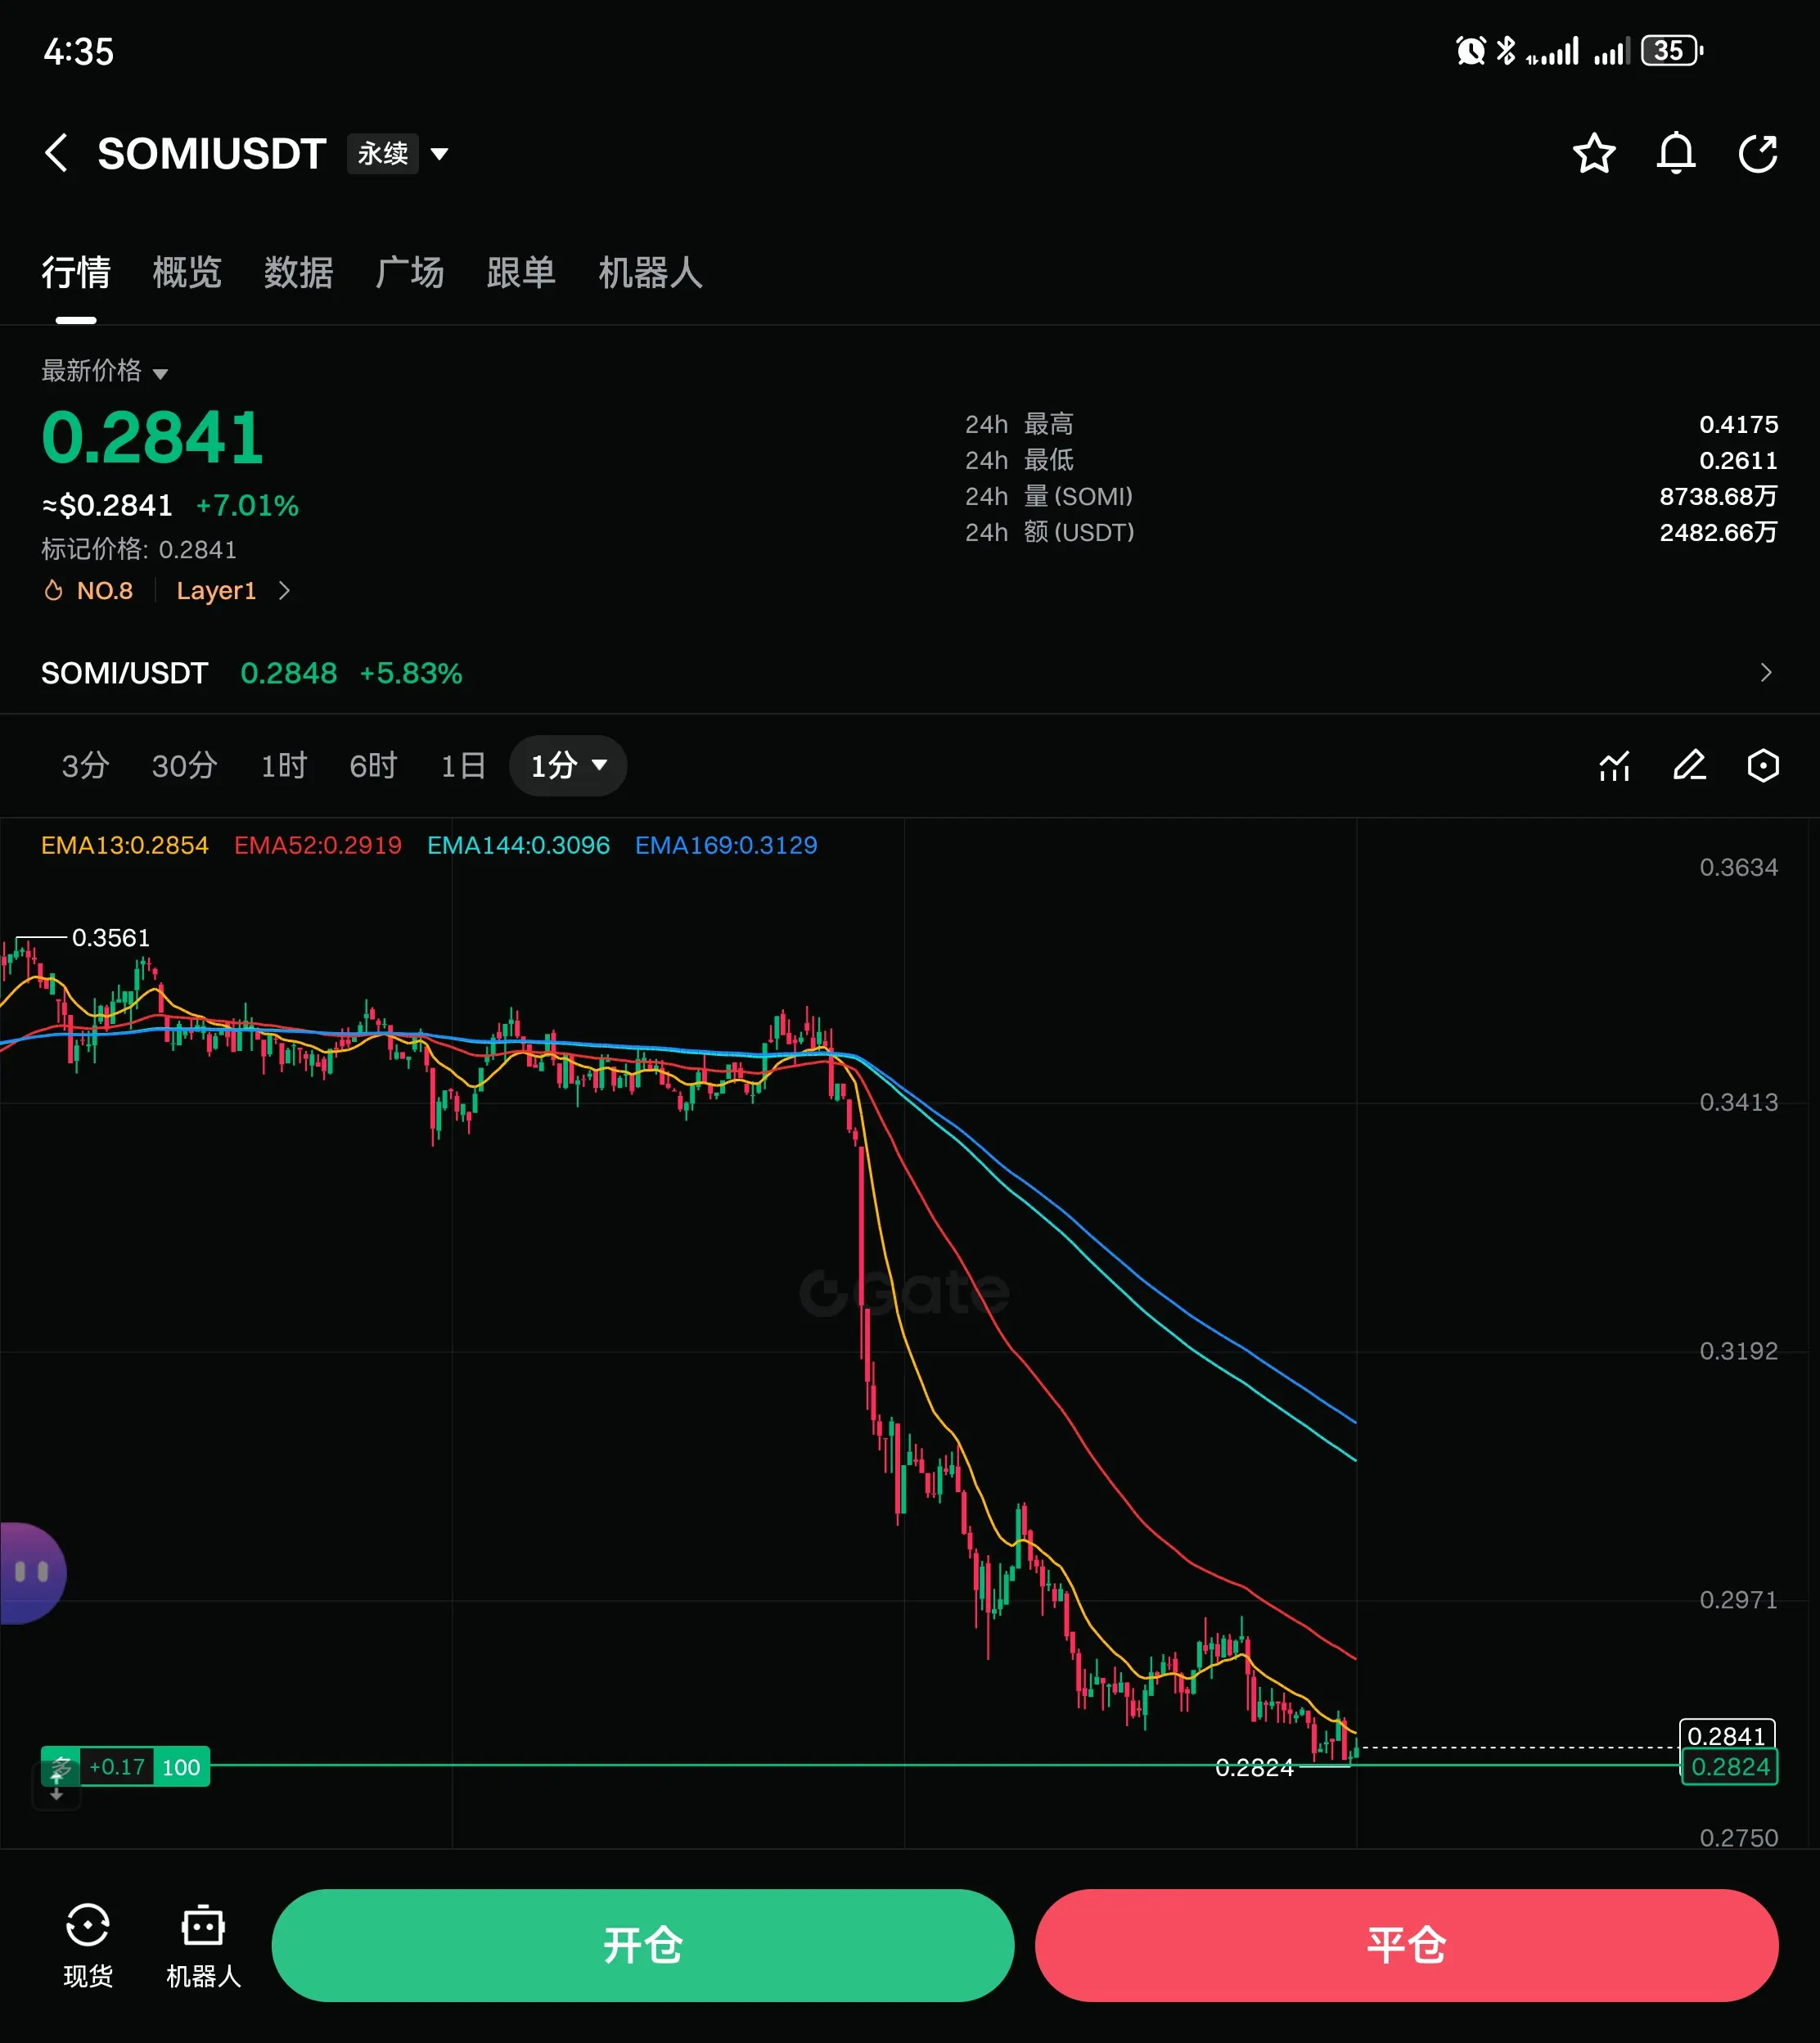
YouyouOracle :
:
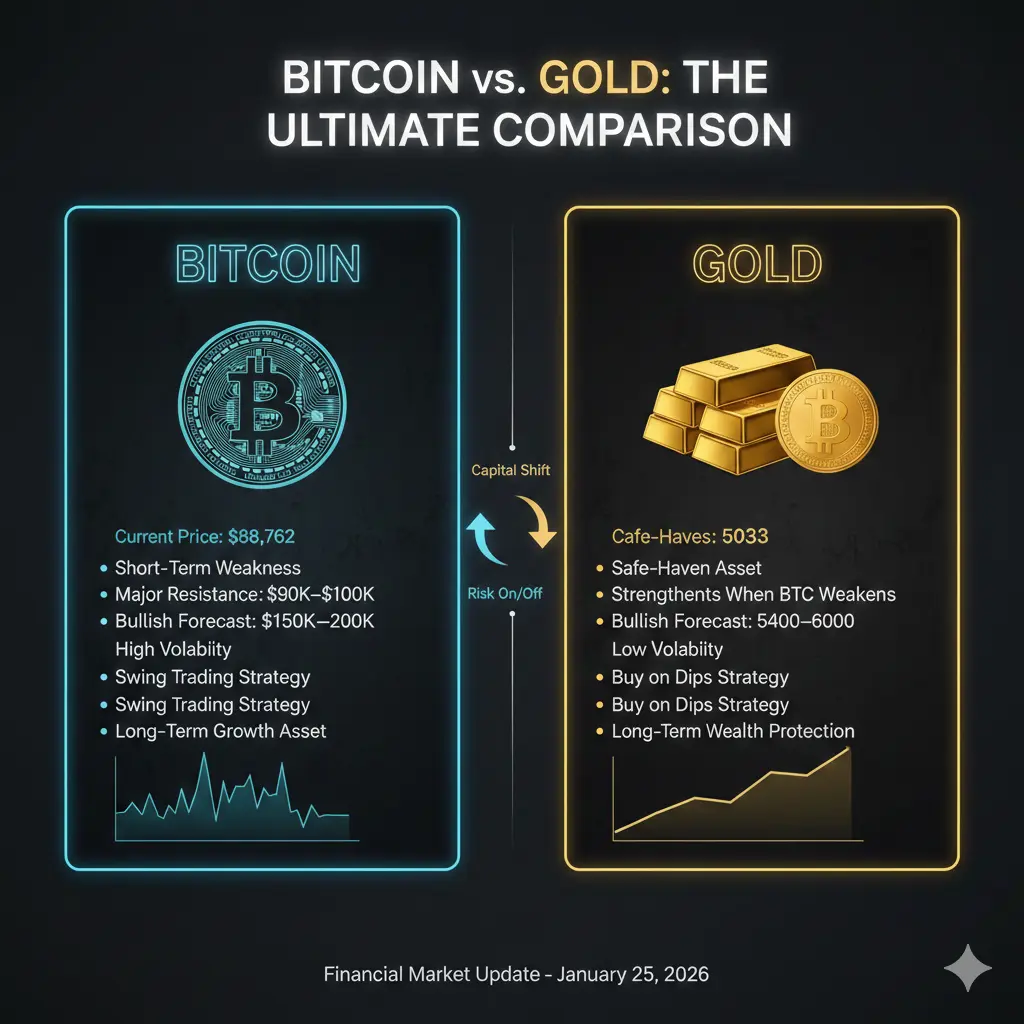
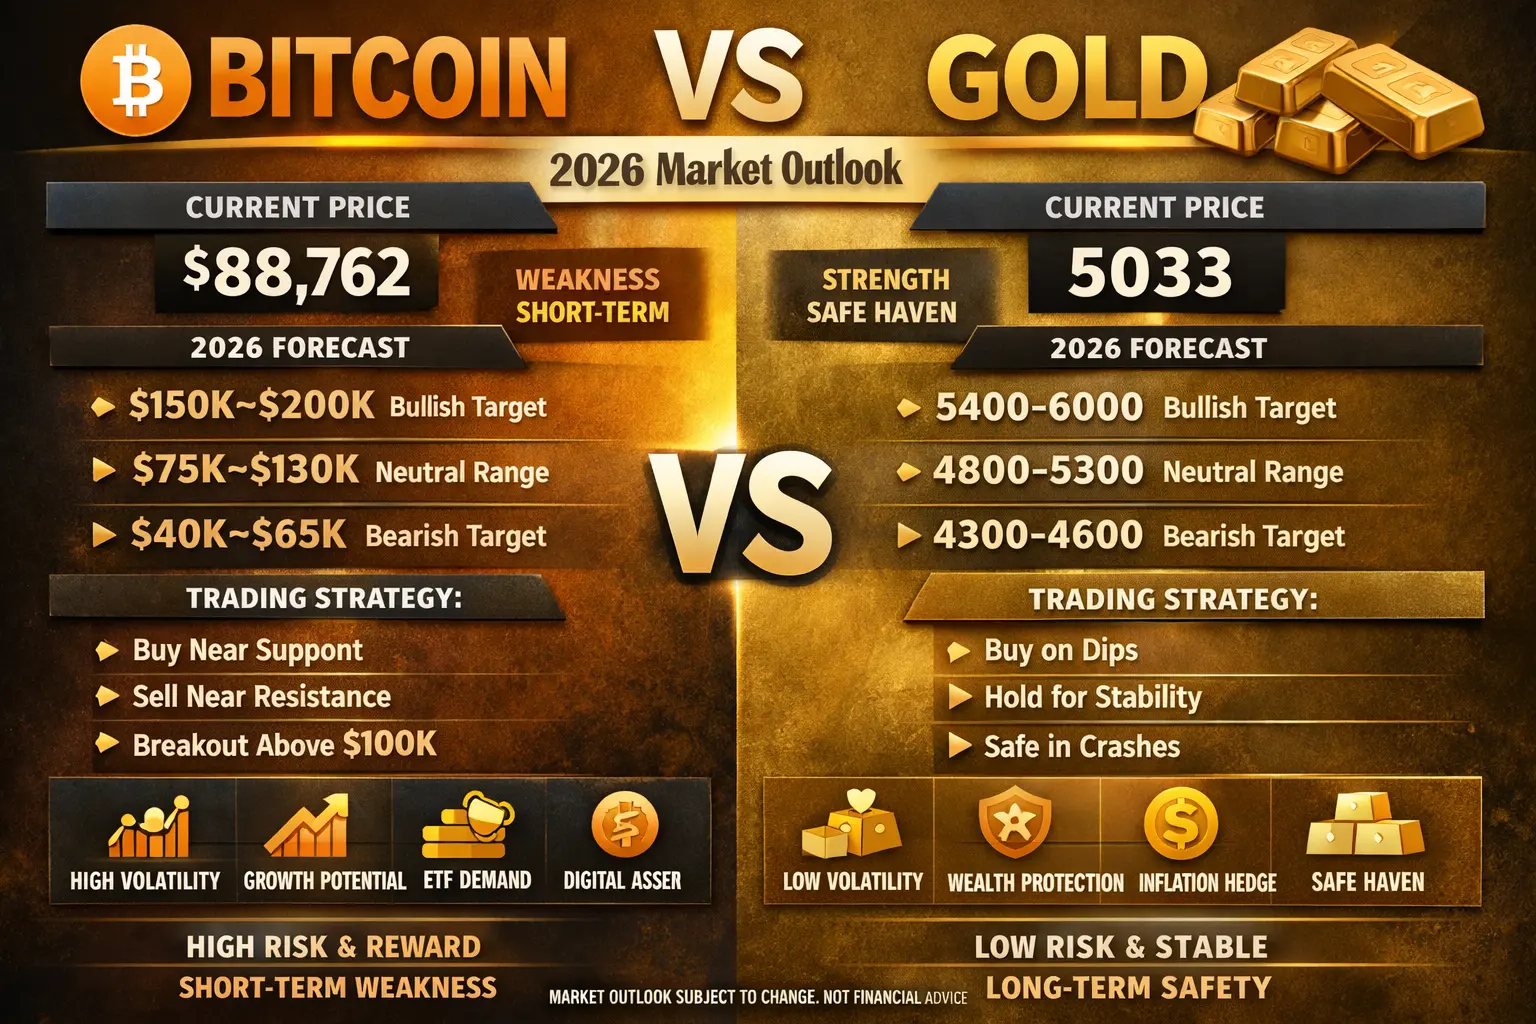
This lowest point is our opening price of 2824. If you want to set a stop loss, just set it at 2823.Bitcoin is currently trading around $88,762, sitting at a critical market level after a major bull run. While Bitcoin remains a strong long-term digital asset, it is showing short-term weakness due to reduced liquidity, slower ETF inflows, profit-taking, and high global interest rates. Price volatility remains high, creating both risk and opportunity. Bitcoin’s future direction depends on institutional demand, global economic conditions, and whether it can reclaim key resistance levels.
Bitcoin Current Price: $88,762
BTC is consolidating near a major psychological price zone.
Bitcoin Is Showin
Bitcoin Current Price: $88,762
BTC is consolidating near a major psychological price zone.
Bitcoin Is Showin

- Reward
- 8
- 10
- Repost
- Share
楚老魔:
2026 Go Go Go 👊View More
#加密市场观察 Bitcoin Crash! It’s no longer recognizable
Once upon a time, Bitcoin was hailed as “digital gold” and “the safe haven asset of the 21st century,” with its supporters claiming that this cryptocurrency, like traditional gold, possesses dual properties of inflation resistance and hedging.
In the early stages of the 2020 pandemic, when Bitcoin and gold rose in tandem, this narrative seemed to be validated by the market. However, over time, Bitcoin’s performance increasingly diverged from its “digital gold” positioning.
This week’s sharp decline in Bitcoin was directly triggered by mark
BTC-1,52%

[The user has shared his/her trading data. Go to the App to view more.]
- Reward
- 4
- 10
- Repost
- Share
HighAmbition:
2026 GOGOGO 👊View More
Key crypto market structure hearing coming next week
266
- Reward
- like
- Comment
- Repost
- Share
孔子
孔子
Created By@PiggyFromTheOcean
Listing Progress
100.00%
MC:
$30.17K
Create My Token
This is who you are trading against.
- Reward
- like
- Comment
- Repost
- Share
- Reward
- like
- Comment
- Repost
- Share
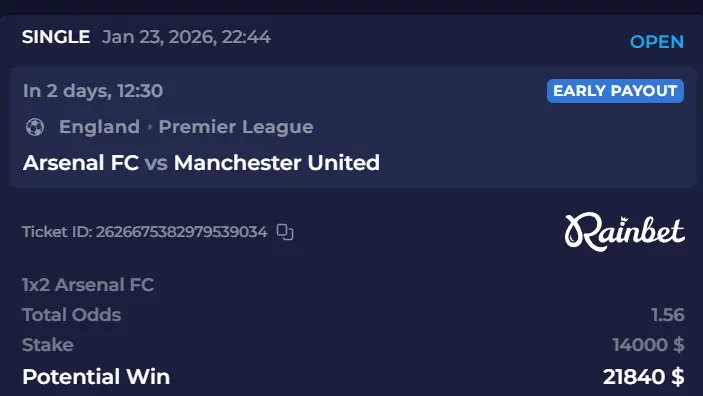
perma punting Arsenal continues
- Reward
- like
- Comment
- Repost
- Share
Bitcoin in Brief
Bitcoin is the world’s first decentralized digital currency, launched in 2009 by the mysterious creator known as Satoshi Nakamoto. It runs on a blockchain, a public ledger that records all transactions securely and transparently.
Unlike traditional money, Bitcoin is not controlled by banks or governments. Its supply is limited to 21 million coins, making it resistant to inflation. People use Bitcoin both as an investment and as a payment method, though its price is highly volatile.
Supporters see Bitcoin as a step toward financial freedom and innovation, while critics warn
BTC-1,52%
- Reward
- 1
- 1
- Repost
- Share
Mr.WarGod :
:
A scamLoad More
Join 40M users in our growing community
⚡️ Join 40M users in the crypto craze discussion
💬 Engage with your favorite top creators
👍 See what interests you
Trending Topics
View More64.7K Popularity
39.1K Popularity
32.34K Popularity
14.58K Popularity
26.32K Popularity
Hot Gate Fun
View More- MC:$3.39KHolders:10.00%
- MC:$3.46KHolders:20.19%
- MC:$3.39KHolders:10.00%
- MC:$3.39KHolders:10.00%
- MC:$3.41KHolders:20.00%
News
View MoreData: Internal Bitcoin exchange traffic drops to approximately 14,000 coins, the lowest level since 2022
23 m
Qian Zhimin's Bitcoin recovery case holds a procedural hearing in the UK, with the judge focusing on the issue of "proxy proliferation" involving Chinese victims.
35 m
Scroll co-founder’s X account has been compromised. Do not interact with any links or private messages.
1 h
Warden completes $4 million strategic financing, with 0G, Messari, and Venice participating.
2 h
Aztec: AZTEC TGE proposal sequencer signal confirmation completed and community voting will commence
2 h
Pin