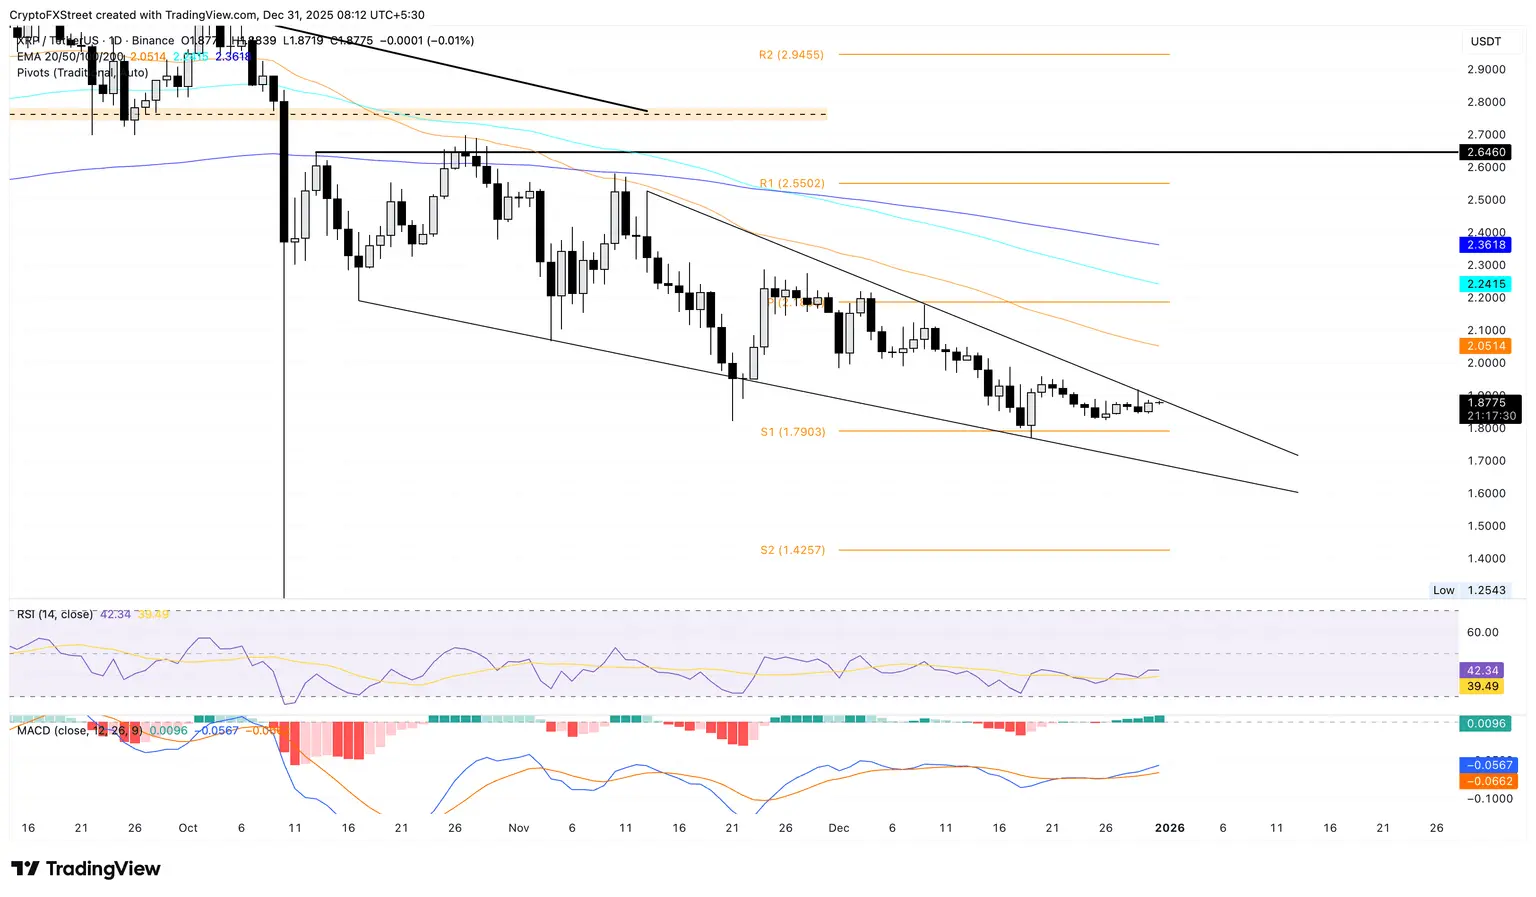
Bitcoin Price Outlook: Bitcoin Lacks a Clear Direction as Consolidation Continues
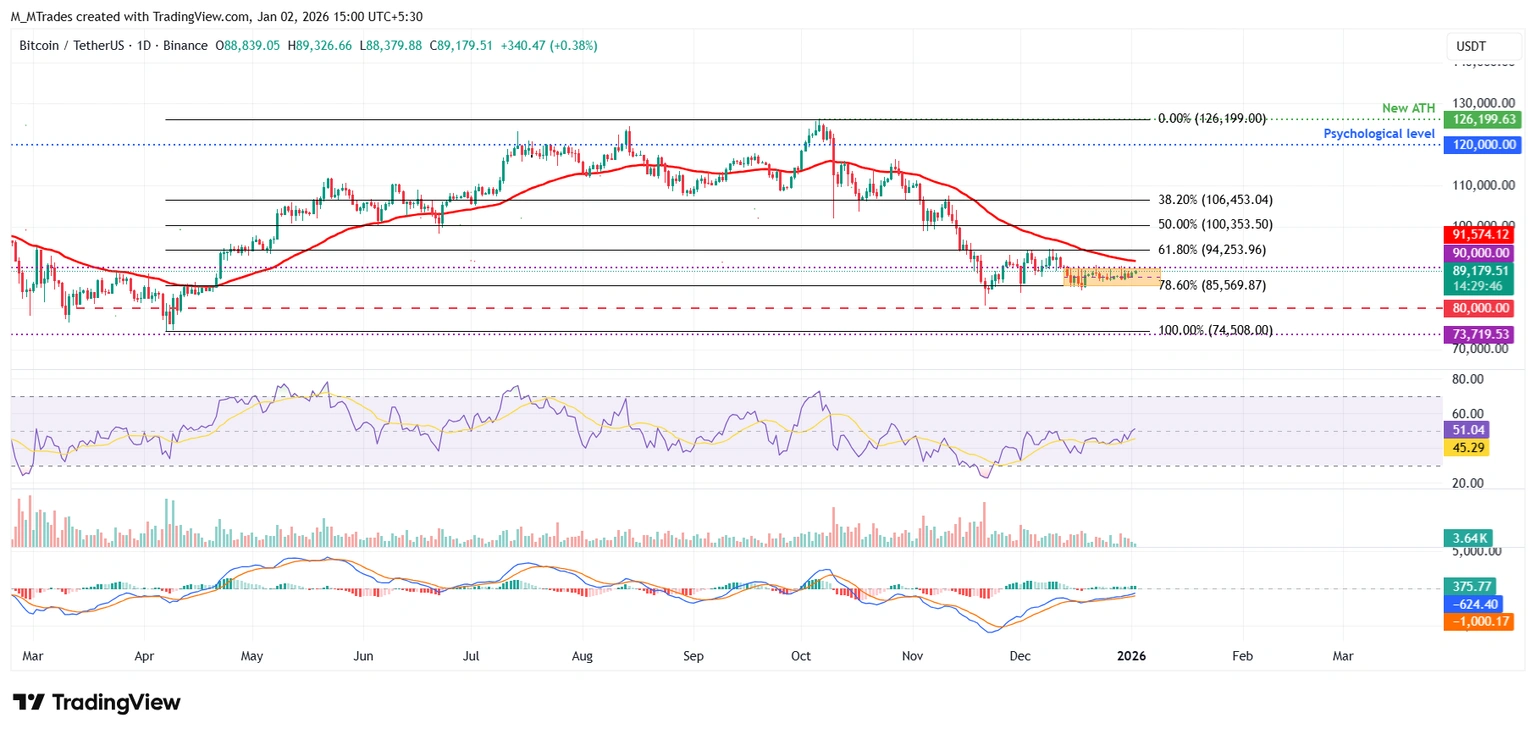
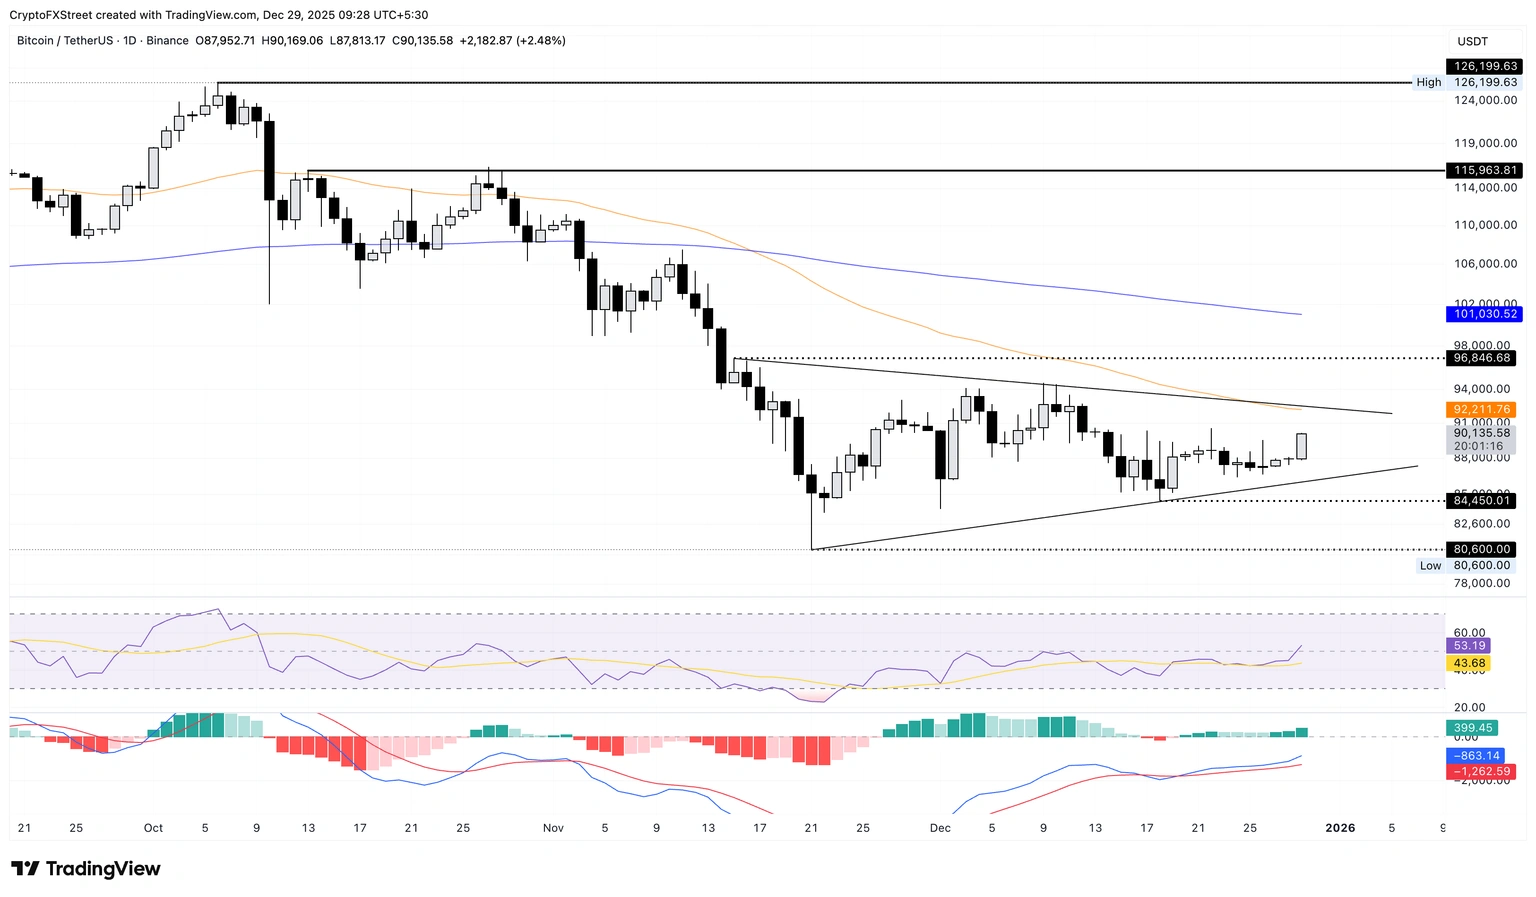
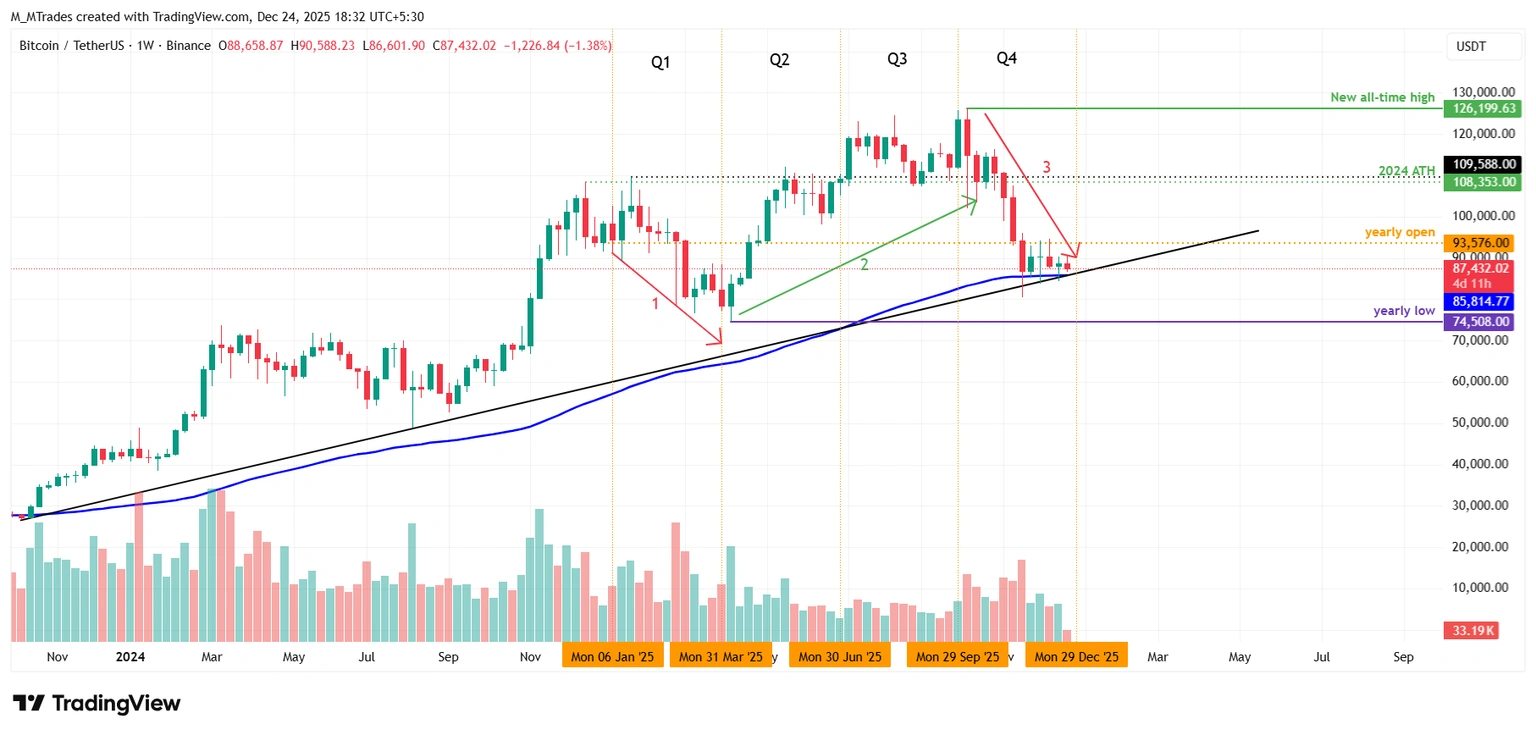
Bitcoin's price has been fluctuating between $85,500 and $90,000 for nearly three weeks, indicating a state of market instability. On Friday, Bitcoin's price reached approximately $89,000.
If Bitcoin surpasses $90,000 and closes above it daily, the rally could extend toward the next resistance level at $94,253, which aligns with the 61.8% Fibonacci retracement level drawn from the April low of $74,508 to the all-time high in October at $126,199.
The daily RSI( indicator stands at 51, above the neutral 50 level, indicating a slowdown in bearish momentum. To ensure continued bullish momentum, the RSI must remain above the neutral level. Meanwhile, the MACD) indicator showed a bullish crossover on December 20, which remains valid, supporting a slight bullish outlook.
Daily chart of the BTC/USDT pair
However, if Bitcoin undergoes a correction, the decline could extend toward the minimum accumulation zone around $85,500.
(
)