Trade
Basic
Futures
Futures
Hundreds of contracts settled in USDT or BTC
Options
HOT
Trade European-style vanilla options
Unified Account
Maximize your capital efficiency
Demo Trading
Futures Kickoff
Get prepared for your futures trading
Futures Events
Participate in events to win generous rewards
Demo Trading
Use virtual funds to experience risk-free trading
Earn
Launch
CandyDrop
Collect candies to earn airdrops
Launchpool
Quick staking, earn potential new tokens
HODLer Airdrop
Hold GT and get massive airdrops for free
Launchpad
Be early to the next big token project
Alpha Points
NEW
Trade on-chain assets and enjoy airdrop rewards!
Futures Points
NEW
Earn futures points and claim airdrop rewards
Investment
Simple Earn
Earn interests with idle tokens
Auto-Invest
Auto-invest on a regular basis
Dual Investment
Buy low and sell high to take profits from price fluctuations
Soft Staking
Earn rewards with flexible staking
Crypto Loan
0 Fees
Pledge one crypto to borrow another
Lending Center
One-stop lending hub
VIP Wealth Hub
Customized wealth management empowers your assets growth
Private Wealth Management
Customized asset management to grow your digital assets
Quant Fund
Top asset management team helps you profit without hassle
Staking
Stake cryptos to earn in PoS products
Smart Leverage
NEW
No forced liquidation before maturity, worry-free leveraged gains
GUSD Minting
Use USDT/USDC to mint GUSD for treasury-level yields
More
SignalCryptoID
No content yet
SignalCryptoID
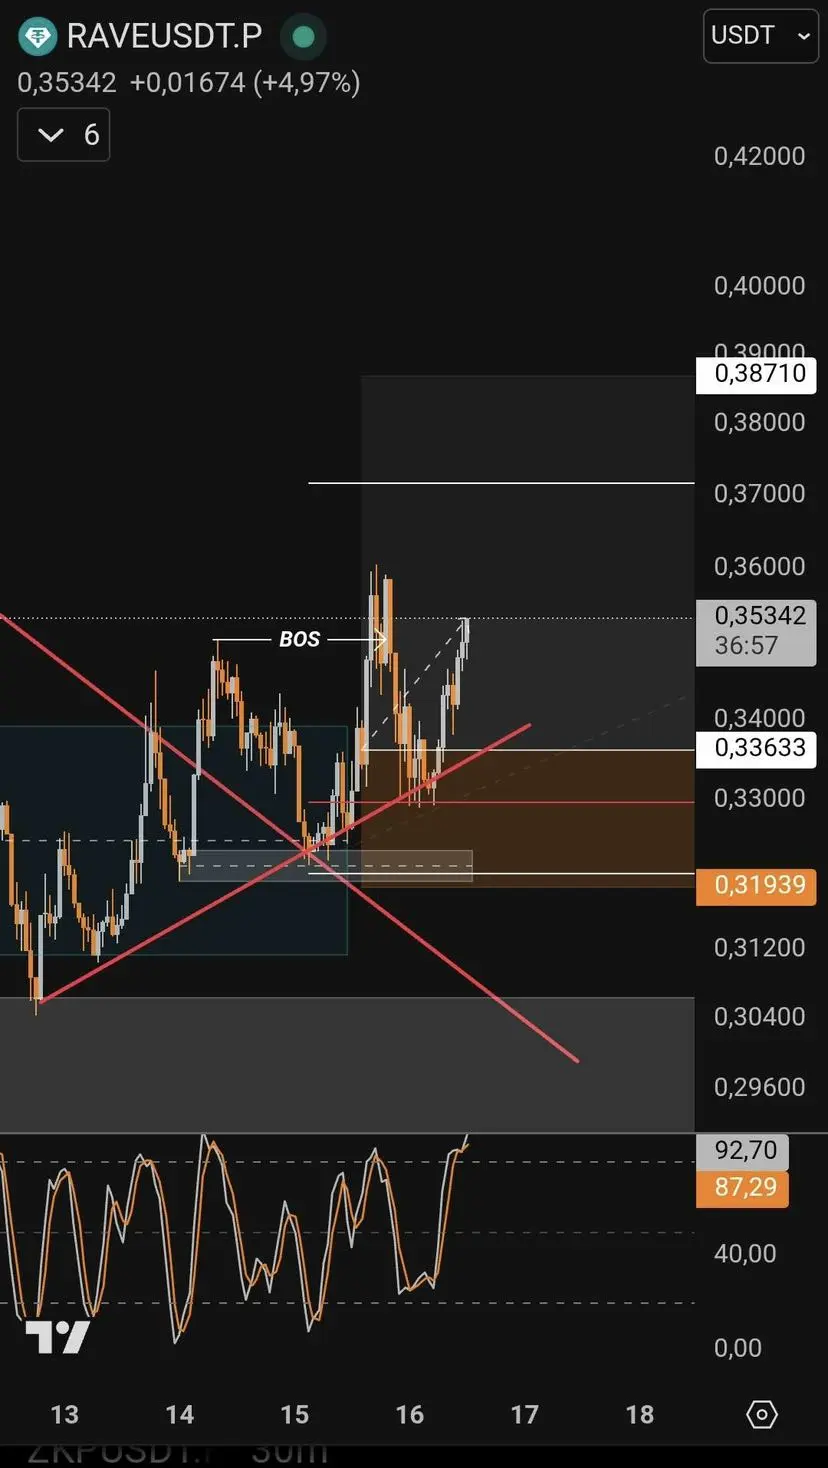
What do you think of this trade?
Yay
No
0 ParticipantsEnds In 8 Hour
[The user has shared his/her trading data. Go to the App to view more.]
- Reward
- like
- Comment
- Repost
- Share
🚨 U.S. House Moves Forward on 3 Major Crypto Bills
In a pivotal moment for crypto regulation, the U.S. House of Representatives has passed a procedural vote to advance three key bills — the GENIUS Act, the Clarity Act, and the Anti-CBDC Bill — paving the way for a final floor vote expected Thursday.
⸻
📜 What’s on the table?
1. GENIUS Act
Aims to establish a clear regulatory framework for stablecoins.
✅ Already passed the Senate
🖊️ Could be signed by President Trump this weekend
2. Digital Asset Market Structure (Clarity) Act
Defines the roles of the SEC and CFTC in overseeing crypto marke
- Reward
- like
- Comment
- Repost
- Share
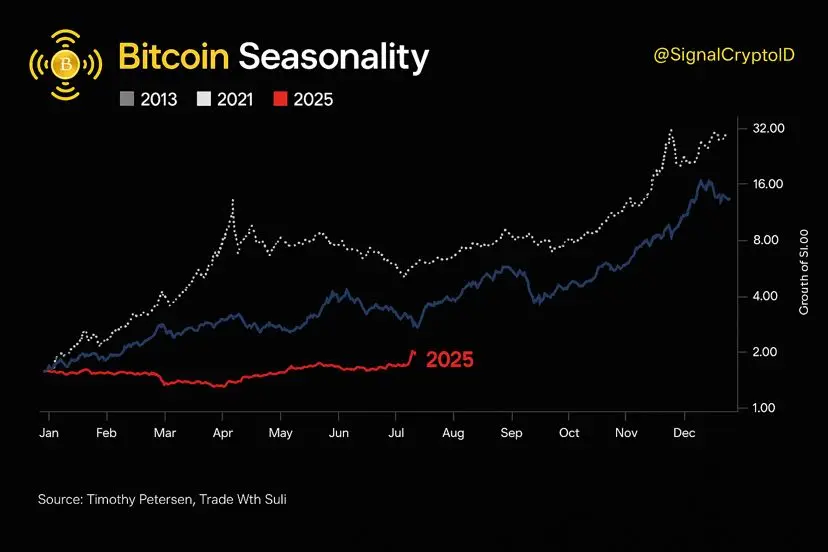
📊 Bitcoin Seasonality Watch
This chart highlights Bitcoin’s historical seasonal growth patterns across the cycles of 2013, 2017, 2021 — and the current one.
What’s notable?
BTC historically tends to rally through August, followed by a minor pullback… before continuing its upward momentum toward year-end.
⸻
🔍 Takeaway:
Seasonal data suggests Bitcoin still has room to climb as we move through the second half of the year.
Stay sharp. Patterns may not guarantee the future, but they do leave clues.
—
⚠️ Not Financial Advice. Always DYOR.
BTC0,05%
- Reward
- like
- Comment
- Repost
- Share
📈 PEPE Swing Trade (Long) – Perpetual Futures
🟢 Entry: $0.00001309 or Current Market Price (CMP)
🔴 Stop Loss: $0.00001244
🎯 Take Profit (TP): $0.00001506
Why this trade?
We’re seeing strong volume confirming a breakout from a classic Cup and Handle pattern—technically a bullish setup.
🔍 Success Probability: 7/10
⚠️ Invalidation: If price closes back below the descending channel range, setup becomes invalid.
⸻
📌 IMPORTANT: Trade Rules & Disclaimer
1. I can be wrong — please manage your risk properly. Only risk what you’re absolutely okay with losing.
2. If you’re unfamiliar with risk ma
PEPE0,72%
[The user has shared his/her trading data. Go to the App to view more.]
- Reward
- like
- Comment
- Repost
- Share
🚨 Ethereum Surges 6% to $3,337 This Morning
#ETH jumps as institutional demand spikes via spot ETFs.
🟢 $256M inflows today
🟢 $151.4M from BlackRock’s iShares ETF
🟢 16 days straight of positive inflows
🟢 Total ETF AUM: $13.5B+
Arthur Hayes calls it: “Ethereum Season”
DeFi & NFT revival ahead?
Also: $310M in leveraged positions liquidated (72% long) → short squeeze 👀
—
Not financial advice. DYOR.
ETH-0,27%

- Reward
- like
- Comment
- Repost
- Share
Trending Topics
View More27.85K Popularity
34.84K Popularity
20.73K Popularity
3.99K Popularity
2.53K Popularity
Pin