ChangXin Technology (CXMT) stands apart from Samsung Electronics, SK Hynix, and Micron Technology primarily in its global DRAM market position and HBM product depth. The first three companies have long dominated industry capacity and high-end memory supply, while ChangXin Technology, as a leading DRAM stock expected to list on the STAR Market, continues to expand standard DRAM production but still faces a technical gap in high-end categories compared to the industry leaders. To understand the stock narrative for ChangXin Technology (CXMT), it is essential to place all four companies within the same DRAM competitive framework and distinguish their respective listing markets and business focus.
What is Samsung Electronics?
Samsung Electronics is a comprehensive semiconductor and consumer electronics giant listed on Korea's KRX under stock code 005930. Its DRAM business is part of the Device Solutions (DS) division, and it ranks among the world's largest memory chip manufacturers.
Samsung Electronics' DRAM portfolio serves servers, mobile devices, and PCs, with HBM supply tied with SK Hynix at the forefront of the industry. Its revenue structure is highly diversified, including NAND, foundry services, display, and mobile phones in addition to DRAM. DRAM cycles should be analyzed by division and not equated with "pure DRAM stocks." Samsung Electronics typically leads the global "big three," and research on its stock must consider both memory cycles and the impact of group diversification.
What is SK Hynix?
SK Hynix is a semiconductor memory company listed on Korea's KRX under stock code 000660, with a primary focus on DRAM and NAND. It is a major HBM supplier during the surge in AI computing.
SK Hynix's revenue is tightly linked to memory manufacturing, with DRAM and HBM weighting significantly higher than Samsung Electronics' diversified group structure. HBM has entered the supply chain for NVIDIA and other AI accelerator cards, creating a layered revenue structure between high-end memory and standard DDR. On Gate, SKHYNIXG tracks SK Hynix stock, while CXMT's A-share and futures paths belong to a different market system. SK Hynix generally ranks second globally, and HBM technology iteration is a key variable distinguishing the high-end competitiveness of these companies.
What is Micron Technology?
Micron Technology, Inc. is a semiconductor memory company listed on the US Nasdaq under stock code MU, operating both DRAM and NAND. It is the only Western manufacturer in the global top tier for DRAM.
Micron Technology's products are used in servers, PCs, smartphones, and AI infrastructure, with revenue affected by both DRAM and NAND cycles. Its HBM mass production started later than SK Hynix but is catching up. Its business focus is purer than Samsung Electronics and closer to "memory manufacturing." Micron generally ranks third globally, and together the three companies hold most of the industry's market share, while also being subject to US export control policies.
What is ChangXin Technology?
ChangXin Technology (CXMT) is the listed entity of ChangXin Memory Technologies, specializing in DRAM design, manufacturing, and sales. In the context of Gate and capital markets, it is recognized as China's leading DRAM stock.
ChangXin Memory is responsible for R&D and mass production, while ChangXin Technology serves as the listing platform connecting to the STAR Market and on-chain derivatives. ChangXin DRAM business structure breaks down revenue logic by categories such as DDR4 and LPDDR4. Compared to the big three, its global share is still in the catch-up stage, but it plays a structural role in domestic supply chain autonomy and capacity expansion. The stock can be accessed via A-shares, Hyperliquid Pre-IPO, and Gate pre-market perpetuals. How investors participate in ChangXin Technology details the rights differences across these three paths. On-chain futures are derivatives, and the Hyperliquid CXMT mechanism explains HIP-3 pricing and settlement rules.
Table: Key Differences in DRAM Competitive Landscape
The four companies can be compared across listing market, DRAM business focus, global market share tier, and HBM layout. The table below summarizes structural differences to establish classification boundaries, without ranking any entity.
| Comparison Dimension |
Samsung Electronics (005930) |
SK Hynix (000660) |
Micron Technology (MU) |
ChangXin Technology (CXMT) |
| Listing Market |
Korea KRX |
Korea KRX |
US Nasdaq |
STAR Market (planned) |
| Business Focus |
Diversified group, DRAM is part of DS division |
Memory-focused, high DRAM+HBM weighting |
Dual DRAM+NAND categories |
Focused on DRAM |
| Global DRAM Share |
Top tier (about 40%) |
Top tier (about 25%) |
Top tier (about 20%) |
Catch-up stage (single digit to low teens) |
| HBM Layout |
HBM3E mass production supply |
HBM3E main supplier |
HBM3 ramping up |
Mainly standard DRAM, HBM still developing |
| Main Downstream |
Servers, mobile, PC, AI accelerator cards |
AI accelerator cards, servers, mobile |
Servers, PC, mobile, AI |
Domestic servers, mobile, PC |
| Stock Exposure Path |
KRX actual shares / SKHYNIXG etc. |
KRX actual shares / SKHYNIXG |
US MU shares |
A-shares / on-chain futures / Gate pre-market perpetuals |
The table illustrates that "DRAM" is only a broad industry classification. Samsung Electronics' group diversification, Micron Technology's dual-category structure, and ChangXin Technology's domestic catch-up role mean the four companies' financial indicators and cycle exposure are not directly comparable. Share data are interval estimates tracked by industry research institutions (such as CFM Flash Market, TrendForce), with specific percentages varying according to capacity deployment and demand cycles.
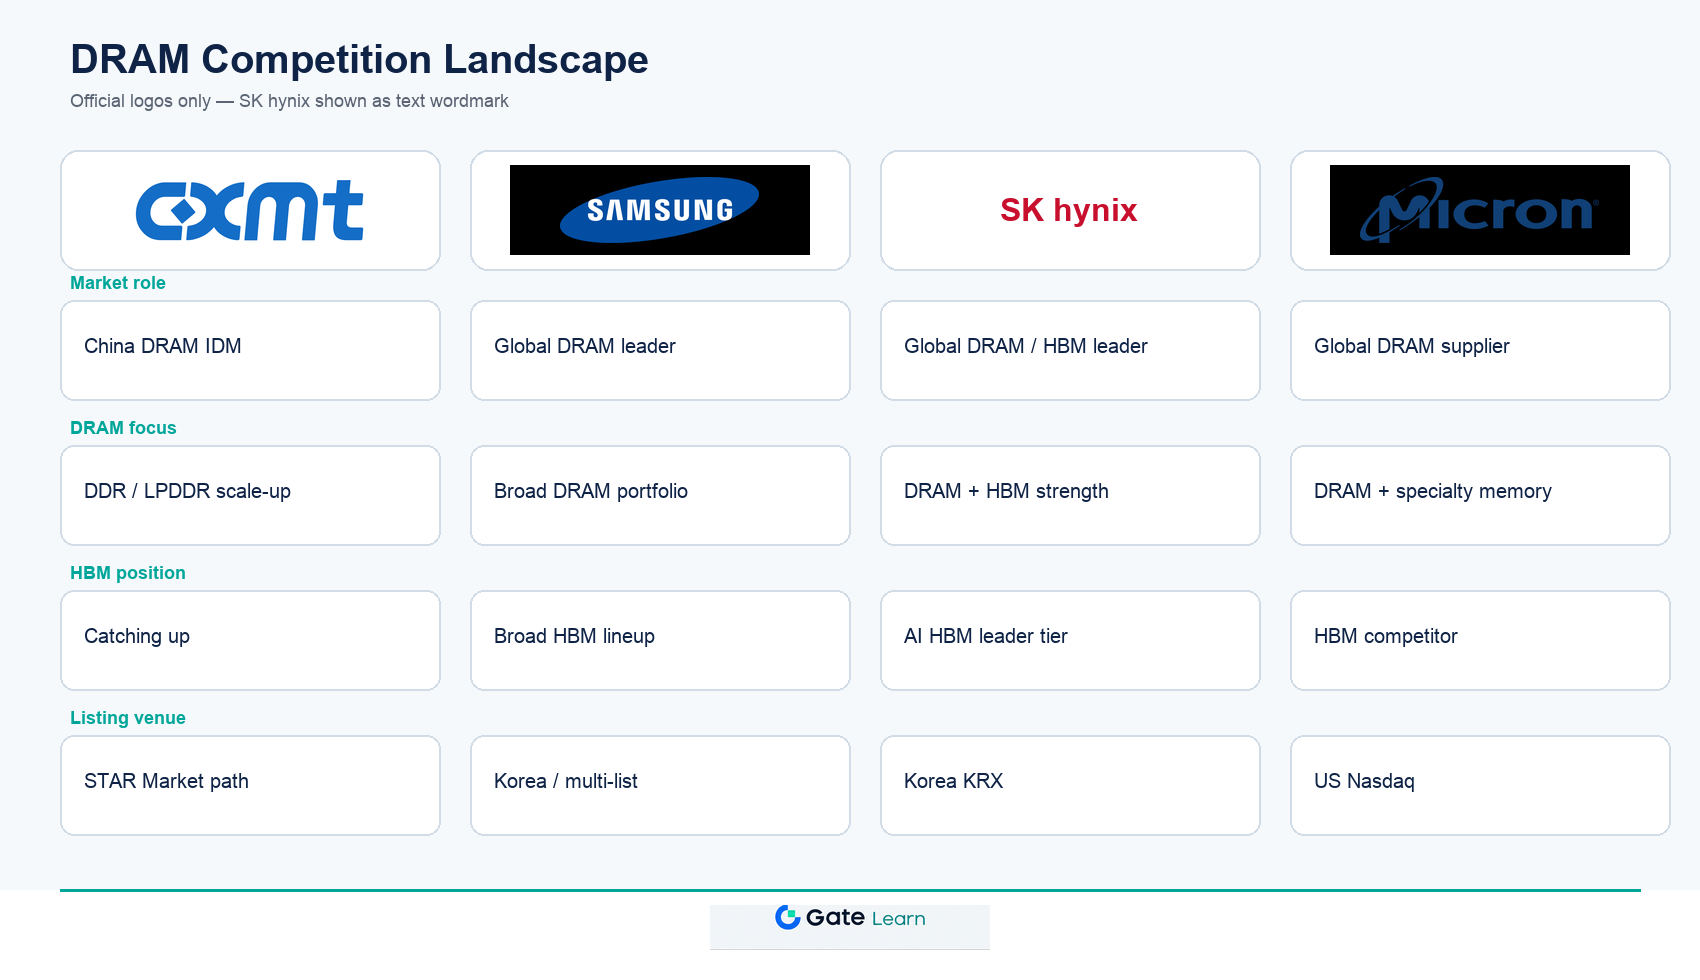 Figure 1. DRAM stock competitive dimensions: ChangXin Technology, Samsung Electronics, SK Hynix, and Micron Technology.
How are HBM and Capacity Structure Layered for Comparison?
HBM represents the high-end tier of DRAM competition driven by AI computing demand, and the four companies' capacity and technology nodes are not symmetric in this dimension. The table below summarizes by category depth and capacity role, highlighting the differences between "standard DRAM expansion" and "HBM supply."
| Layering Dimension |
Samsung Electronics |
SK Hynix |
Micron Technology |
ChangXin Technology |
| Standard DRAM (DDR4/LPDDR4 etc.) |
Full category coverage, largest capacity |
Full category coverage, second largest capacity |
Full category coverage, third largest capacity |
Mainly mature categories, continuous expansion |
| Advanced DRAM (DDR5/LPDDR5) |
Mass production supply |
Mass production supply |
Mass production supply |
In progress |
| HBM (High Bandwidth Memory) |
HBM3E mass production, supplies AI accelerator cards |
HBM3E main supplier |
HBM3 ramping up |
Still accumulating technology |
| Capacity Expansion Driver |
Advanced process + HBM capital expenditure |
HBM and DDR5 dual expansion |
US domestic fab + HBM |
Domestic fab expansion, equipment localization |
| Geography and Supply Chain |
Korea manufacturing, global customers |
Korea manufacturing, global customers |
Primarily US manufacturing, subject to export controls |
China manufacturing, domestic supply chain focus |
The differences in the HBM tier indicate that, when studying AI memory supply, Samsung Electronics and SK Hynix are in the same comparison group, Micron Technology is the pursuer, and ChangXin Technology is currently more focused on standard DRAM capacity and supply chain autonomy. Comparing all four companies' HBM progress without marking technology gaps may mislead readers into interpreting industry structure differences as operational capability rankings.
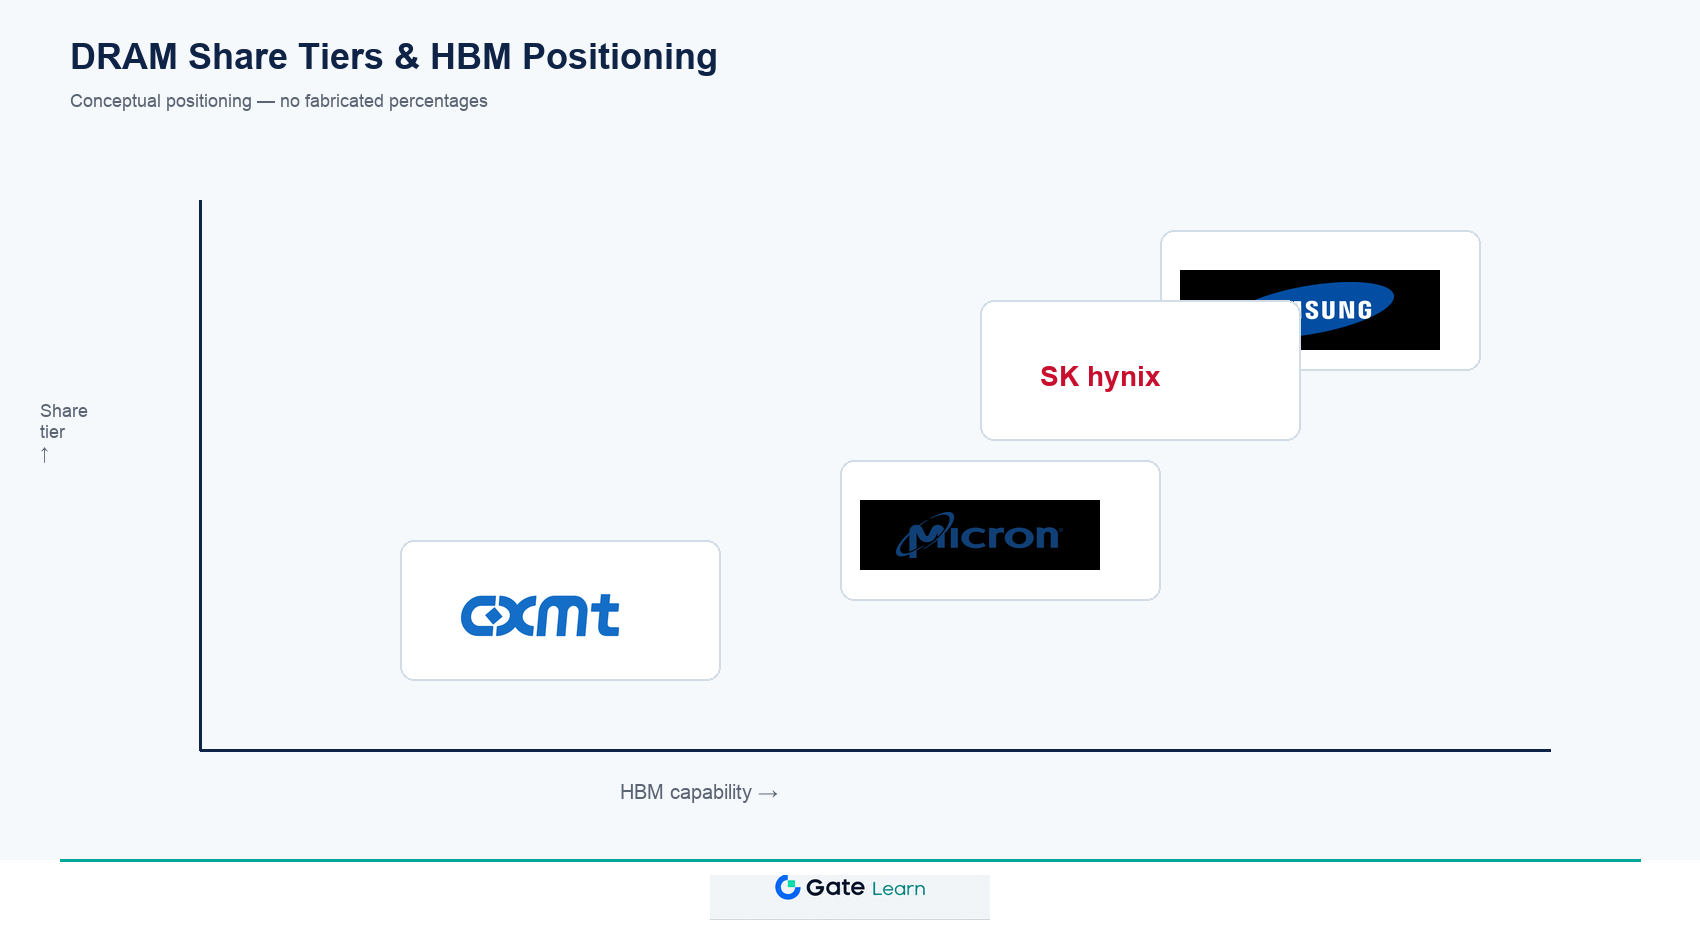 Figure 2. Global DRAM market share tiers and HBM capability positioning: The big three dominate high-end memory, ChangXin Technology focuses on standard DRAM expansion.
What are the limitations when comparing?
There are structural limitations in the horizontal comparison of ChangXin Technology with Samsung, SK Hynix, and Micron that must be understood before drawing conclusions.
Share and Financial Reporting Are Not Consistent
CFM and TrendForce estimate market share based on shipment volume, while each company's financial reports are disclosed by division. ChangXin Technology's granularity may change before and after listing; cross-company comparisons must clearly indicate sources and definitions.
Business Focus Limits Financial Comparability
Samsung's DS division covers only part of group revenue, Micron includes NAND, and ChangXin does not yet have a complete public financial report. Gross margin or capex comparisons must specify business boundaries.
HBM and Standard DRAM Cycles Are Not Synchronized
HBM supply shortages and DDR price cycles may diverge; the big three's HBM weighting is higher than ChangXin's, so the four should not be grouped under the same cycle logic.
Stock Path and Rights Structure Are Different
KRX actual shares, US MU shares, A-share CXMT, and on-chain derivatives differ in registered equity, trading hours, and settlement currency.
Summary
ChangXin Technology (CXMT), Samsung Electronics, SK Hynix, and Micron Technology are all part of the DRAM storage sector, but differ in global market tier, HBM product depth, business focus, and listing market. The big three collectively hold the main global DRAM capacity and lead HBM supply, while ChangXin Technology, as the leading domestic DRAM stock, focuses on standard DRAM expansion and supply chain autonomy. The purpose of comparison is to establish clear boundaries and classification frameworks, not to judge the superiority or inferiority of any entity.
FAQ
Who are the "big three" in the DRAM industry?
The global DRAM industry has long been dominated by Samsung Electronics, SK Hynix, and Micron Technology, who together hold most of the global DRAM market share. Industry research institutions (such as TrendForce, CFM Flash Market) continuously track the share changes of these companies by shipment volume or revenue.
Where do ChangXin Technology and Samsung, SK Hynix differ?
The differences are mainly in global DRAM market tier, HBM product mass production progress, and business scale. Samsung Electronics and SK Hynix lead in capacity and HBM supply, Micron Technology ranks third; ChangXin Technology continues to ramp up standard DRAM production and supply chain autonomy, and is still catching up in HBM.
How do the four companies' HBM layouts differ?
Samsung Electronics and SK Hynix are at the forefront of HBM3E mass production supply and are main suppliers of memory for AI accelerator cards. Micron Technology's HBM3 is ramping up mass production. ChangXin Technology currently focuses on standard DRAM, with HBM still in technology accumulation and capacity preparation.
How are ChangXin Technology stock and Korean/US memory stocks distinguished?
ChangXin Technology plans to list on the STAR Market and can also be accessed via Hyperliquid and Gate pre-market perpetuals for derivatives exposure. Samsung Electronics (005930) and SK Hynix (000660) trade on Korea's KRX, Micron Technology (MU) trades on US Nasdaq. The four differ in listing market, settlement currency, and shareholder rights structure.
What are the most common mistakes when comparing the four DRAM stocks?
Common mistakes include not distinguishing Samsung Electronics' group scope from pure DRAM scope, directly ranking ChangXin Technology against the big three's market share, ignoring HBM and standard DRAM cycle differences, and confusing the attributes of A-share actual shares with on-chain derivative futures.
What other information should be considered when studying CXMT stock?
Beyond the competitive landscape, investors should monitor ChangXin Technology's STAR Market IPO progress, DRAM capacity ramp-up pace, advanced process development, and the product attributes and risk boundaries of the three participation paths: A-shares, Hyperliquid, and Gate. Competitive comparison provides industry context and does not constitute trading advice.