
According to Farside data, during the trading week from April 13 to 17 in U.S. Eastern Time, U.S. Bitcoin spot ETFs recorded $996 million in net inflows, the highest weekly inflow level since mid-January 2026, and the third consecutive week of net inflows.
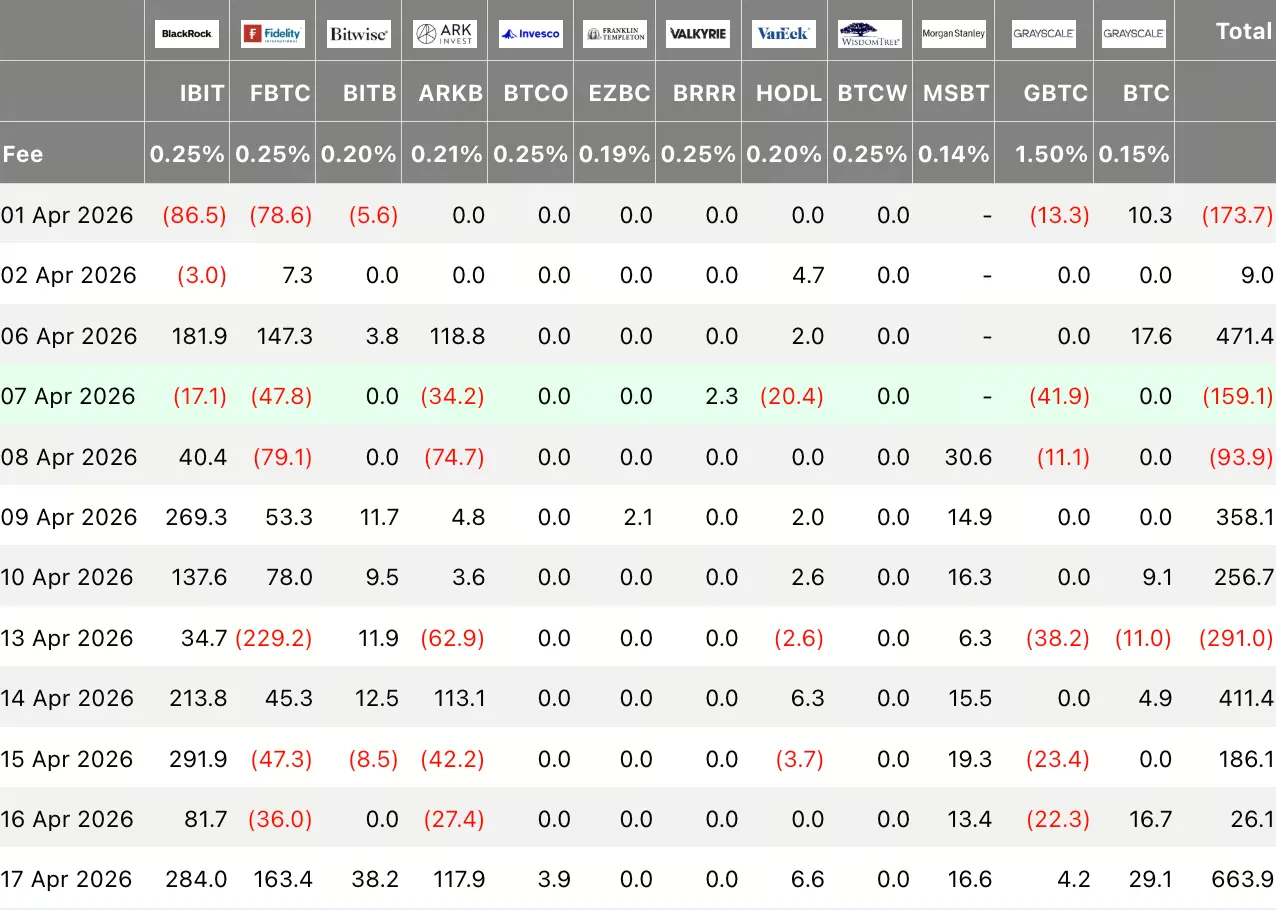
Image source: Farside
In terms of intraday distribution, this $996 million was not evenly spread across the five trading days. The flow-in rhythm shows a clear “weekend-end acceleration” pattern: on Friday, net inflows were $664 million, the highest single-day figure for the week; on Tuesday and Wednesday, inflows were $412 million and $186 million respectively; on Thursday, inflows slowed to $26 million; while on Monday, the week recorded roughly $291 million in net outflows. A move within the week from net outflows to net inflows on a single day set a record, indicating that market sentiment remained divided at the start of the week. However, as macro expectations shifted, institutional capital quickly reached consensus in the latter half of the week.
At the product level, last week saw seven Bitcoin spot ETFs record net inflows, with BlackRock’s IBIT accounting for $906 million in net inflows for the week, representing 91% of the total net inflows for the week—highly concentrated capital. ARK & 21 Shares’ ARKB recorded $98.5 million in weekly net inflows, ranking second; Fidelity’s FBTC, however, saw weekly net outflows of $104 million.
How did the macro backdrop drive a rebound in risk appetite this time?
The timing of the inflows closely matched the marginal shifts in the macro environment. In the week of April 13, Iranian temporarily reopened the Strait of Hormuz, which to some extent eased global energy supply tightness expectations, prompting traders to shift toward risk assets including Bitcoin. Meanwhile, Polymarket contract data shows the probability that Bitcoin will set a new all-time high before December 31, 2026 has risen to 17.5%, up from 14% one week earlier.
The broader driving force came from signals in inflation data. U.S. March CPI data showed core CPI at 2.6% year over year, below the market expectation of 2.7%. Core CPI month over month was only 0.2%, also below the expected 0.3%. This data combination released a key signal: the upward movement in March inflation was almost entirely driven by energy prices, while underlying inflation persistence was not as worrisome as the overall numbers might suggest. This cooled the market’s expectation at the margin that the Federal Reserve would maintain a tight policy stance, directly triggering a return of capital to risk assets.
It’s worth emphasizing that the dual effect of easing geopolitics and inflation signals forms the macro foundation for this round of institutional capital returning. But both factors are short-term variables, and their durability still needs close monitoring.
What does the strong inflow into BlackRock IBIT imply?
BlackRock’s IBIT recorded $906 million in net inflows for the week, accounting for more than 90% of the total net inflows for the week. This level of concentration itself is a structural signal worth paying attention to. IBIT’s historical cumulative net inflows have reached $64.63 billion, far ahead of all other Bitcoin spot ETFs.
Looking at it over a longer time horizon, IBIT’s market position was not established only recently. In the first quarter of 2026, IBIT recorded $8.4 billion in net inflows, more than twice that of any competing product in the same period. As of March 30, 2026, U.S.-listed Bitcoin spot ETFs collectively held about 1.29 million BTC, with a total size of approximately $86.9 billion, of which BlackRock’s IBIT alone accounted for roughly 60% of the category’s assets.
The implications of this trend toward concentration are worth deeper analysis. In the highly homogeneous Bitcoin spot ETF market by investment strategy, fee differences are the core differentiating metric. BlackRock IBIT’s management fee is 0.25%, higher than Morgan Stanley’s MSBT at 0.14% and Grayscale’s Bitcoin Mini Trust at 0.15%. Yet IBIT is still able to attract the largest share of institutional capital. This suggests that within institutional investors’ decision framework, the importance of brand credibility, depth of distribution networks, and liquidity depth often outweighs pure cost considerations. This means competition in the Bitcoin ETF market has moved from a “fee battle” to a comprehensive competition of “trust and scale.”
Have three consecutive weeks of net inflows formed a trend signal?
Data on three consecutive weeks of net inflows needs to be assessed within a longer time horizon. In the first quarter of 2026, the total asset size of Bitcoin ETFs had fallen by nearly 35% from the mid-January peak of $128 billion. The sharp pullback in Q1 contrasted with capital outflows since the beginning of the year. In comparison, the recent net inflows over three consecutive weeks—by direction—constitute a trend reversal signal.
But in terms of scale, this reversal is still at an early stage. In the week of April 7 to 13, Bitcoin spot ETFs recorded total net inflows of about $786 million; in the week of April 13 to 17, net inflows expanded further to $996 million. Weekly inflow size is increasing week by week, but from the perspective of capital structure, differentiation within the market remains significant. Last week, Fidelity’s FBTC saw net outflows of $104 million, in contrast to IBIT’s strong inflows. This kind of split implies that the current net inflows are driven mainly by IBIT alone, rather than a broad-based “across-the-board” rush of capital into the whole market. Establishing a trend signal requires net inflows to be synchronized across more products as a validation condition.
After total assets break $8B, how do we measure institutionalization depth?
As of April 17, Bitcoin spot ETF total net asset value had reached $101.45 billion, and the ETF net asset ratio (ETF market value as a proportion of total Bitcoin market value) rose to 6.55%. This ratio implies that among roughly every 15 Bitcoins globally, 1 is held through the spot ETF channel.
From a more macro asset allocation framework, this penetration rate is still relatively low, but the growth slope is worth monitoring. When Bitcoin spot ETFs were approved and launched in 2024, the total scale was only about $56 billion. As of April 2026, the combined assets under management of the five major crypto asset management firms have already surpassed the $8B mark. Over about 18 months, the scale is approaching doubling, and growth has been driven primarily by sustained net inflows from institutional capital rather than price momentum—this in itself is direct evidence that the institutionalization process is accelerating.
It’s also notable that the current 6.55% net asset ratio does not mean institutional adoption of Bitcoin has reached saturation overall. On the contrary, this ratio is still at an early stage on the institutional allocation curve. Morgan Stanley’s Global Investment Committee recommends clients allocate 0 to 4% to crypto assets. That recommendation itself indicates that mainstream financial institutions are still exploring the upper limit of allocation ratios rather than having already hit the ceiling.
Which risk variables could affect the pace of subsequent inflows?
Although recent data shows a positive trend, risk variables that affect ETF capital flows are also worth systematically reviewing.
Geopolitical risk is the primary variable. The durability of the U.S.-Iran ceasefire agreement directly determines the risk-asset pricing environment. If the agreement were to break down again, safe-haven sentiment could quickly heat up, creating the risk of capital flowing out in the opposite direction. There is a tight transmission chain between the Strait of Hormuz’s navigation conditions and energy price expectations, and energy prices are one of the core variables in inflation expectations. The complexity of this transmission path means the impact of geopolitical risk on ETF capital flows is not linear.
Monetary policy direction is the second key variable. The path of Federal Reserve rate cuts will directly affect how investors price the risk-free rate, which then flows through to the attractiveness of allocating to risk assets like Bitcoin. If inflation stickiness exceeds expectations and pushes back the timing of rate cuts, it could suppress ETF capital inflows.
Internal capital structure is the third variable that cannot be ignored. As mentioned earlier, current net inflows are highly concentrated in BlackRock’s IBIT, while many other ETFs remain in net outflow status. This “concentration at the top with outflows at the tail” structure means market capital sentiment is still divided. If IBIT’s inflow momentum slows down while other products do not quickly take over, the overall net inflow scale could see a temporary pullback.
Technical factors and market sentiment are also worth watching. There is a two-way feedback mechanism between Bitcoin price and ETF inflows—price gains typically attract more chasing funds, while sustained net inflows provide support for prices. If this positive feedback loop is broken, it could trigger pressure for capital to flow out in the opposite direction.
Summary
Bitcoin spot ETFs recorded $996 million in net inflows for the week of April 13 to 17, 2026, the highest weekly level since mid-January, marking the third consecutive week of net inflows. BlackRock’s IBIT led the market with $906 million in net inflows, and its historical cumulative net inflows have reached $64.63 billion, accounting for about 60% of the category’s assets in Bitcoin spot ETFs. Total net asset value surpassed $101.45 billion, and the ETF net asset ratio rose to 6.55%. That means among roughly every 15 Bitcoins globally, 1 is held through the ETF channel. The macro drivers behind this round of capital inflows include reduced geopolitical risk and core inflation data coming in below expectations—together boosting market risk appetite. However, the continued geopolitical situation, uncertainty around the timing of Federal Reserve rate cuts, and the structural feature that capital is highly concentrated in a single product remain the core risk variables that could affect the pace of subsequent inflows. The trend of institutional allocations to crypto assets is continuing, but the sustainability of the trend still needs ongoing tracking and validation.
Frequently Asked Questions
Q: What does $996 million in net inflows for one week of Bitcoin spot ETFs mean?
This is the highest weekly inflow level since mid-January 2026, and it also marks the third consecutive week of net inflows. Compared with earlier weekly data, net inflows for the week of April 7 to 13 were about $786 million, and this week’s scale expanded further.
Q: Why can BlackRock IBIT continue to attract the largest share of capital?
IBIT continuously attracts funding allocations from institutional investors thanks to the brand endorsement of the world’s largest asset manager, a large institutional distribution network, and ample liquidity depth. As of April 17, IBIT’s historical total net inflows reached $64.63 billion, far outpacing all other Bitcoin spot ETFs.
Q: What does a 6.55% ETF net asset ratio mean?
This ratio indicates the share of Bitcoin market value currently held via spot ETFs is 6.55%—that is, among roughly every 15 Bitcoins globally, 1 is held through the ETF channel. A sustained rise in this ratio is often viewed as an important indicator of accelerating institutional adoption.
Q: What factors could affect the direction of subsequent ETF capital inflows?
The main risk factors include: the durability of the U.S.-Iran ceasefire agreement (directly impacting risk-asset sentiment), the timing of Federal Reserve rate cuts (which directly affects investors’ risk preferences in the interest-rate environment), and the technical direction of Bitcoin itself. In addition, the structural feature that capital is highly concentrated in IBIT means that if IBIT inflows slow down while other products fail to take over, overall net inflows may face a temporary decline.
Q: Does this round of capital inflows mean institutions are “buying the dip”?
From the data, this round of inflows occurred after a major pullback in the market in the first quarter. The total asset size of Bitcoin ETFs fell by nearly 35% from the $128 billion peak in mid-January, while the recent net inflows over three consecutive weeks, to a certain extent, reflect institutional capital’s reconfiguration after price pullbacks. However, it’s important to note that institutional capital allocation decisions are typically based on longer-term asset frameworks and should not be equated simply with short-term “dip buying.”

