The spot Bitcoin ETF market saw a significant reversal on April 27 after experiencing consecutive 9 trading days of net inflows. According to the latest market data, the total net outflow of Bitcoin spot ETFs on April 27 reached $263 million. This shift has prompted the market to re-examine institutional capital behavior and the stability of ETF structures.
Interruptions in the inflow trend are typically caused by the combined effect of multiple factors. The net inflows for 9 consecutive trading days themselves have already formed one of the longer positive capital cycles since spot Bitcoin ETFs were launched. In this context, a single-day net outflow of $263 million does not necessarily indicate a turning point, but it does break the market’s inertia regarding continued inflows. From the perspective of capital behavior, profit-taking, fluctuations in macro sentiment, and end-of-month rebalancing could all catalyze this change. It is worth noting that although the outflow size is significant, compared with the historical cumulative net inflow of more than $58.3 billion, the structural impact remains within a controllable range.

Who led the $263 million net outflow on a single day
A breakdown of the capital changes of each ETF on the day shows that the outflows were highly concentrated. Fidelity’s FBTC posted a net outflow of $150 million in a single day, accounting for more than 57% of the total outflow for that day, making it the absolute leading force. As of the time of publication, FBTC’s historical total net inflow is $10.883 billion, and this outflow accounts for about 1.38% of its historical cumulative net inflow. Grayscale’s GBTC recorded a net outflow of $46.6259 million that day, continuing the product’s long-standing pattern of capital outflows—its historical cumulative net outflow has already reached $26.262 billion. The two products moved in the same direction, but their driving logic may differ: FBTC’s outflow is more inclined toward short-term capital behavior, while GBTC’s structural outflows are related to its earlier product design and the history of its discount/premium.
Do spot Ethereum ETFs show the same trend
On April 27, spot Ethereum ETFs also recorded net outflows, totaling $50.4794 million, consistent with the capital direction of Bitcoin ETFs. However, there are important internal differences: BlackRock’s Staked ETH ETF (ETHB) actually received a net inflow of $11.7602 million that day, while Fidelity’s FETH became the main outflow source with a net outflow of $48.4315 million.
This divergence indicates that the Ethereum ETF market is not retreating in a one-way manner; capital is being reallocated among products from different issuers. ETHB’s historical cumulative net inflow has reached $44.0122 million. As a newer Staked ETH product, its capital-absorbing ability is currently forming. As of the time of this writing, the total net asset value of spot Ethereum ETFs was $13.532 billion. The net asset ratio (market value as a share of Ethereum’s total market value) was 4.89%, and the historical cumulative net inflow was $12.048 billion.
How did the price perform during the nine-day net inflow period
The relationship between the continuity of capital inflows and price movements is not a simple linear one. Looking back to before the net inflow sequence started on April 14, Bitcoin had already hit a low of around $66,900 early in the month and first rebounded to around $74,200. This suggests that the ETF’s consecutive net inflows were built on capital confirmation of an already-rebounding trend, rather than being the only driver of the price’s initial rise.
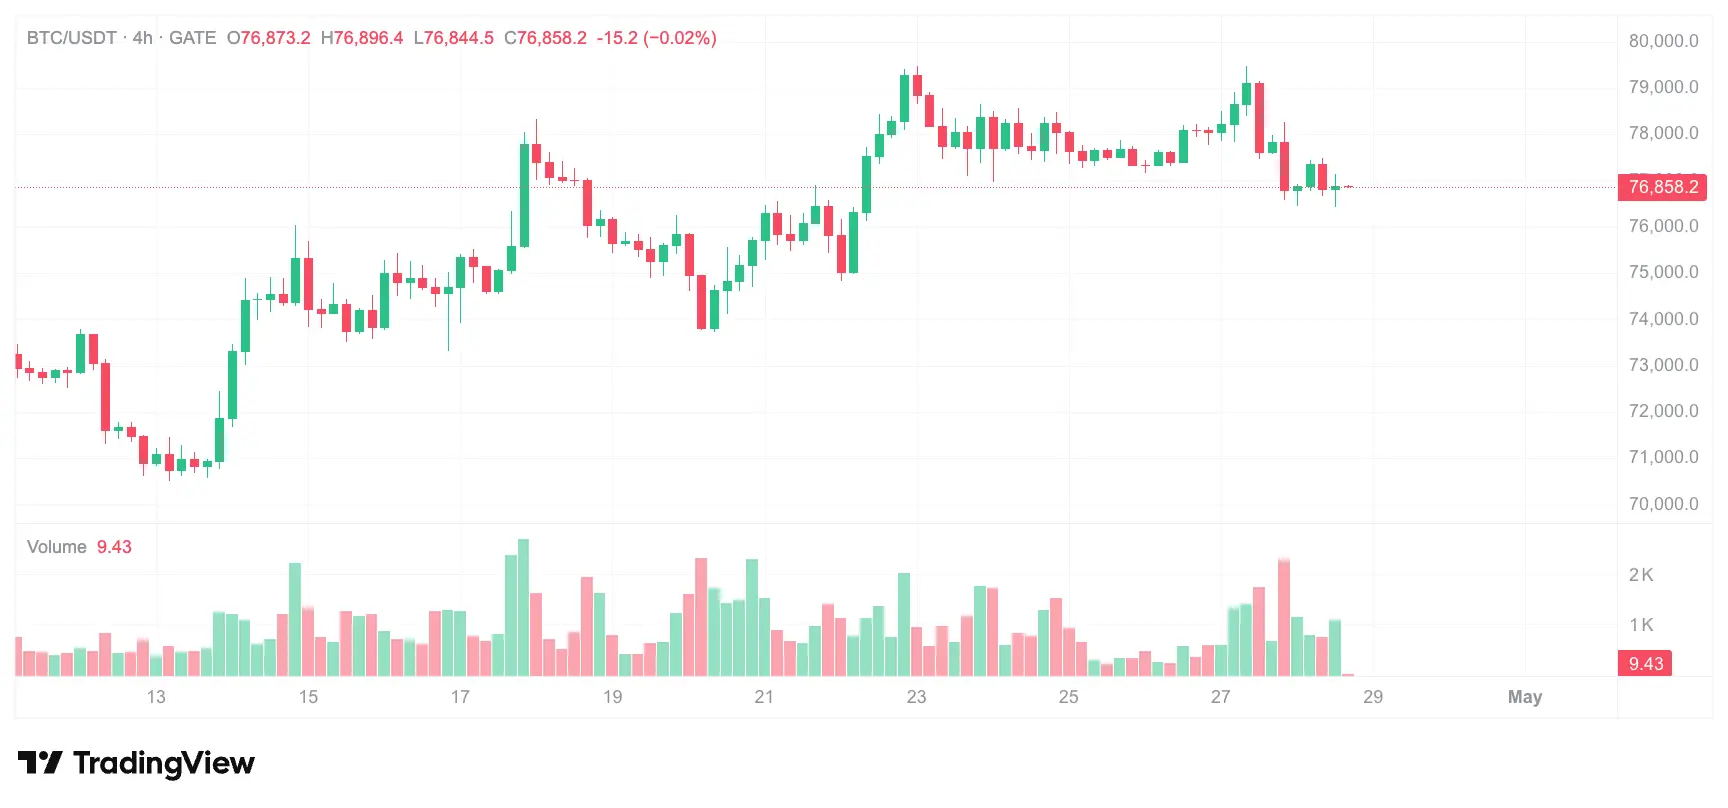 BTC 4h chart of ETF capital continuously flowing in
Over the subsequent nine trading days, the price action can be divided into four phases:
A mild launch period (April 14 to 15). On the first day of net inflows, Bitcoin opened at about $74,478 and closed around $74,182. The price was nearly flat and did not immediately surge due to the inflow. The next day, the close inched up to about $74,800, with a cumulative gain of roughly 0.8%. Capital entered in a measured manner, digesting prior profit-taking.
A rapid rally and a spike at the highs (April 16 to 18). April 17 was the peak day for net inflows within the nine days, with the amount reaching $664 million. On that day, Bitcoin’s intraday trading range was between $75,035 and $78,895, showing a clear pattern of spiking higher and then pulling back sharply. On April 18, it continued rising; it closed at about $77,128, with a daily gain of roughly 2.7%. A phase high appeared around $77,000.
Pullback adjustment and capital divergence (April 19 to 20). On April 19, Bitcoin fell from above $77,000 to about $75,700. On April 20, it probed further down to about $73,856. Over these two days, the cumulative pullback was about 4.3%. However, it is worth noting that ETF net inflows did not stop during this period—net inflows were about $75 million on April 19 and about $238 million on April 20. The short-term divergence between capital and price indicates that institutions’ continued buying was more about accumulating positions than chasing immediate price trends, with clear dip-buying behavior.
Range-bound recovery and consolidation at elevated levels (April 21 to 24). On April 21, the price rebounded to about $75,875. On April 22, it rose to about $77,560. On April 23, it briefly surged to $79,388 before quickly falling back to $77,848, again showing an intraday pattern of spiking and then dropping. On April 24 (the last day of the nine-day net inflow period), it closed at about $77,720.
Across the entire range, Bitcoin started from about $74,200 and closed at about $77,720. The cumulative increase was about $3,500, and the interval gain was about 4.7%. If calculated from the month-start low, the cumulative gain was about 16%. The nine-day cumulative net inflow was about $2.12 billion, and for every $100 million of net inflow, the price elasticity coefficient was about 1.6%. This pattern shows that sustained net capital inflows provided solid bottom support for prices, but the magnitude of the rise was constrained by multiple factors, including the relatively low funding rates in the derivatives market and disruptions from geopolitical events. There was no overly leveraged “chasing” rally.
What signal does the Bitcoin ETF net asset ratio reflect
As of April 27, the total net asset value of Bitcoin spot ETFs was $101.234 billion, and the net asset ratio (ETF market value as a share of Bitcoin’s total market value) was 6.57%. This ratio remained broadly stable over the past month. Even after a single-day outflow of $263 million, there was no significant drop. A 6.57% ratio means that Bitcoin held through the ETF channel is about one-fifteenth of the total circulating supply across the market, indicating that the proportion has reached a certain level of maturity. Historically, when this ratio fluctuates within the 5% to 7% range, daily net fund inflows and outflows of hundreds of millions of dollars do not cause sharp changes in the ratio, suggesting that the ETF market’s depth and ability to absorb flows are strengthening.
How do cumulative net inflows and this outflow offset each other
A more noteworthy perspective is the cumulative data. Bitcoin spot ETFs have posted historical cumulative net inflows of $58.301 billion. A single-day outflow of $263 million accounts for only 0.45% of the cumulative total. Measured from a volatility perspective, this proportion is near the median in the distribution of day-to-day fluctuations over the past three months. In other words, while a $263 million net outflow has news value in absolute terms, it is not unusual in relative scale. The reason the end of the nine-day inflow period has drawn attention is more due to the psychological impact of the trend breaking rather than the capital size itself causing a substantive change in market supply and demand. Combined with price performance, during the nine-day inflow period the cumulative price increase was less than 5%, and no overheated bubble formed. Therefore, this outflow is more likely to be short-term profit-taking or rebalancing activity rather than a comprehensive negation of the prior rally.
Is this outflow a trend reversal or a short-term adjustment
Determining the nature of capital flows requires looking at a longer time window. Single-day outflows after consecutive inflows have occurred multiple times historically. For example, in Q4 2025, Bitcoin ETFs experienced 12 consecutive days of inflows followed by a $310 million outflow; afterward, net inflows resumed again within the following five trading days. The key variable is not the single-day figure, but whether a net outflow sequence of at least three consecutive trading days forms. If, in the next 48 to 72 hours, there is a second day of net outflow with an expanded scale, the probability of a trend reversal increases; conversely, if inflows quickly return at a modest level, the event is more consistent with a short-term adjustment. In addition, the two instances of divergence between capital and price during the nine-day inflow period (April 17’s spike and pullback, and the April 19 to 20 period when the price declined while capital still flowed in) also indicate that institutional capital is less sensitive to price than retail sentiment. Their behavior is more inclined toward long-term position building, which reduces the risk that a one-day outflow turns into a sustained stampede selling.
What follow-up verification signals should traders watch
In light of this reversal in capital flows and the price performance, verification signals worth tracking include:
- First, whether there are consecutive net outflows within the next 3 to 5 trading days, and whether the daily outflow magnitude is converging or expanding.
- Second, whether the differentiated pattern inside the Ethereum ETF market continues, and whether ETHB’s inflows can offset the outflows from other products.
- Third, whether the Bitcoin ETF net asset ratio falls below the 6.5% threshold—this level has served as a psychological support over the past two months.
- Fourth, whether GBTC’s outflows accelerate. Its historical cumulative outflow scale is already large, so the remaining space for further outflow of existing capital is limited; however, if outflows accelerate, it will need to be reassessed.
- Fifth, whether the price can gain effective support above $75,000—this level corresponds to the low-area region of pullback adjustments during the nine-day inflow period. If it breaks, it would mean the support accumulated by inflow has been breached, requiring a re-examination of the market structure.
FAQ
Q: The spot Bitcoin ETFs’ continuous 9-day net inflow has been terminated. Does this mean institutions are starting to withdraw?
A: The $263 million outflow on a single day is 0.45% of the cumulative net inflow, and the scale is not abnormal. During the nine-day inflow period, institutions continued buying even when prices were falling, indicating their behavior is more long-term oriented. Usually, it takes the same-direction movement over multiple consecutive days to confirm a trend.
Q: Historically, what level is a $263 million net outflow?
A: It is a moderately high level. Since the spot Bitcoin ETFs were launched, there have been more than a dozen instances where daily net outflows exceeded $200 million. Most occurred during adjustment phases after consecutive inflows, so it is not a rare event.
Q: How much did the Bitcoin price rise during the nine-day net inflow period?
A: From the closing price on the first day the net inflow started (April 14) of about $74,200 to the closing price on April 24 of about $77,720, the gain in the range was about 4.7%. If calculated from the month-start low, the cumulative gain was about 16%.
Q: Why is capital still flowing in when prices fall?
A: From April 19 to 20, the price pulled back by about 4.3%, but the ETF still recorded net inflows. This usually reflects institutional investors viewing the decline as an opportunity to build positions rather than panic selling. The short-term divergence between capital and price precisely shows that institutional buying logic is independent of short-term sentiment.
Q: Should the change in the net asset ratio of 6.57% be a focus?
A: Typically, the daily movement of this ratio does not exceed 0.1 percentage point. If it continues to decline and falls below 6.3%, it would indicate that the ETF channel’s share of Bitcoin holdings has contracted meaningfully, which is worth paying attention to.
