#GateSquareMayTradingShare
#eth
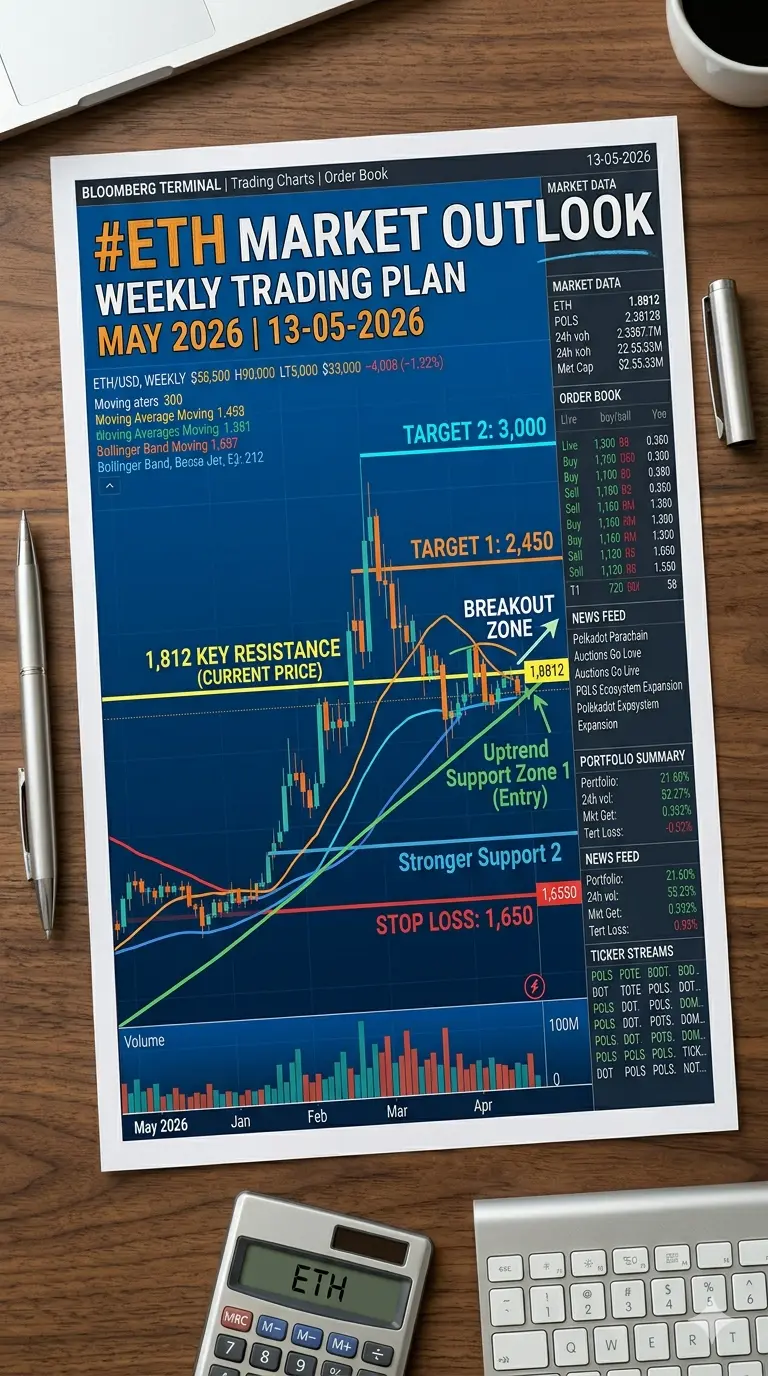
$ETH ETH Review | May 14, 2026
This post is for info only, not money advice.
1. Current Market Data
Price and Move
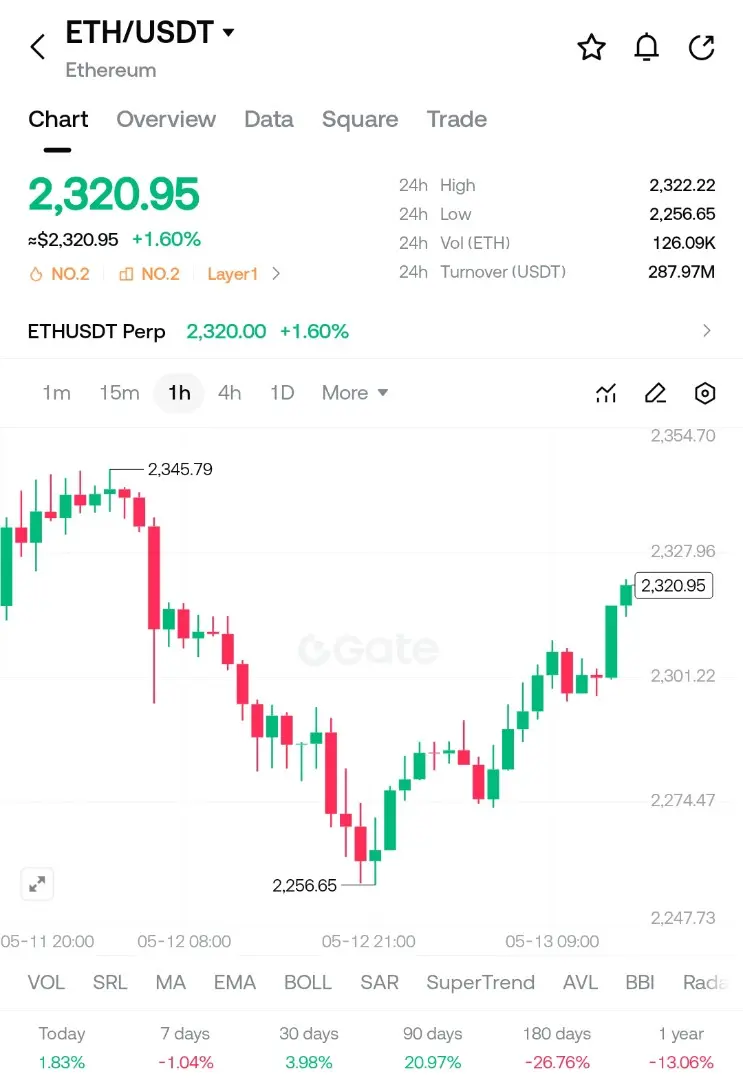
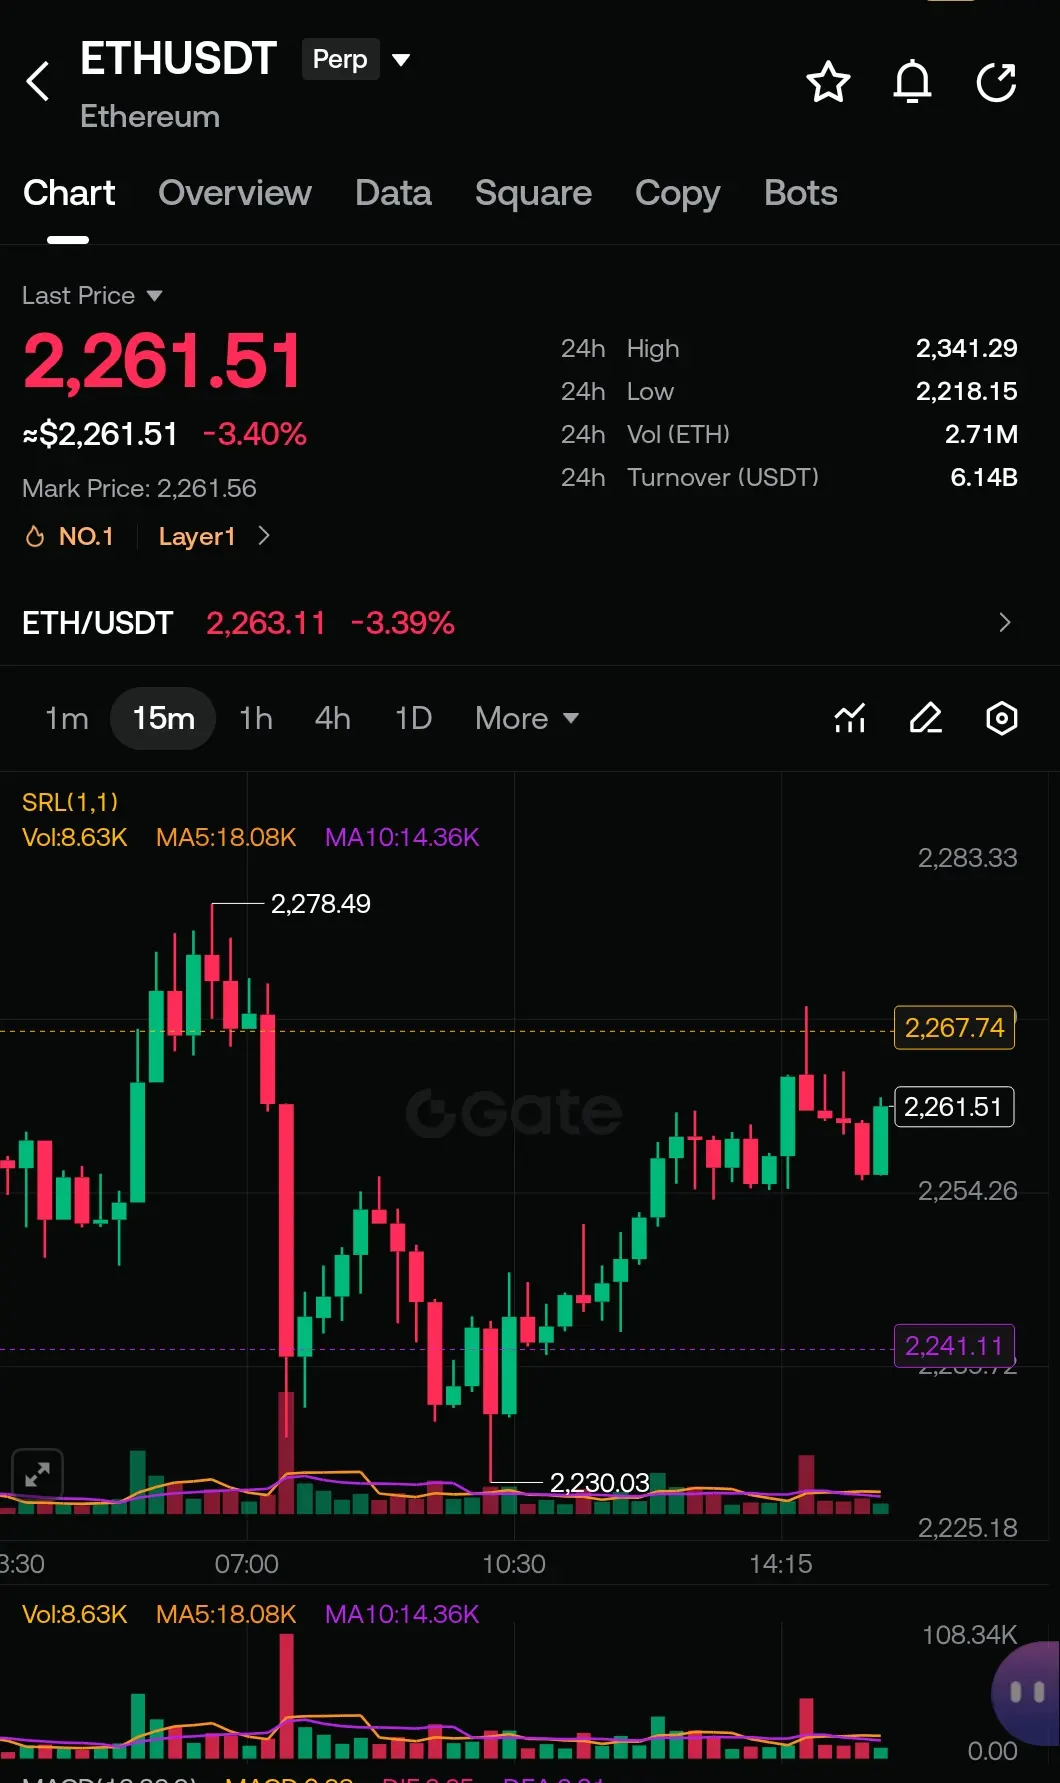
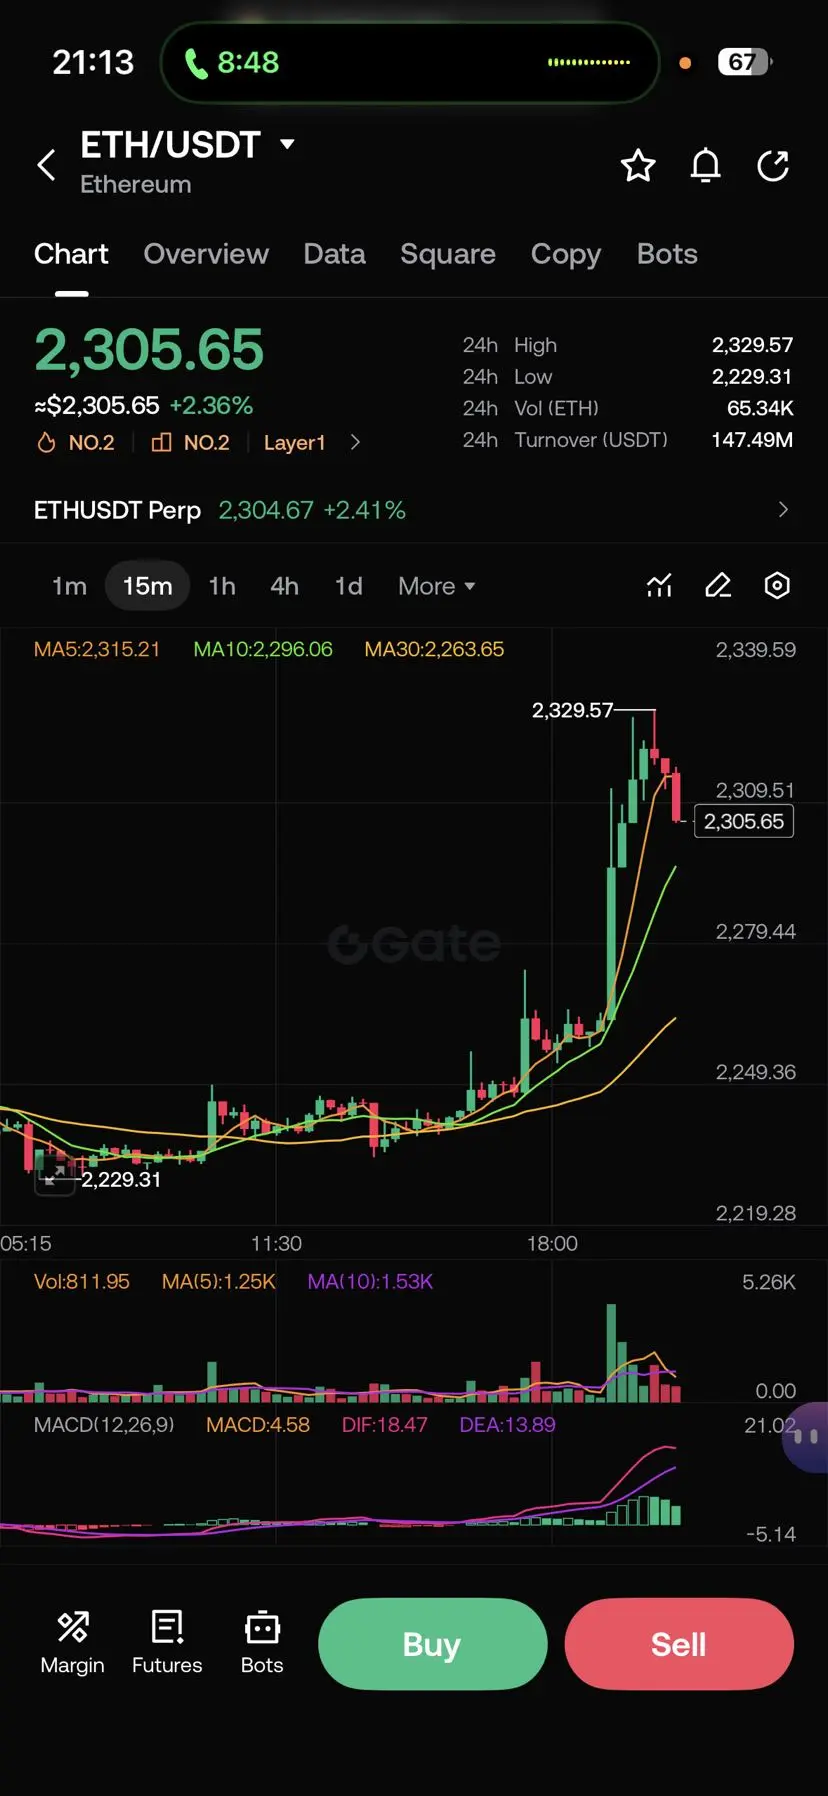
• Last 24h range: $2,234.64 – $2,287.78 • Day move: down 1.09% • Close: Held above $2,260, 15min MA20 base worked • 24h size: rose while price fell. Panic sell part is seen • 7-day move: down 3.2%, weak vs BTC
Relative Spot
• BTC pair: 0.0283, in last 30-day low zone • Share: 17.8%, lost 0.6% in last month • ATH: If $4,878 is past peak, price now is 53.6% under
2. Chart Study
Trend Build
• 15min – 1H: Bear order stays. Peaks fall, lows flat • 4H: Low gap formed on MACD. Price made new low while MACD did not • Daily: MACD low gap + CCI and WR in oversold. Odds of short-run bounce rise • Weekly: Closes above $2,200 keep main build. EMA 200 $2,150 is main base
Key Levels
Bases
1. $2,234: 24h low, flow area. First bounce zone 2. $2,200: Weekly flat base and mind level. Firm level 3. $2,150: Daily EMA 200, main trend base
Caps
1. $2,260: 15min MA20, level just won back 2. $2,288: 24h high, a pass opens path to $2,320 3. $2,320: Cross of 4H down trend line and Fib 0.382. Firm level
Tool State
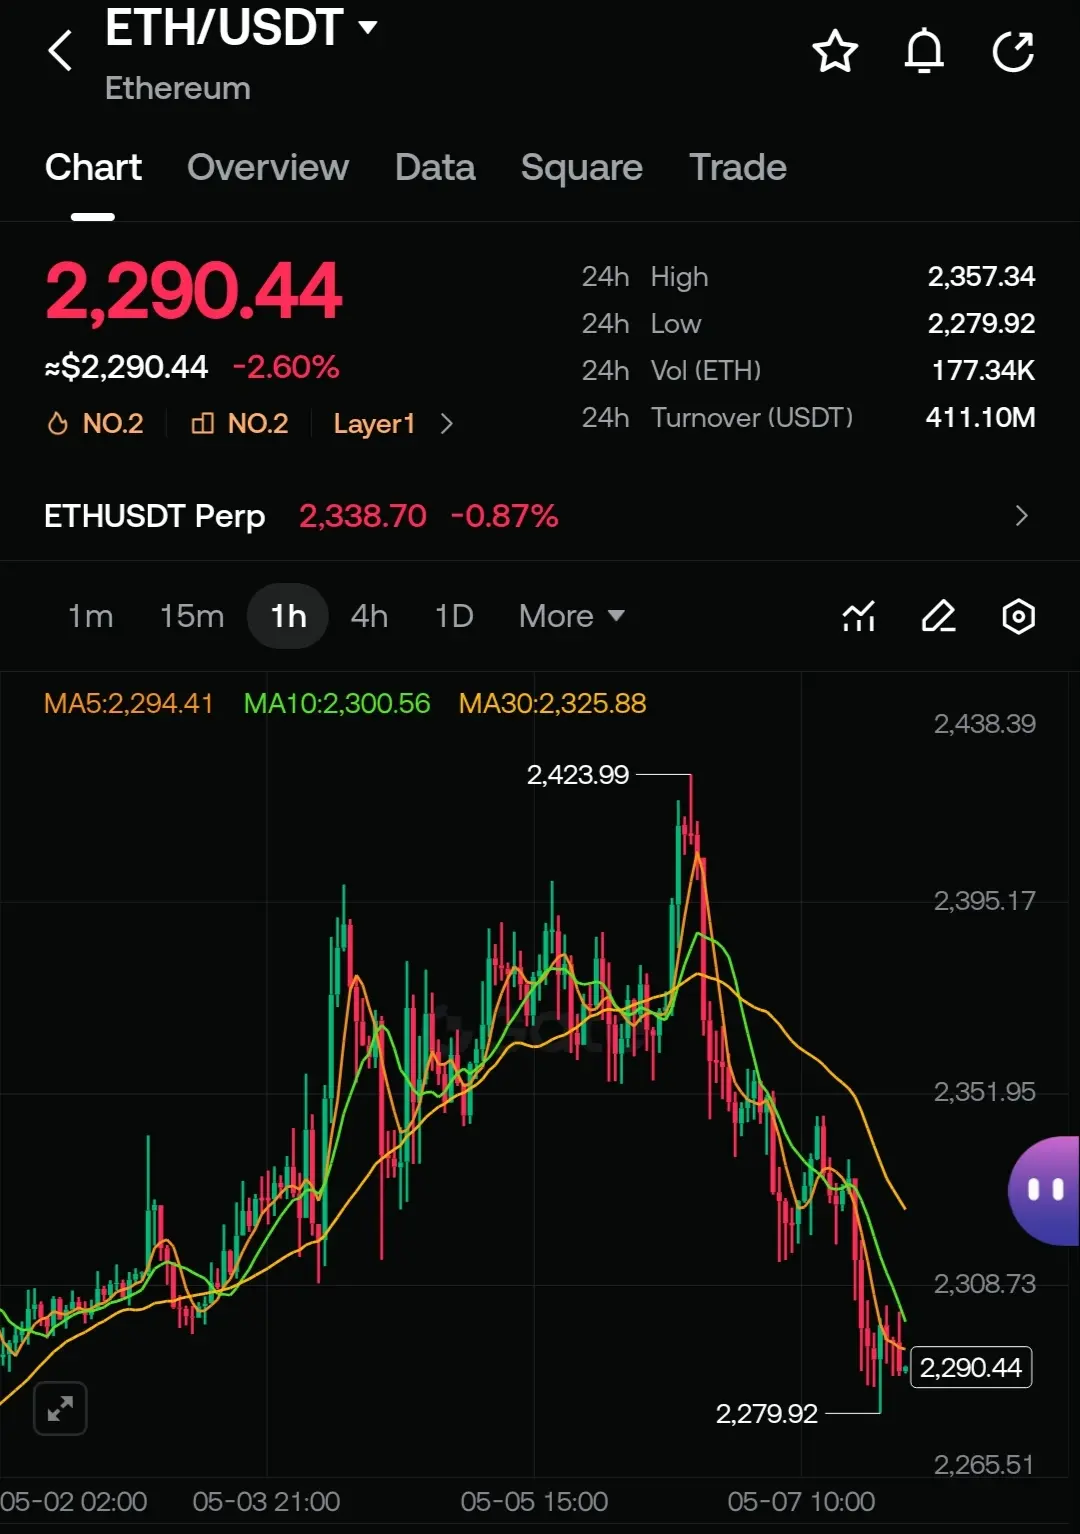
• RSI 14: 4H 34, Daily 41. Near oversold. Under 30 counts as low zone • CCI: -175, under -100. Oversold proof • WR: -91 in low zone. Bounce odds rise • MACD: Low gap on 4H and Daily. Bars show signs of turn from low • Moving Lines: Price above 15min MA20 $2,260. 4H EMA 50 $2,305 is cap. Daily MA50 $2,380 is far • Bollinger Bands: 4H low band $2,232 tested. Mid band $2,275 is first goal
Form and Fib
For the $2,287.78 – $2,234.64 drop, Fib 0.382 pullback is $2,255.00, 0.5 level is $2,261.21, 0.618 level is $2,267.42. Hold above $2,260 aims for $2,275 – $2,288 zone. Hourly closes under $2,234 set aims at $2,200 and $2,150. 4H chart shows a falling wedge form; a break above $2,288 gives a $2,360 aim
3. On-Chain and Core Study
On-Chain View
• Trade count rose 18% in 24h: Net use rose due to sells • Big wallet move: 2 transfers above 10,000 ETH were to sell • Live address count is 6% above 7-day mean. Use is here but gain take rules • Net inflow to hubs: +28,400 ETH in last 24h. Short-run sell stress sign • Stake rate: 27.6%, flat. Locked supply did not shift
Core Points
• Burn Path: 1,820 ETH burned in last 24h. Net supply gain +2,100 ETH • L2 Use: Total locked value 38.2B, up 2.1% in 7 days. Layer-2 use is firm • Build: Next net patch set for Q3. Test net progress 82% • Large Firm: ETF outflow last 2 days -3,100 ETH. Short-run stress point
4. Holder and Market Mood Study
• Broad Market: Fear & Greed Index at 58, “Mid” zone. Risk will is fair • ETH Focus: After 1.09% drop, crowd is with care. Oversold signs are talked about • Trade Market: Open trade fell 2.8% in 24h. Fund rate +0.004%, mild • BTC Pair: 0.0283, 6-month low. Weak run vs BTC stays
5. Risk and Case Study
Up Case
Oversold + low gap mix may bring a bounce. Stay above $2,260 and a 4H close above $2,275 sets $2,288 as first goal. If size tops 12B, $2,320 and $2,360 wedge aim may be tried. Short-run room of 2-5% may form. If BTC stays above 80,000, it helps
Down Case
High-size drop + inflow to hubs adds stress. A 15min close under $2,260 brings a $2,234 test. If $2,234 fails, $2,200 and $2,150 main base are next. For stop-loss, hourly closes under $2,245 can be used. Risk is 3-6% more down
Main Risk Points
1. 15min and 4H bear order: Short-run path is down 2. Net inflow to hubs: 28,400 ETH may add more sell 3. BTC pair weak: Even if BTC is flat, ETH may lag 4. Macro: US rate call may bring swings
Time-Based View
• Short Run: Watch tight zone $2,234 – $2,288. Above $2,260 brings bounce, under it brings sell • Mid Run: View stays weak without a daily close above $2,320. $2,150 is main base • Long Run: L2 growth and stake build are good. As long as $2,150 EMA 200 holds, no break
Wrap
ETH fell 1.09% in 24h and ran in the $2,234 – $2,287 band. 15min and 4H charts show bear order, yet 4H and Daily MACD low gap + CCI/WR oversold give short-run bounce odds. A close above $2,260 MA20 is good. Though high-size drop shows panic sell, if $2,234 holds, a $2,275 – $2,288 bounce may come. If it breaks, $2,200 and $2,150 risks are live.
#Gate广场五月交易分享
#eth
$ETH ETH Review | May 14, 2026
This post is for info only, not money advice.
1. Current Market Data
Price and Move
• Last 24h range: $2,234.64 – $2,287.78 • Day move: down 1.09% • Close: Held above $2,260, 15min MA20 base worked • 24h size: rose while price fell. Panic sell part is seen • 7-day move: down 3.2%, weak vs BTC
Relative Spot
• BTC pair: 0.0283, in last 30-day low zone • Share: 17.8%, lost 0.6% in last month • ATH: If $4,878 is past peak, price now is 53.6% under
2. Chart Study
Trend Build
• 15min – 1H: Bear order stays. Peaks fall, lows flat • 4H: Low gap formed on MACD. Price made new low while MACD did not • Daily: MACD low gap + CCI and WR in oversold. Odds of short-run bounce rise • Weekly: Closes above $2,200 keep main build. EMA 200 $2,150 is main base
Key Levels
Bases
1. $2,234: 24h low, flow area. First bounce zone 2. $2,200: Weekly flat base and mind level. Firm level 3. $2,150: Daily EMA 200, main trend base
Caps
1. $2,260: 15min MA20, level just won back 2. $2,288: 24h high, a pass opens path to $2,320 3. $2,320: Cross of 4H down trend line and Fib 0.382. Firm level
Tool State
• RSI 14: 4H 34, Daily 41. Near oversold. Under 30 counts as low zone • CCI: -175, under -100. Oversold proof • WR: -91 in low zone. Bounce odds rise • MACD: Low gap on 4H and Daily. Bars show signs of turn from low • Moving Lines: Price above 15min MA20 $2,260. 4H EMA 50 $2,305 is cap. Daily MA50 $2,380 is far • Bollinger Bands: 4H low band $2,232 tested. Mid band $2,275 is first goal
Form and Fib
For the $2,287.78 – $2,234.64 drop, Fib 0.382 pullback is $2,255.00, 0.5 level is $2,261.21, 0.618 level is $2,267.42. Hold above $2,260 aims for $2,275 – $2,288 zone. Hourly closes under $2,234 set aims at $2,200 and $2,150. 4H chart shows a falling wedge form; a break above $2,288 gives a $2,360 aim
3. On-Chain and Core Study
On-Chain View
• Trade count rose 18% in 24h: Net use rose due to sells • Big wallet move: 2 transfers above 10,000 ETH were to sell • Live address count is 6% above 7-day mean. Use is here but gain take rules • Net inflow to hubs: +28,400 ETH in last 24h. Short-run sell stress sign • Stake rate: 27.6%, flat. Locked supply did not shift
Core Points
• Burn Path: 1,820 ETH burned in last 24h. Net supply gain +2,100 ETH • L2 Use: Total locked value 38.2B, up 2.1% in 7 days. Layer-2 use is firm • Build: Next net patch set for Q3. Test net progress 82% • Large Firm: ETF outflow last 2 days -3,100 ETH. Short-run stress point
4. Holder and Market Mood Study
• Broad Market: Fear & Greed Index at 58, “Mid” zone. Risk will is fair • ETH Focus: After 1.09% drop, crowd is with care. Oversold signs are talked about • Trade Market: Open trade fell 2.8% in 24h. Fund rate +0.004%, mild • BTC Pair: 0.0283, 6-month low. Weak run vs BTC stays
5. Risk and Case Study
Up Case
Oversold + low gap mix may bring a bounce. Stay above $2,260 and a 4H close above $2,275 sets $2,288 as first goal. If size tops 12B, $2,320 and $2,360 wedge aim may be tried. Short-run room of 2-5% may form. If BTC stays above 80,000, it helps
Down Case
High-size drop + inflow to hubs adds stress. A 15min close under $2,260 brings a $2,234 test. If $2,234 fails, $2,200 and $2,150 main base are next. For stop-loss, hourly closes under $2,245 can be used. Risk is 3-6% more down
Main Risk Points
1. 15min and 4H bear order: Short-run path is down 2. Net inflow to hubs: 28,400 ETH may add more sell 3. BTC pair weak: Even if BTC is flat, ETH may lag 4. Macro: US rate call may bring swings
Time-Based View
• Short Run: Watch tight zone $2,234 – $2,288. Above $2,260 brings bounce, under it brings sell • Mid Run: View stays weak without a daily close above $2,320. $2,150 is main base • Long Run: L2 growth and stake build are good. As long as $2,150 EMA 200 holds, no break
Wrap
ETH fell 1.09% in 24h and ran in the $2,234 – $2,287 band. 15min and 4H charts show bear order, yet 4H and Daily MACD low gap + CCI/WR oversold give short-run bounce odds. A close above $2,260 MA20 is good. Though high-size drop shows panic sell, if $2,234 holds, a $2,275 – $2,288 bounce may come. If it breaks, $2,200 and $2,150 risks are live.
#Gate广场五月交易分享