#TradfiTradingChallenge
$BSB/USDT – 1D Chart Analysis
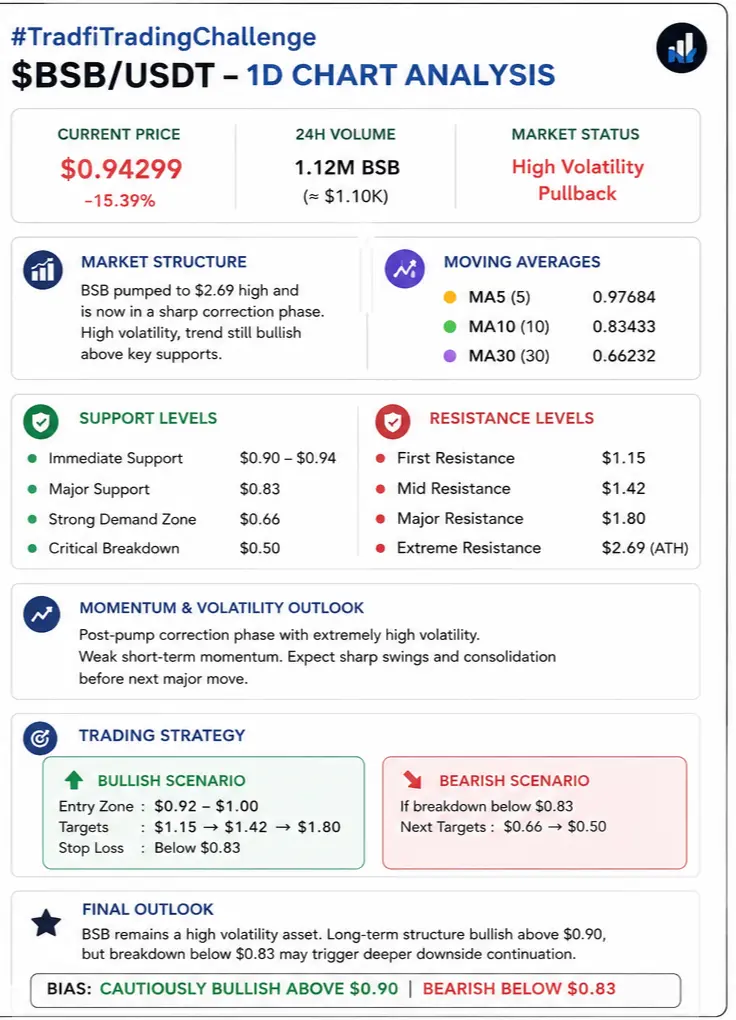
BSB has entered a highly volatile expansion phase after printing a massive impulsive rally toward the $2.69 region before experiencing a sharp correction back below the psychological $1.00 level. The chart structure currently reflects aggressive profit-taking pressure following an unsustainable vertical move, while overall trend momentum still remains technically bullish on the higher timeframe despite the recent sell-off.
Current Market Structure
• Current Price: ~$0.94299
• Daily Change: -15.39%
• Trend Status: High Volatility Pullback After Parabolic Rally
The recent rejection from the $2.69 peak triggered strong bearish momentum, leading to consecutive red candles and heavy downside pressure. However, price is still trading above the long-term moving average cluster, which suggests that the broader structure has not fully broken yet.
Key Support Levels
• Immediate Support: $0.90 – $0.94
• Major Support: $0.83
• Strong Demand Zone: $0.66
• Critical Breakdown Level: $0.50
If price holds above the $0.90 region, buyers may attempt another recovery bounce. A breakdown below $0.83 could trigger deeper downside continuation toward the MA30 support area near $0.66.
Key Resistance Levels
• First Resistance: $1.15
• Mid Resistance: $1.42
• Major Resistance: $1.80
• Extreme Resistance: $2.69 ATH Spike
The market must reclaim the $1.15–$1.42 region to restore bullish confidence. Until then, upside momentum remains weak due to heavy distribution after the spike.
Moving Average Analysis
• MA5: 0.97684
• MA10: 0.83433
• MA30: 0.66232
Price remains above MA10 and MA30, keeping the macro trend bullish. However, trading below MA5 signals short-term weakness and continuation risk if selling volume increases.
Momentum & Volatility Outlook
The chart currently reflects a classic post-pump correction phase: • Extremely high volatility
• Rapid liquidation movement
• Weak short-term buyer control
• Elevated reversal risk
After such explosive rallies, consolidation periods are common before the next directional move forms.
Trading Strategy
Bullish Scenario
If BSB stabilizes above $0.90 and volume returns: • Entry Zone: $0.92 – $1.00
• Targets: $1.15 → $1.42 → $1.80
• Stop Loss: Below $0.83
Bearish Scenario
If support fails: • Breakdown below $0.83 may accelerate selling
• Next downside targets: $0.66 → $0.50
Final Outlook
BSB remains one of the highest volatility setups currently visible on the daily timeframe. The long-term structure is still technically bullish, but the recent parabolic rally created overheated market conditions that resulted in aggressive profit-taking. Traders should expect continued sharp price swings, fake breakouts, and liquidation volatility until the market establishes a stable consolidation range.
Bias: Cautiously Bullish Above $0.90 | Bearish Below $0.83
$BSB/USDT – 1D Chart Analysis
BSB has entered a highly volatile expansion phase after printing a massive impulsive rally toward the $2.69 region before experiencing a sharp correction back below the psychological $1.00 level. The chart structure currently reflects aggressive profit-taking pressure following an unsustainable vertical move, while overall trend momentum still remains technically bullish on the higher timeframe despite the recent sell-off.
Current Market Structure
• Current Price: ~$0.94299
• Daily Change: -15.39%
• Trend Status: High Volatility Pullback After Parabolic Rally
The recent rejection from the $2.69 peak triggered strong bearish momentum, leading to consecutive red candles and heavy downside pressure. However, price is still trading above the long-term moving average cluster, which suggests that the broader structure has not fully broken yet.
Key Support Levels
• Immediate Support: $0.90 – $0.94
• Major Support: $0.83
• Strong Demand Zone: $0.66
• Critical Breakdown Level: $0.50
If price holds above the $0.90 region, buyers may attempt another recovery bounce. A breakdown below $0.83 could trigger deeper downside continuation toward the MA30 support area near $0.66.
Key Resistance Levels
• First Resistance: $1.15
• Mid Resistance: $1.42
• Major Resistance: $1.80
• Extreme Resistance: $2.69 ATH Spike
The market must reclaim the $1.15–$1.42 region to restore bullish confidence. Until then, upside momentum remains weak due to heavy distribution after the spike.
Moving Average Analysis
• MA5: 0.97684
• MA10: 0.83433
• MA30: 0.66232
Price remains above MA10 and MA30, keeping the macro trend bullish. However, trading below MA5 signals short-term weakness and continuation risk if selling volume increases.
Momentum & Volatility Outlook
The chart currently reflects a classic post-pump correction phase: • Extremely high volatility
• Rapid liquidation movement
• Weak short-term buyer control
• Elevated reversal risk
After such explosive rallies, consolidation periods are common before the next directional move forms.
Trading Strategy
Bullish Scenario
If BSB stabilizes above $0.90 and volume returns: • Entry Zone: $0.92 – $1.00
• Targets: $1.15 → $1.42 → $1.80
• Stop Loss: Below $0.83
Bearish Scenario
If support fails: • Breakdown below $0.83 may accelerate selling
• Next downside targets: $0.66 → $0.50
Final Outlook
BSB remains one of the highest volatility setups currently visible on the daily timeframe. The long-term structure is still technically bullish, but the recent parabolic rally created overheated market conditions that resulted in aggressive profit-taking. Traders should expect continued sharp price swings, fake breakouts, and liquidation volatility until the market establishes a stable consolidation range.
Bias: Cautiously Bullish Above $0.90 | Bearish Below $0.83