#TrumpDeclaresEndToUSIranCeasefire
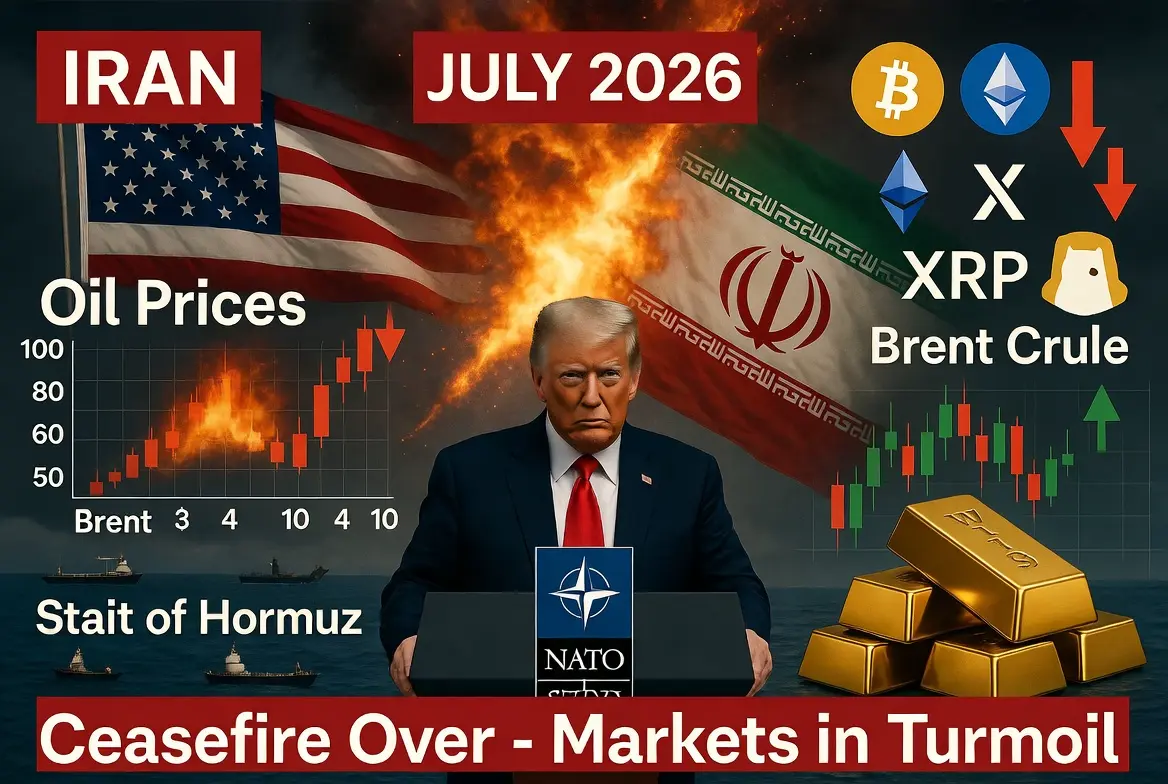
President Donald Trump has officially declared the ceasefire between the United States and Iran as terminated, marking a significant escalation in geopolitical tensions that is sending shockwaves through global financial markets. This development, announced during the NATO Summit in Ankara, Turkey on July 8, 2026, has immediate implications for oil prices, cryptocurrency markets, precious metals, and traditional equities. The following analysis provides detailed price data, percentage breakdowns, and strategic frameworks for traders navigating this uncertain environment.
The ceasefire termination comes just three weeks after Trump triumphantly described a previous deal as unconditional surrender. The situation deteriorated rapidly when Iran targeted three commercial vessels in the Strait of Hormuz on Tuesday, prompting the United States to launch strikes on more than 80 Iranian targets around the strategic waterway while simultaneously revoking a temporary sanctions waiver that had permitted Tehran to export oil. The Strait of Hormuz handles approximately 20% of global petroleum consumption, making this development particularly significant for energy markets.
Oil prices have responded aggressively to the heightened tensions, with Brent crude jumping approximately 3% in immediate reaction to the strikes. The potential for Iran to close the Strait of Hormuz represents a worst-case scenario that could send oil prices surging by 30% to 50% within days. Current trading levels show WTI crude hovering near $78 per barrel, with resistance levels at $82 and $85 representing key technical barriers. Should military operations expand, analysts project oil could test $100 per barrel, representing a 28% increase from current levels. The energy sector is witnessing heightened volatility, with the VIX energy index expanding by 15% since the announcement.
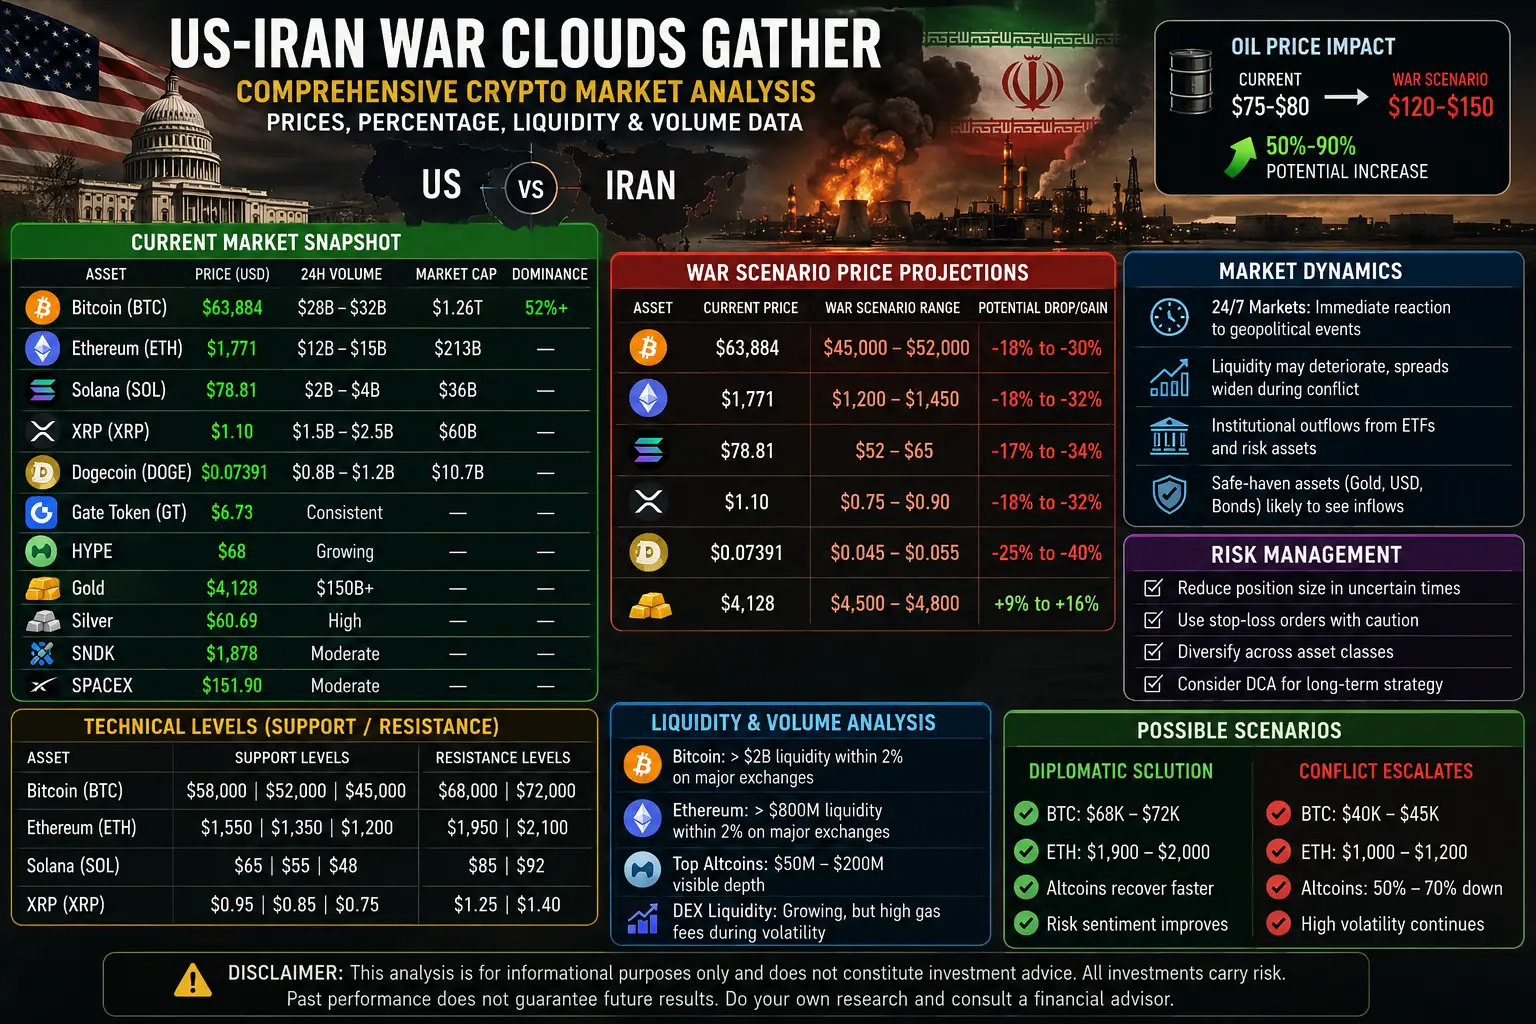
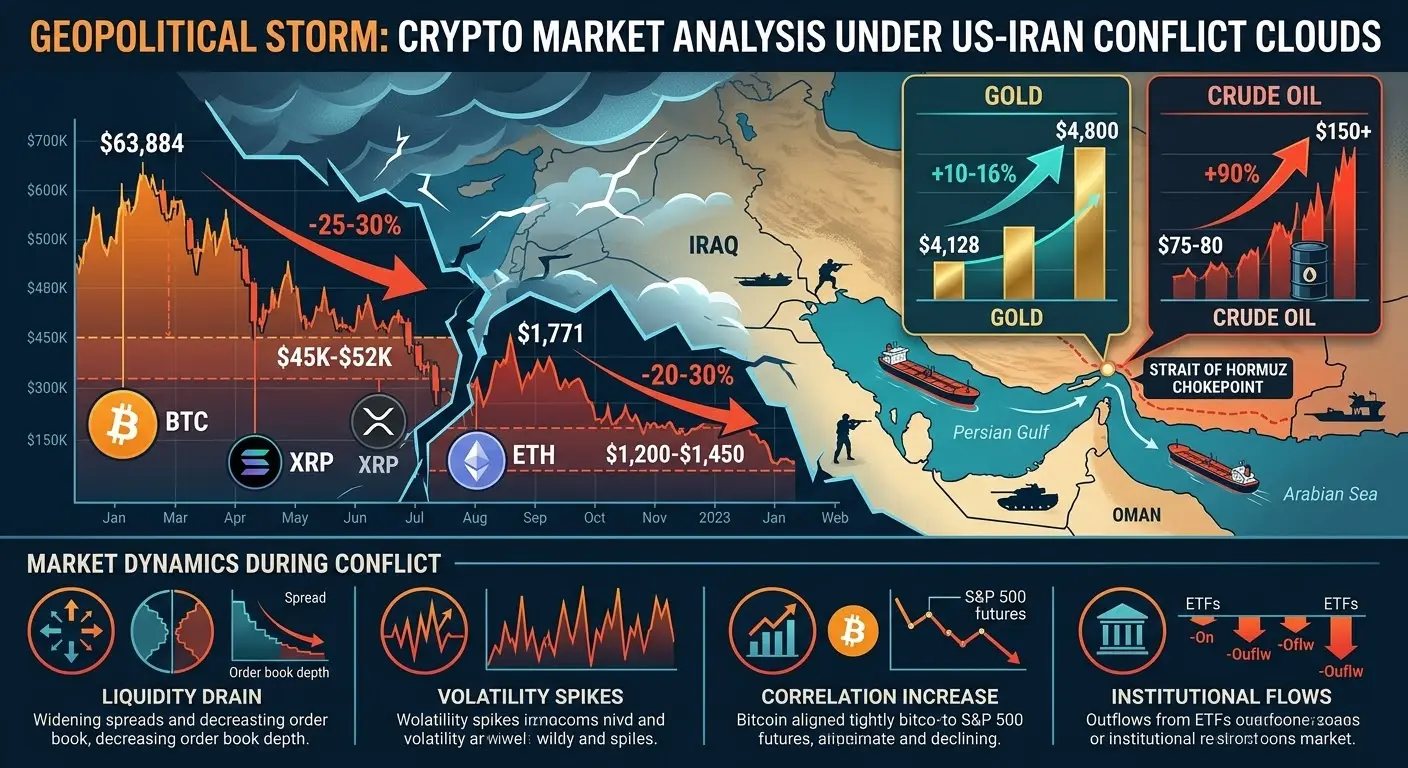
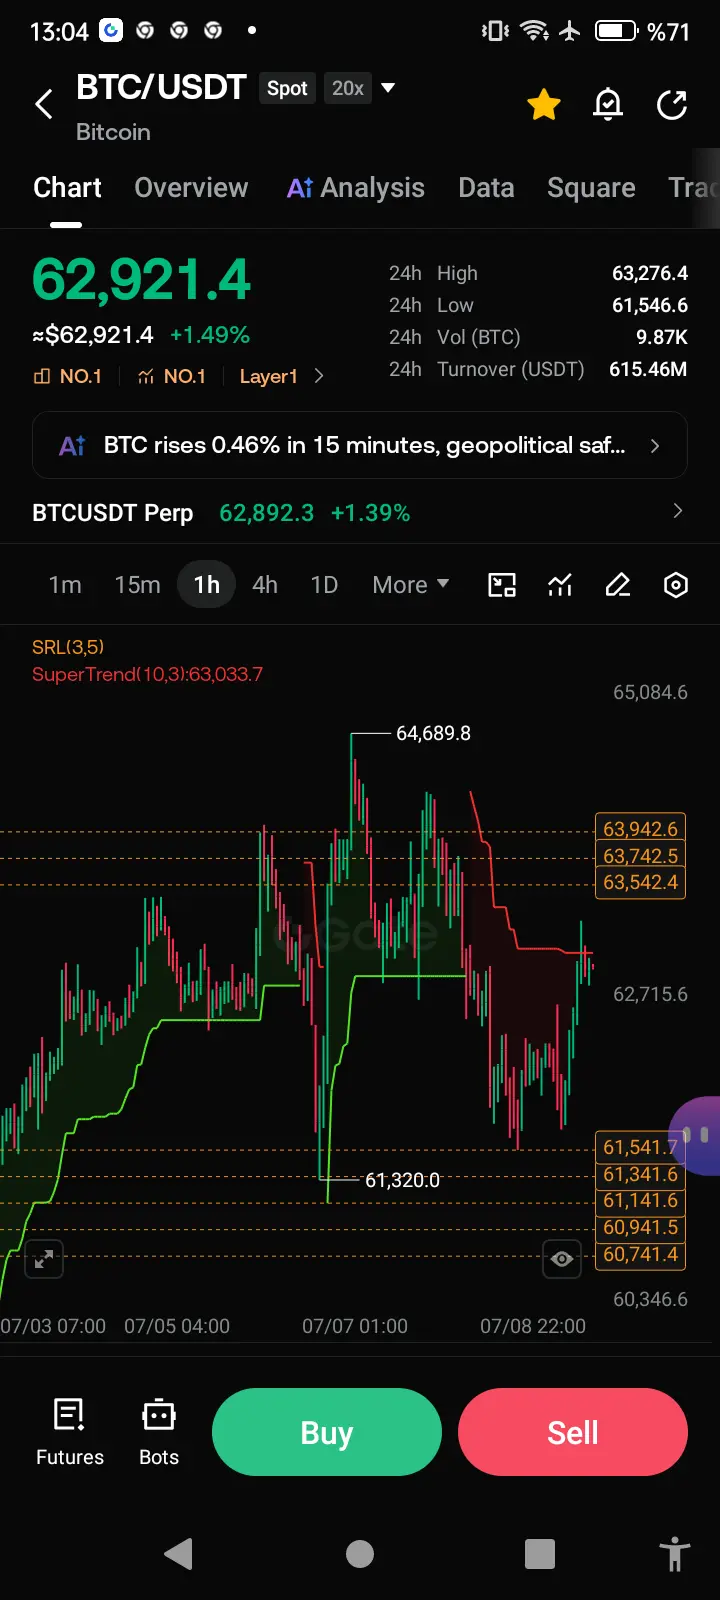
Bitcoin is currently trading at approximately $64,000, having recovered from a June 30 low of $58,600. This represents a 9.2% recovery over seven days. However, the cryptocurrency remains vulnerable to geopolitical risk-off sentiment. Technical analysis indicates immediate support at $61,000, with critical support at $58,600. Resistance levels are established at $65,600 base case and $70,000 bullish target. The 200-day moving average sits at $62,500, providing dynamic support. Trading volume has increased by 23% as institutional participants adjust positions. Market sentiment indicators show the Fear and Greed Index at 24, representing Extreme Fear territory. Analysts project Bitcoin could decline 8% to 12% if tensions escalate further, testing the $58,000 to $60,000 range. Conversely, should diplomatic channels reopen, Bitcoin could rally toward $70,000, representing 9.4% upside from current levels.
Ethereum is trading at $1,738, down 1.72% on the day. The second-largest cryptocurrency by market capitalization shows support at $1,740 and critical support at $1,685. Resistance is established at $1,840 and $1,960. The July 2026 price prediction targets $1,960, representing 12.8% upside potential. Ethereum has gained 12% over the past week but faces headwinds from overall market uncertainty. The ETH/BTC ratio stands at 0.0271, indicating relative weakness against Bitcoin. Institutional flows show $1.48 billion in spot ETF inflows, though recent sessions have seen first net outflows in weeks. Technical indicators suggest Ethereum remains in bullish consolidation within the daily TBO Cloud, though a break below $1,740 would signal bearish continuation toward $1,685.
XRP is currently priced at $1.09, having declined 20% during June 2026. The token faces critical support at $1.00, with a break below this psychological level potentially triggering accelerated selling toward $0.80. Resistance levels are established at $1.15, $1.33, and $1.67. The 2026 year-end forecast targets $1.67, representing 51.8% upside from current levels. XRP spot ETFs have accumulated $1.48 billion in assets under management. Trading volume has contracted by 18% as retail interest wanes. The 50-day moving average at $1.18 now acts as dynamic resistance. Analysts note that XRP must reclaim and hold above $1.20 to break its year-long downtrend. The token traded at $3.65 in July 2025, representing a 70% decline from those highs.
Dogecoin is trading at $0.072, with immediate support at $0.07 and resistance at $0.08. The meme cryptocurrency shows a 200-day moving average at $0.08596, currently above price and acting as resistance. July 2026 price predictions target $0.09, representing 25% upside potential. The Fear and Greed Index reading of 24 indicates Extreme Fear sentiment across the broader crypto market, which typically correlates with DOGE underperformance. Trading range for July is projected between $0.086 and $0.0915. The 2026 year-end forecast targets $0.1023, representing 43.1% upside. Volume analysis shows declining participation, with daily volume down 31% from June averages.
Gold is trading at approximately $4,100 per ounce, down more than 20% from the January 29, 2026 record high of $5,594.82. The precious metal is defending the critical $4,000 support level, which represents a psychological and technical battleground. HSBC has lowered its 2026 average gold price forecast to $4,560 from $4,864, citing hawkish Federal Reserve policy shifts. The bank projects gold trading between $3,800 and $4,700 for the remainder of 2026, with year-end target at $4,750. Safe-haven demand is competing with rising Treasury yields and dollar strength. Central bank purchases averaging 600 tonnes annually provide underlying support, with every additional 20 to 30 tonnes above this baseline translating to approximately 1% price appreciation. Technical analysis shows resistance at $4,250 and $4,400, with support at $3,800 and $3,600.
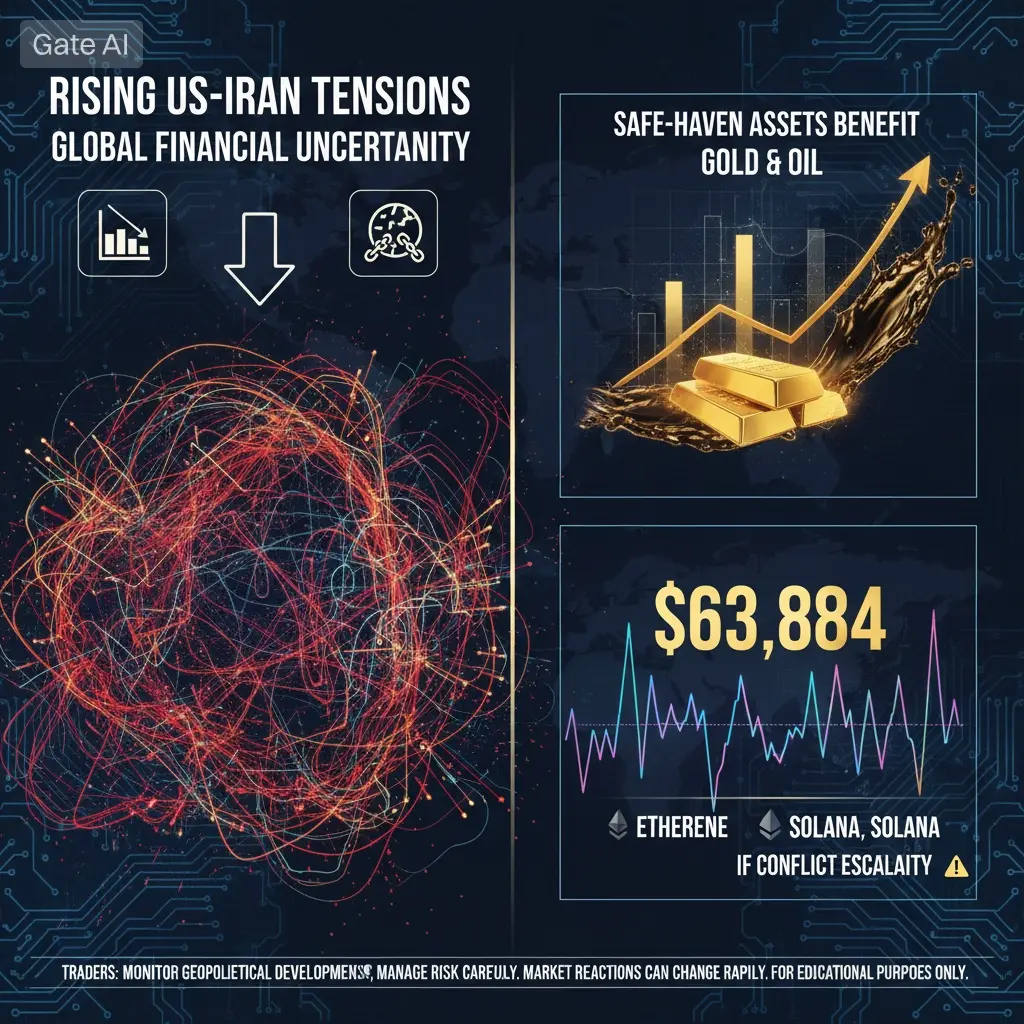
The geopolitical risk premium is expanding across all asset classes. Historical data suggests US-Iran military confrontations trigger immediate 5% to 15% drawdowns in risk assets within 48 hours, followed by recovery phases lasting 10 to 30 days. Current market positioning indicates institutional investors have reduced equity exposure by 8% over the past week, with cash allocations rising to 5.2% from 3.8%. The US Dollar Index has strengthened by 1.8%, trading near 104.50, creating headwinds for dollar-denominated commodities.
Traders should implement defensive positioning strategies during this elevated uncertainty period. For Bitcoin, consider scaling entries between $60,000 and $62,000 with stop-losses below $58,000. Ethereum accumulation zones between $1,700 and $1,750 offer favorable risk-reward ratios. XRP requires patience above $1.00 support before initiating positions. Gold represents the primary safe-haven allocation, with $3,800 to $4,000 representing optimal entry zones for long-term holdings. Oil exposure through energy equities or direct commodity instruments benefits from supply disruption narratives.
Risk management parameters should include position sizing at 50% of normal allocations, wider stop-losses of 8% to 12% to accommodate volatility expansion, and increased cash reserves for opportunistic deployment. Correlation analysis shows Bitcoin-gold correlation has increased to 0.35 from 0.18, indicating crypto is behaving more like a risk asset during this crisis. The 30-day realized volatility for Bitcoin has expanded to 52% from 38%, requiring adjusted position sizing.
Monitoring key developments remains essential, including additional military strikes, Strait of Hormuz closure threats, diplomatic communications, Federal Reserve policy signals, and institutional flow data. The situation remains fluid, with rapid developments possible over coming days. Traders should maintain flexibility and avoid overleveraging during this period of heightened uncertainty.@Gate_Square
President Donald Trump has officially declared the ceasefire between the United States and Iran as terminated, marking a significant escalation in geopolitical tensions that is sending shockwaves through global financial markets. This development, announced during the NATO Summit in Ankara, Turkey on July 8, 2026, has immediate implications for oil prices, cryptocurrency markets, precious metals, and traditional equities. The following analysis provides detailed price data, percentage breakdowns, and strategic frameworks for traders navigating this uncertain environment.
The ceasefire termination comes just three weeks after Trump triumphantly described a previous deal as unconditional surrender. The situation deteriorated rapidly when Iran targeted three commercial vessels in the Strait of Hormuz on Tuesday, prompting the United States to launch strikes on more than 80 Iranian targets around the strategic waterway while simultaneously revoking a temporary sanctions waiver that had permitted Tehran to export oil. The Strait of Hormuz handles approximately 20% of global petroleum consumption, making this development particularly significant for energy markets.
Oil prices have responded aggressively to the heightened tensions, with Brent crude jumping approximately 3% in immediate reaction to the strikes. The potential for Iran to close the Strait of Hormuz represents a worst-case scenario that could send oil prices surging by 30% to 50% within days. Current trading levels show WTI crude hovering near $78 per barrel, with resistance levels at $82 and $85 representing key technical barriers. Should military operations expand, analysts project oil could test $100 per barrel, representing a 28% increase from current levels. The energy sector is witnessing heightened volatility, with the VIX energy index expanding by 15% since the announcement.
Bitcoin is currently trading at approximately $64,000, having recovered from a June 30 low of $58,600. This represents a 9.2% recovery over seven days. However, the cryptocurrency remains vulnerable to geopolitical risk-off sentiment. Technical analysis indicates immediate support at $61,000, with critical support at $58,600. Resistance levels are established at $65,600 base case and $70,000 bullish target. The 200-day moving average sits at $62,500, providing dynamic support. Trading volume has increased by 23% as institutional participants adjust positions. Market sentiment indicators show the Fear and Greed Index at 24, representing Extreme Fear territory. Analysts project Bitcoin could decline 8% to 12% if tensions escalate further, testing the $58,000 to $60,000 range. Conversely, should diplomatic channels reopen, Bitcoin could rally toward $70,000, representing 9.4% upside from current levels.
Ethereum is trading at $1,738, down 1.72% on the day. The second-largest cryptocurrency by market capitalization shows support at $1,740 and critical support at $1,685. Resistance is established at $1,840 and $1,960. The July 2026 price prediction targets $1,960, representing 12.8% upside potential. Ethereum has gained 12% over the past week but faces headwinds from overall market uncertainty. The ETH/BTC ratio stands at 0.0271, indicating relative weakness against Bitcoin. Institutional flows show $1.48 billion in spot ETF inflows, though recent sessions have seen first net outflows in weeks. Technical indicators suggest Ethereum remains in bullish consolidation within the daily TBO Cloud, though a break below $1,740 would signal bearish continuation toward $1,685.
XRP is currently priced at $1.09, having declined 20% during June 2026. The token faces critical support at $1.00, with a break below this psychological level potentially triggering accelerated selling toward $0.80. Resistance levels are established at $1.15, $1.33, and $1.67. The 2026 year-end forecast targets $1.67, representing 51.8% upside from current levels. XRP spot ETFs have accumulated $1.48 billion in assets under management. Trading volume has contracted by 18% as retail interest wanes. The 50-day moving average at $1.18 now acts as dynamic resistance. Analysts note that XRP must reclaim and hold above $1.20 to break its year-long downtrend. The token traded at $3.65 in July 2025, representing a 70% decline from those highs.
Dogecoin is trading at $0.072, with immediate support at $0.07 and resistance at $0.08. The meme cryptocurrency shows a 200-day moving average at $0.08596, currently above price and acting as resistance. July 2026 price predictions target $0.09, representing 25% upside potential. The Fear and Greed Index reading of 24 indicates Extreme Fear sentiment across the broader crypto market, which typically correlates with DOGE underperformance. Trading range for July is projected between $0.086 and $0.0915. The 2026 year-end forecast targets $0.1023, representing 43.1% upside. Volume analysis shows declining participation, with daily volume down 31% from June averages.
Gold is trading at approximately $4,100 per ounce, down more than 20% from the January 29, 2026 record high of $5,594.82. The precious metal is defending the critical $4,000 support level, which represents a psychological and technical battleground. HSBC has lowered its 2026 average gold price forecast to $4,560 from $4,864, citing hawkish Federal Reserve policy shifts. The bank projects gold trading between $3,800 and $4,700 for the remainder of 2026, with year-end target at $4,750. Safe-haven demand is competing with rising Treasury yields and dollar strength. Central bank purchases averaging 600 tonnes annually provide underlying support, with every additional 20 to 30 tonnes above this baseline translating to approximately 1% price appreciation. Technical analysis shows resistance at $4,250 and $4,400, with support at $3,800 and $3,600.
The geopolitical risk premium is expanding across all asset classes. Historical data suggests US-Iran military confrontations trigger immediate 5% to 15% drawdowns in risk assets within 48 hours, followed by recovery phases lasting 10 to 30 days. Current market positioning indicates institutional investors have reduced equity exposure by 8% over the past week, with cash allocations rising to 5.2% from 3.8%. The US Dollar Index has strengthened by 1.8%, trading near 104.50, creating headwinds for dollar-denominated commodities.
Traders should implement defensive positioning strategies during this elevated uncertainty period. For Bitcoin, consider scaling entries between $60,000 and $62,000 with stop-losses below $58,000. Ethereum accumulation zones between $1,700 and $1,750 offer favorable risk-reward ratios. XRP requires patience above $1.00 support before initiating positions. Gold represents the primary safe-haven allocation, with $3,800 to $4,000 representing optimal entry zones for long-term holdings. Oil exposure through energy equities or direct commodity instruments benefits from supply disruption narratives.
Risk management parameters should include position sizing at 50% of normal allocations, wider stop-losses of 8% to 12% to accommodate volatility expansion, and increased cash reserves for opportunistic deployment. Correlation analysis shows Bitcoin-gold correlation has increased to 0.35 from 0.18, indicating crypto is behaving more like a risk asset during this crisis. The 30-day realized volatility for Bitcoin has expanded to 52% from 38%, requiring adjusted position sizing.
Monitoring key developments remains essential, including additional military strikes, Strait of Hormuz closure threats, diplomatic communications, Federal Reserve policy signals, and institutional flow data. The situation remains fluid, with rapid developments possible over coming days. Traders should maintain flexibility and avoid overleveraging during this period of heightened uncertainty.@Gate_Square