CcChenYifan

vip
Diamond Hands
Market Analyst
Futures Trading Strategist
Hello everyone, this is my new account. My longtime followers know that Yifan's ideas are updated in real-time daily, focusing on: mainstream coins, short-term trading, swing trading, and medium to long-term investments.
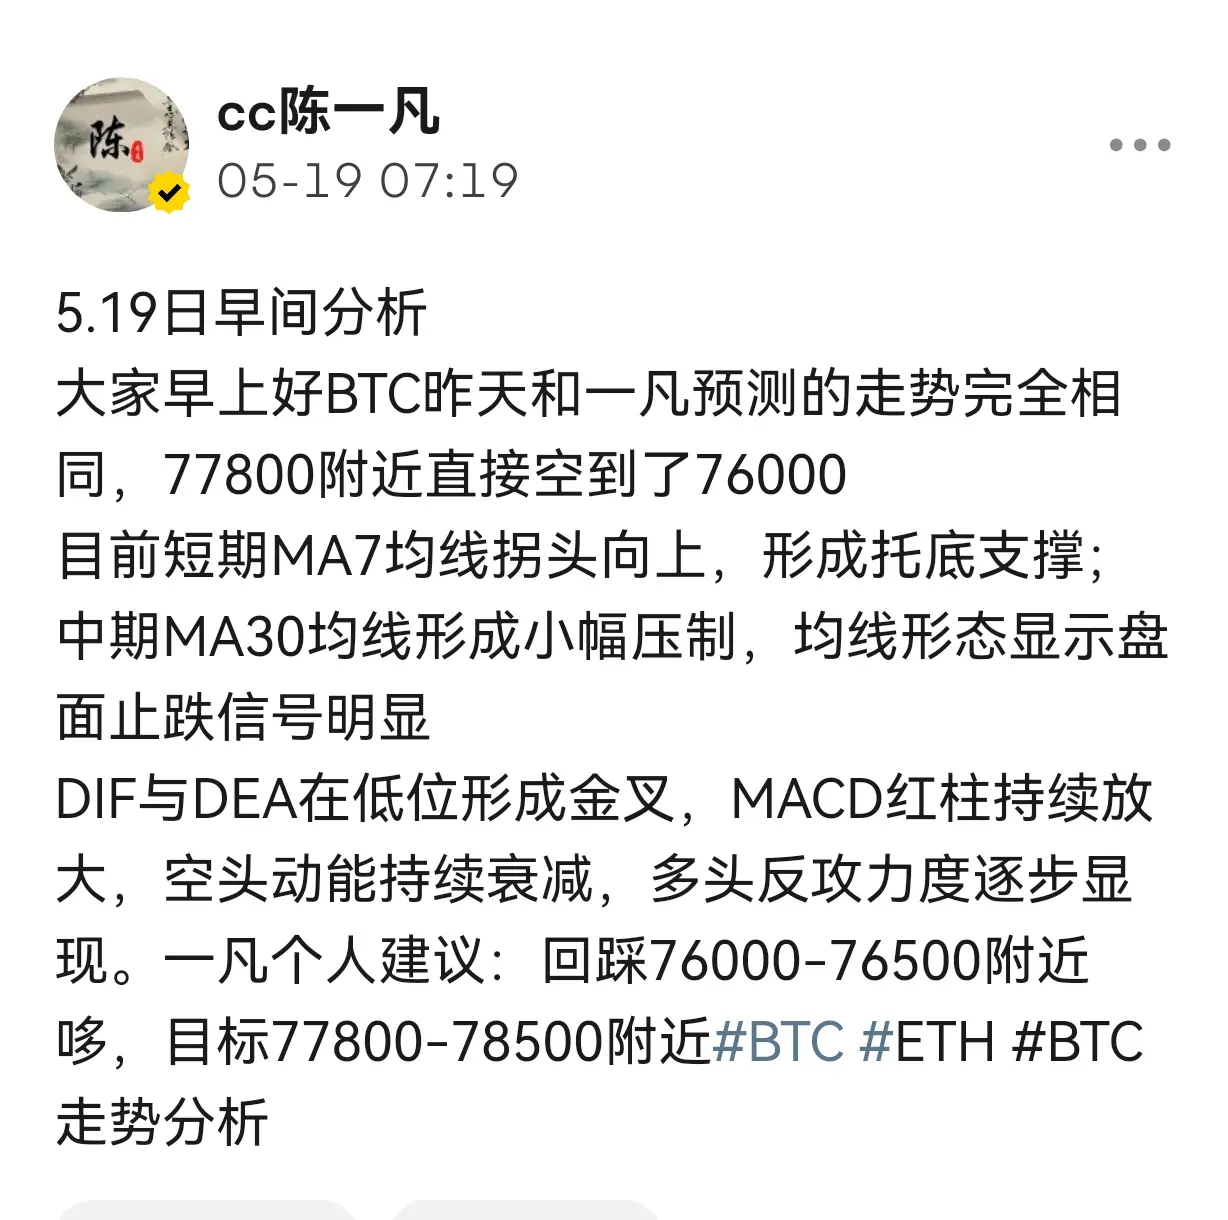
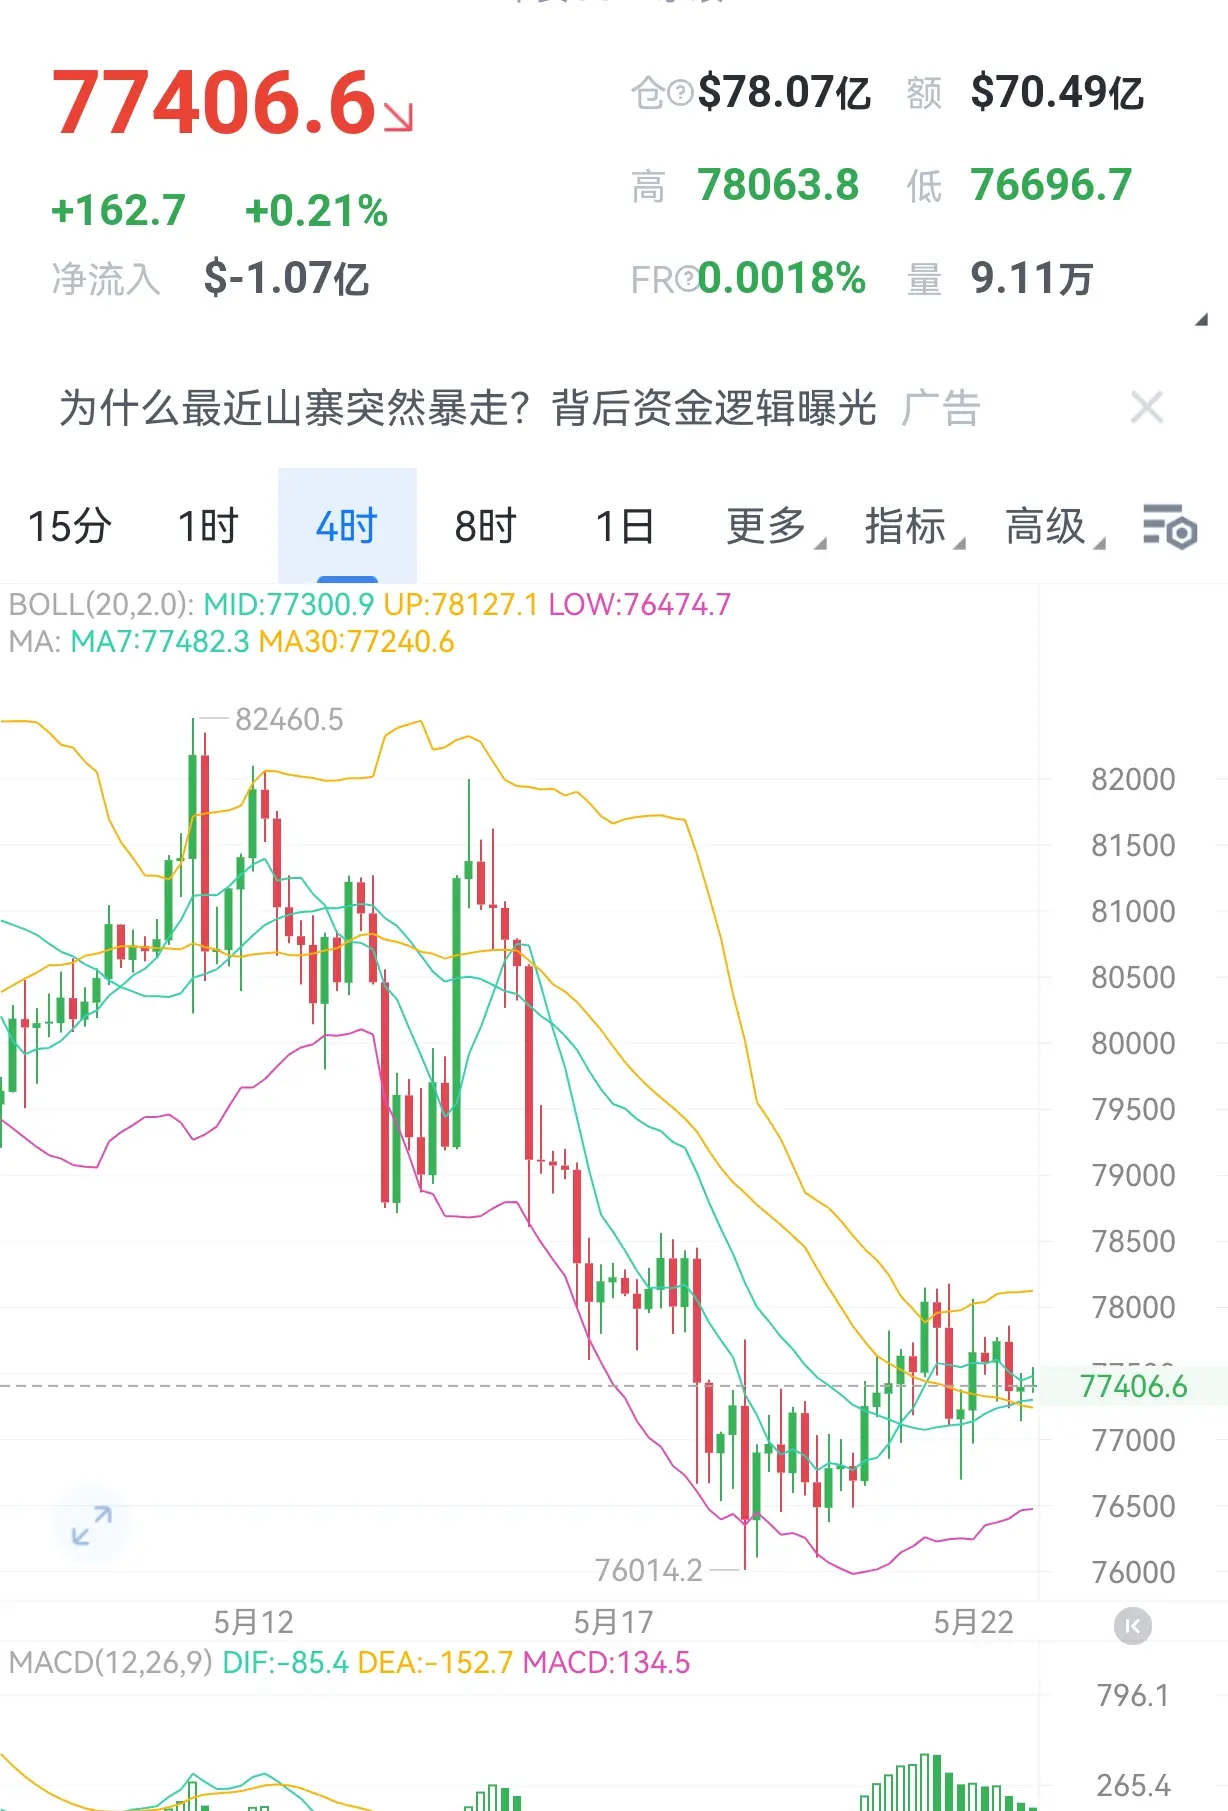
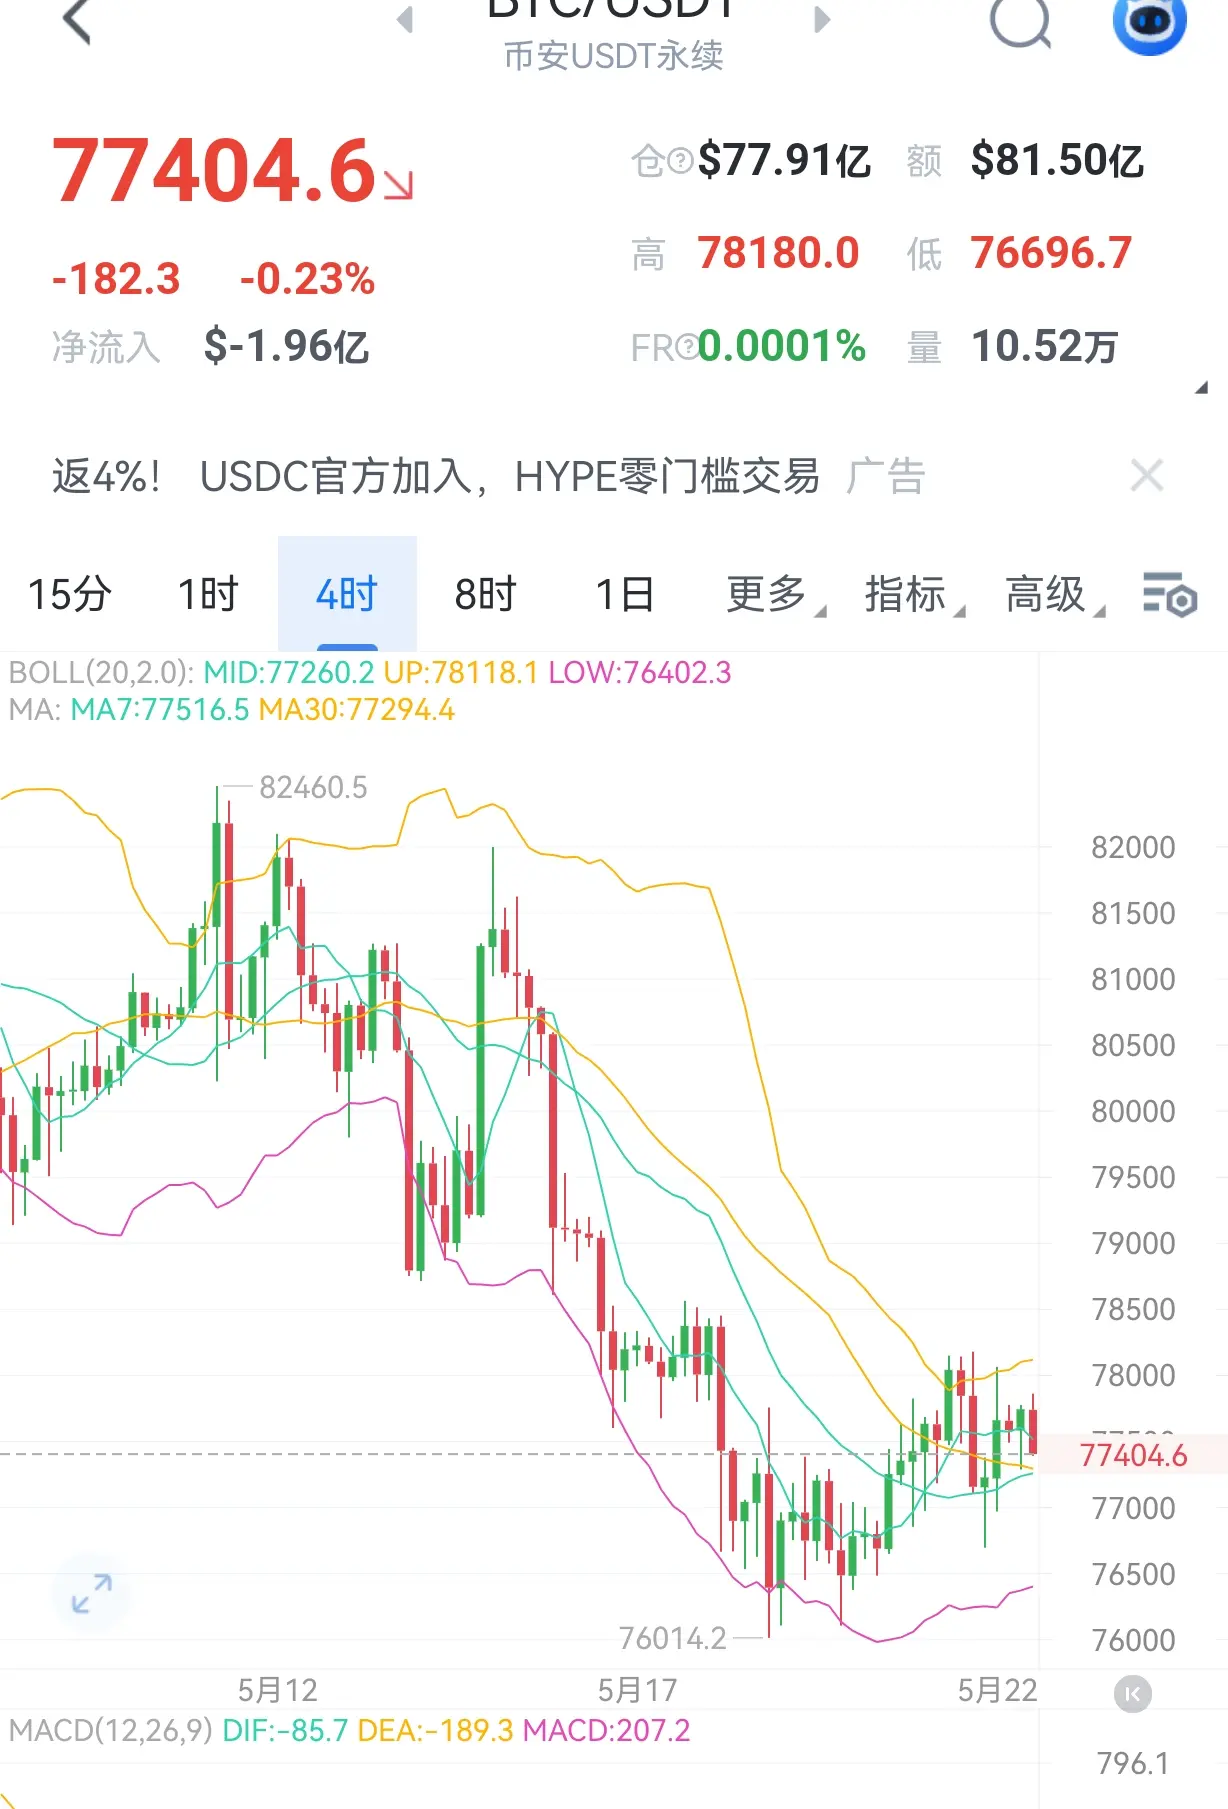
Yesterday I already told everyone, at that time don’t look at the market chart as overly strong, that position was only suitable for making a quick move, and the market trend indeed confirmed the previous judgment, taking advantage of the trend allowed us to seize the opportunity. Next, you can continue to pay attention to market changes and control the rhythm well. #BTC #ETH #BTC走势分析
BTC-0.62%
ETH-0.41%
View Original
post-image
post-image
  • Reward
  • Comment
  • Repost
  • Share
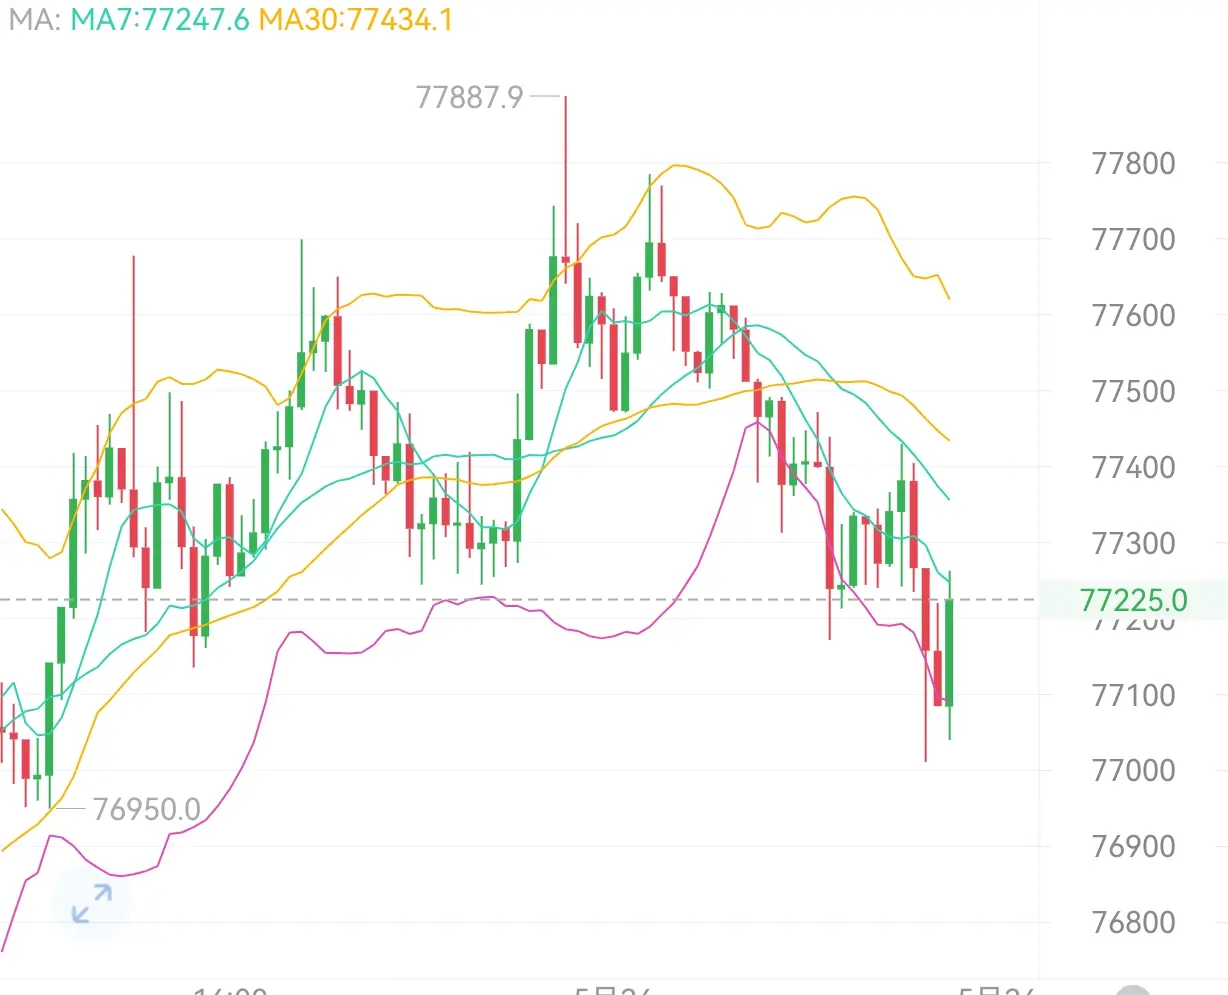
May 26 Morning Analysis
Yesterday $BTC followed Yifan's approach completely, watching 77,400 in the morning, 77,800 in the morning, and 77,800 in the evening, with KONG currently also moving out by several hundred. Let's talk about the current market's moving average system: MA7 (77,328.1), MA30 (77,380.8) are in a bearish arrangement, with the price below both moving averages, and the upper moving average forming short-term strong resistance.

- MACD: DIF=4.2, DEA=16.8, MACD histogram=-25.3 (green bars). DIF continues to run below DEA, with no obvious reversal signal in the bearish zon
BTC-0.62%
ETH-0.41%
View Original
post-image
post-image
  • Reward
  • Comment
  • Repost
  • Share
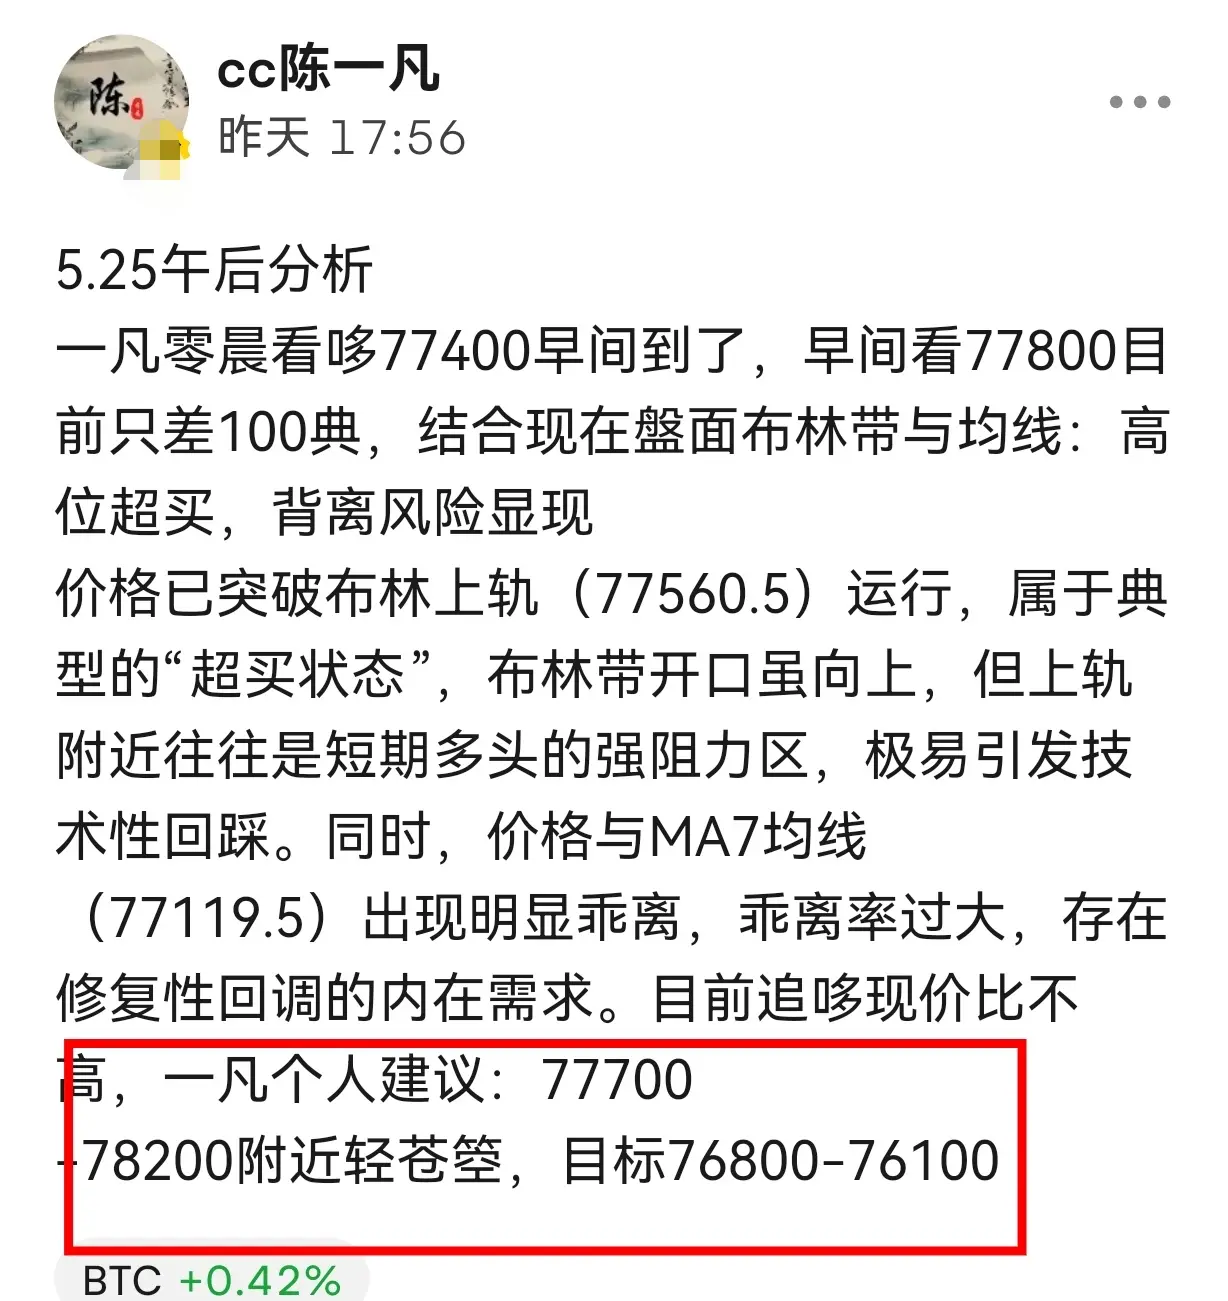
5.25 Afternoon Analysis
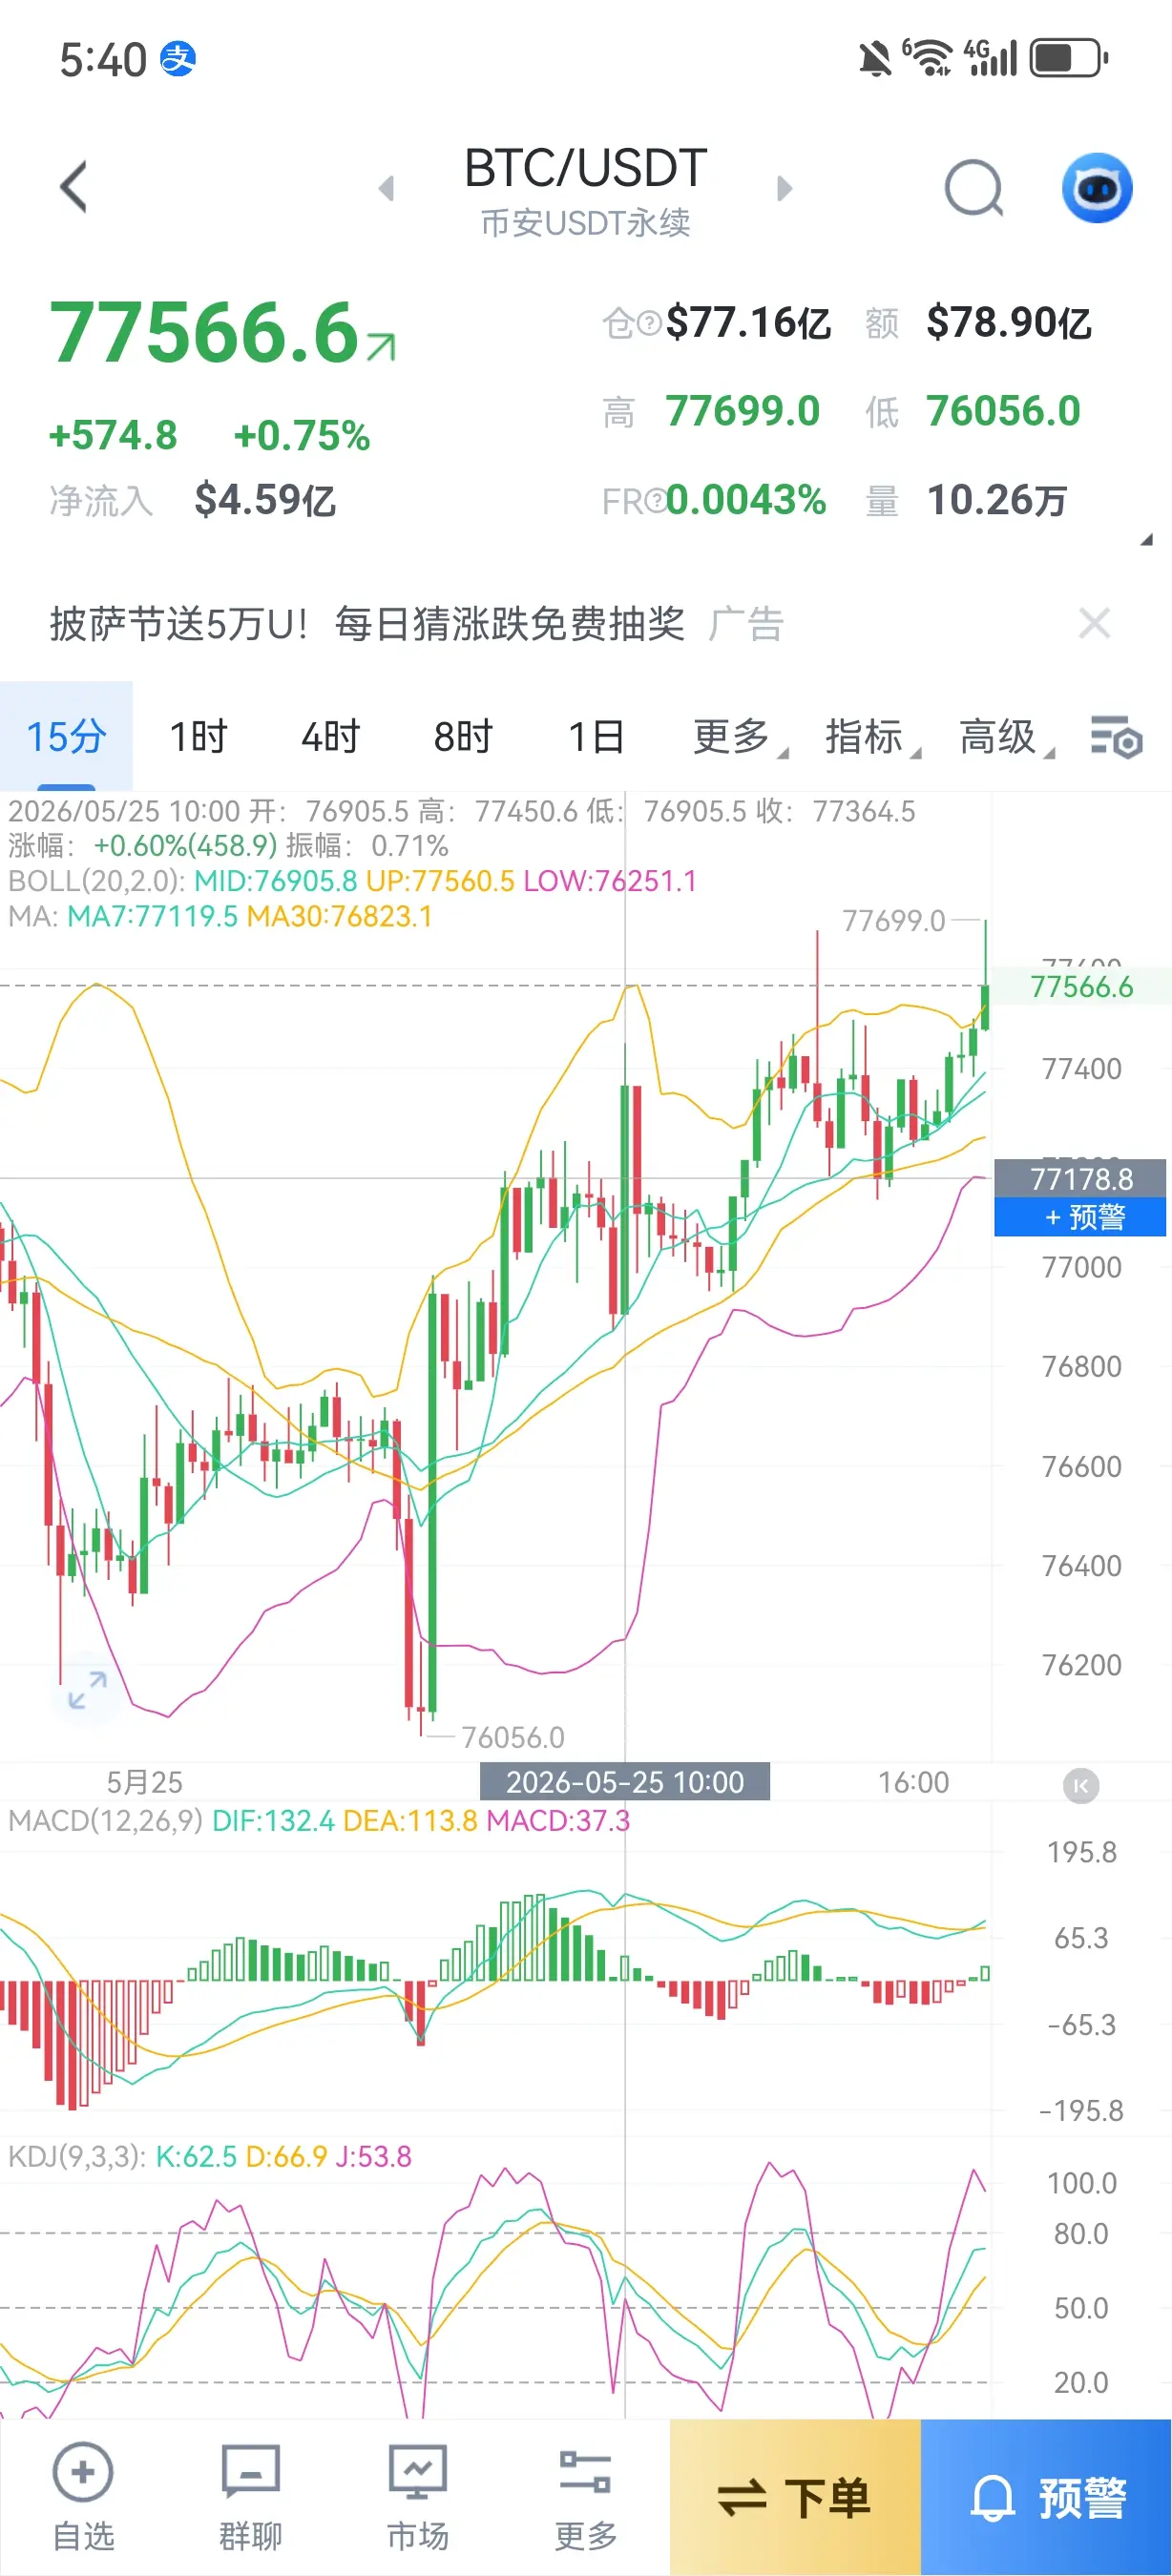
Yifan saw Dodo 77400 in the early morning, reached in the early morning at 77800, currently only 100 points away, combined with the current Bollinger Bands and moving averages on the chart: overbought at high levels, divergence risk is emerging
Price has broken through the upper Bollinger Band (77560.5) and is operating within it, which is a typical "overbought condition," although the Bollinger Bands are opening upward, the area near the upper band is often a strong resistance zone for short-term bulls, easily triggering technical pullbacks. Meanwhile, the price sh
BTC-0.62%
ETH-0.41%
View Original
post-image
post-image
  • Reward
  • Comment
  • Repost
  • Share
This Week's Key Events: Aheads of Time for Everyone
Core Event Preview
Time TBA | The US and Iran are about to reach a preliminary agreement!
(The core variable for easing geopolitical risks, directly affecting oil prices, inflation expectations, and risk asset sentiment)
Monday
- U.S. stock markets are closed for a holiday (market liquidity is low, volatility may increase)
Tuesday
- 22:00 U.S. May Conference Board Consumer Confidence Index
- 22:30 U.S. May Dallas Fed Manufacturing Activity Index
(These two data points reflect consumer spending and business activity, indirectly influencing mar
BTC-0.62%
ETH-0.41%
View Original
post-image
post-image
  • Reward
  • Comment
  • Repost
  • Share
5.25 $ZEC Midday Analysis
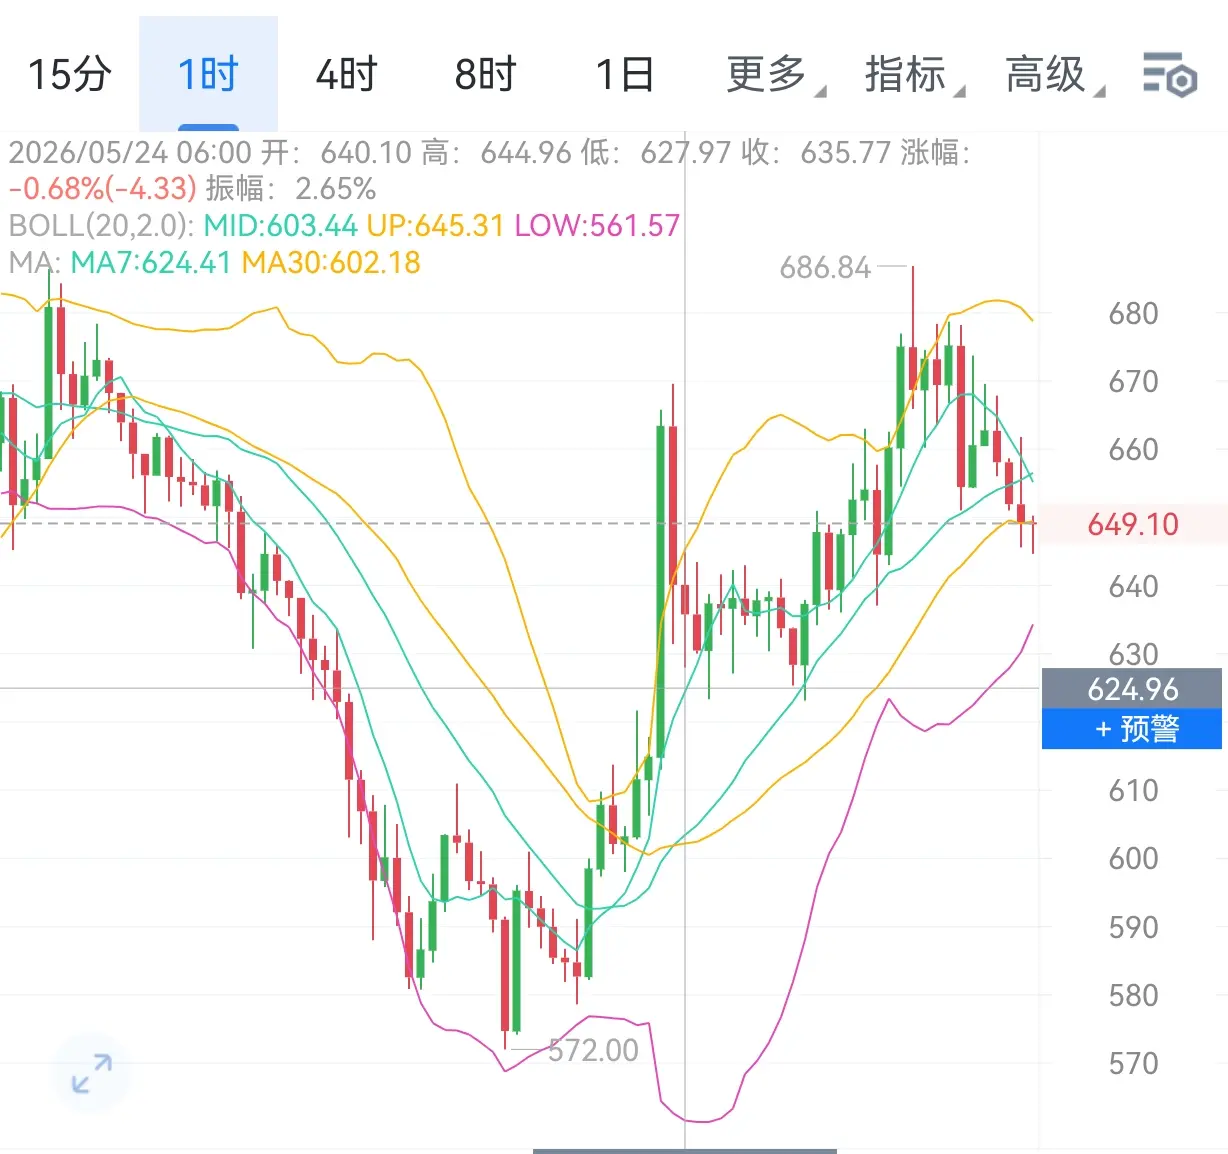
- Resistance levels: First resistance 656 (Bollinger middle band + MA7), second resistance 670-680 (previous swing high points, combined with heavy sell order sell-off pressure).

- Support levels: First support 634 (Bollinger lower band), second support 623 (intraday low).

- Trading approach:

- For short-term short positions, watch for resistance opportunities in the 656-680 range, with targets 635-630,

- Long positions are temporarily on hold. Wait for a pullback near 634 and for a bottom divergence signal to appear before placing a small-position entry. #BT
ZEC-3.2%
View Original
post-image
  • Reward
  • Comment
  • Repost
  • Share
May 25th $ETH Morning Analysis
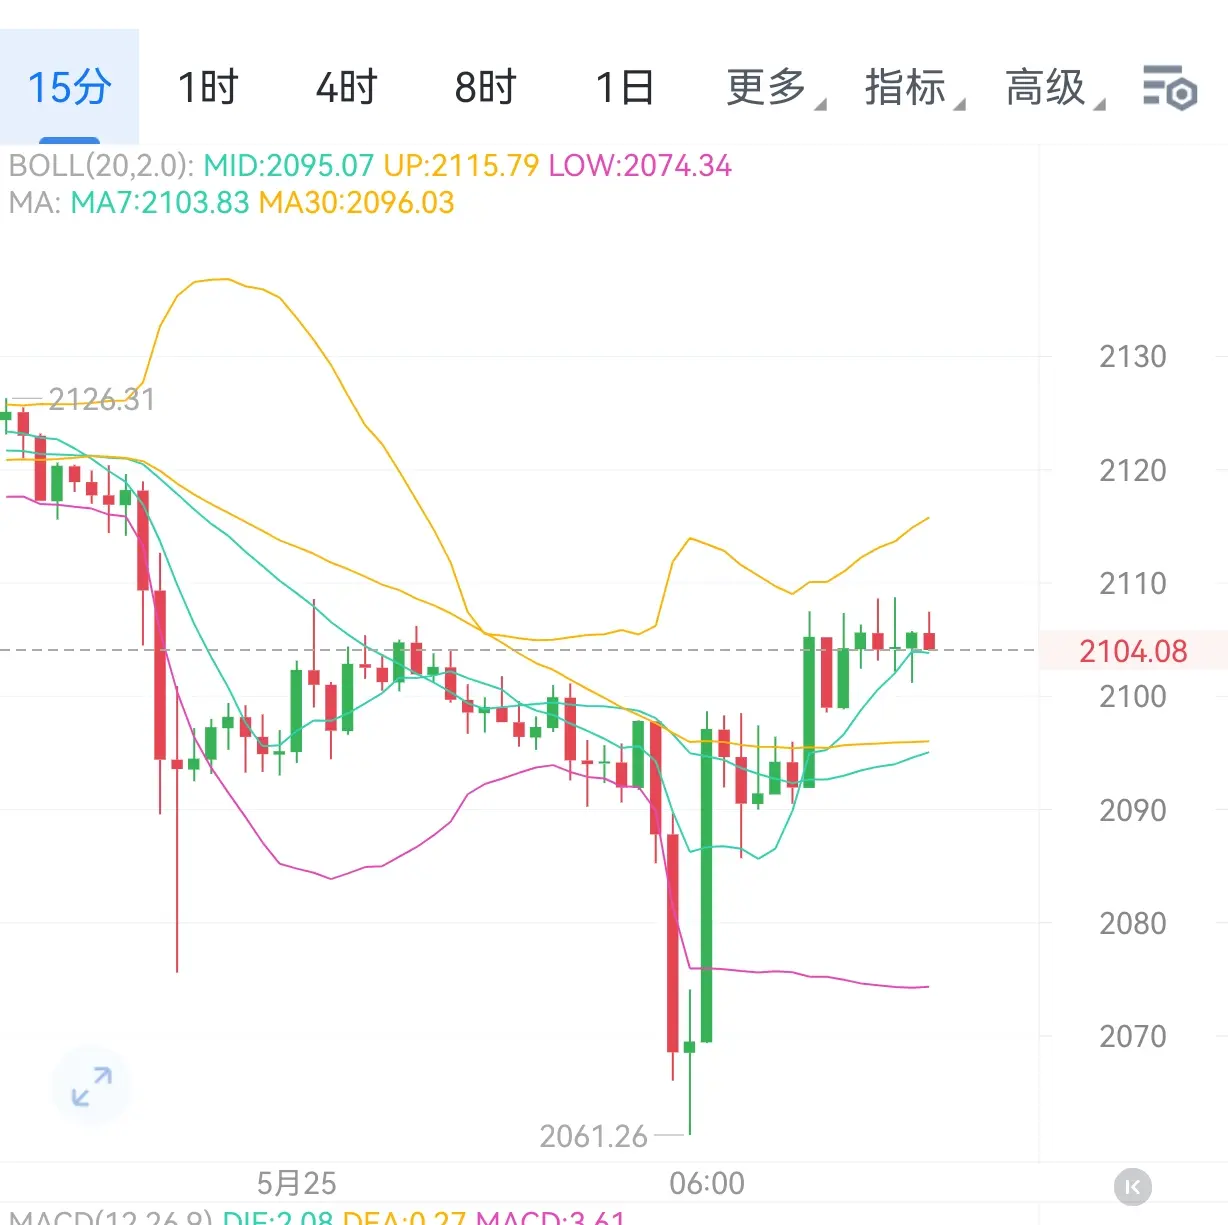
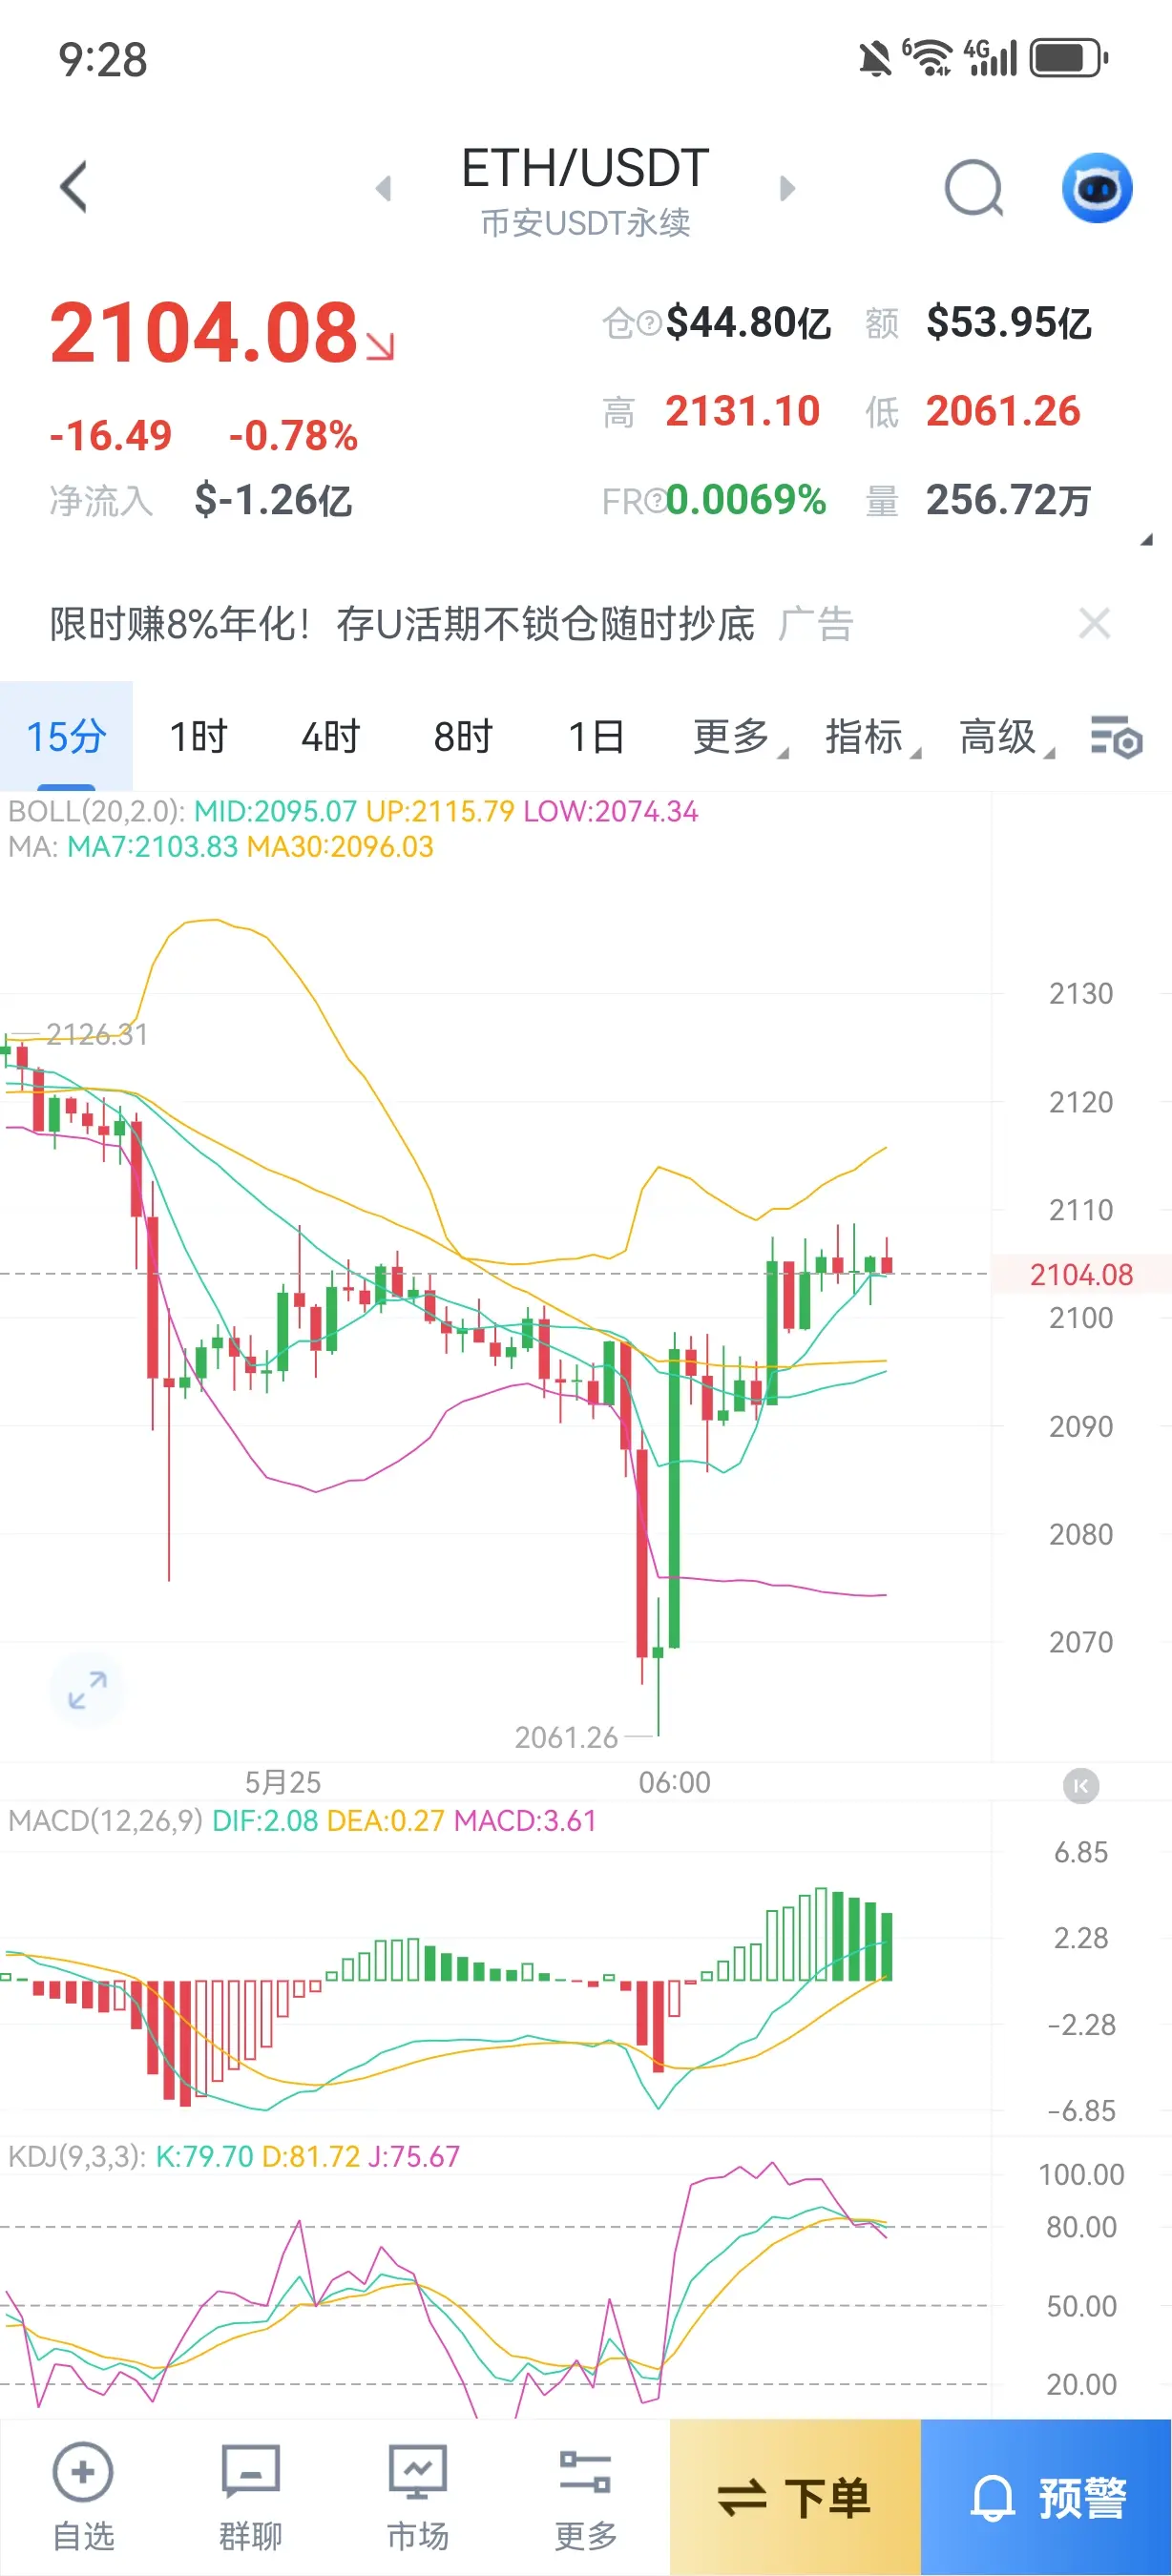
Short-term moving averages: MA7=2103.93, MA30=2096.05
MACD indicators: DIF 2.13, DEA 0.28, histogram bars operating above the zero line
KDJ indicator values are high, overall in the high zone
Bollinger Bands: Price stabilizes above the middle band, moving close to the upper band, short-term bullish pattern is dominant, with clear resistance above

Moving average trend: The market stabilizes above the short-term two moving averages, which are gradually forming a bullish trend, and the short-term trend is warming and strengthening

MACD trend: The in
ETH-0.41%
View Original
post-image
post-image
  • Reward
  • Comment
  • Repost
  • Share
May 25 Morning Analysis
This early morning, Yifan has already informed everyone,
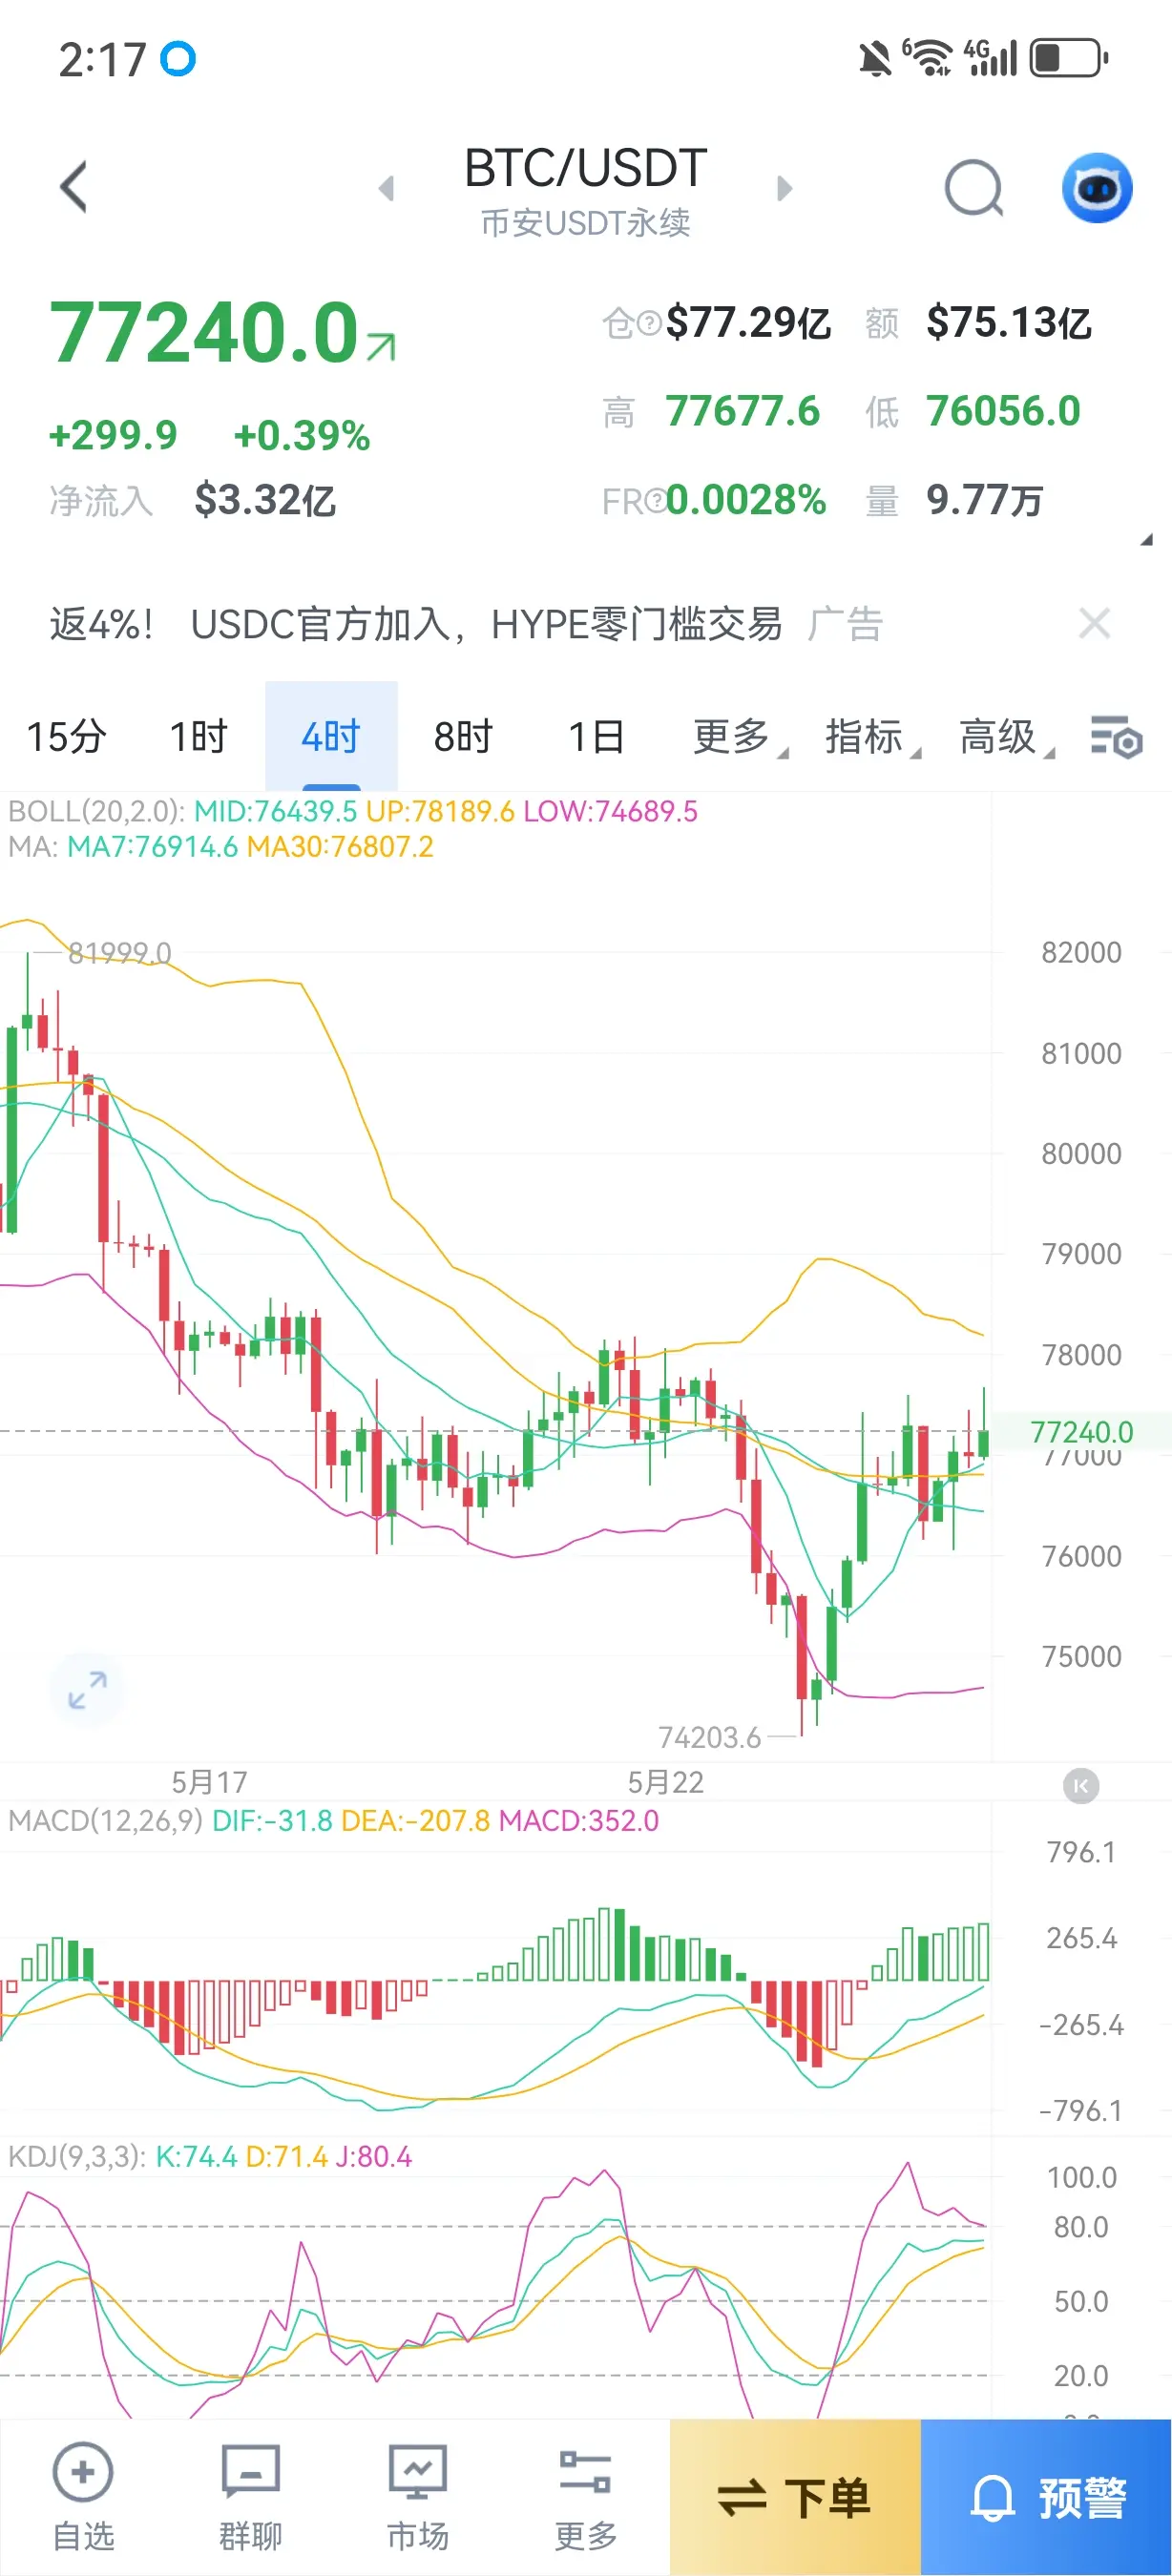
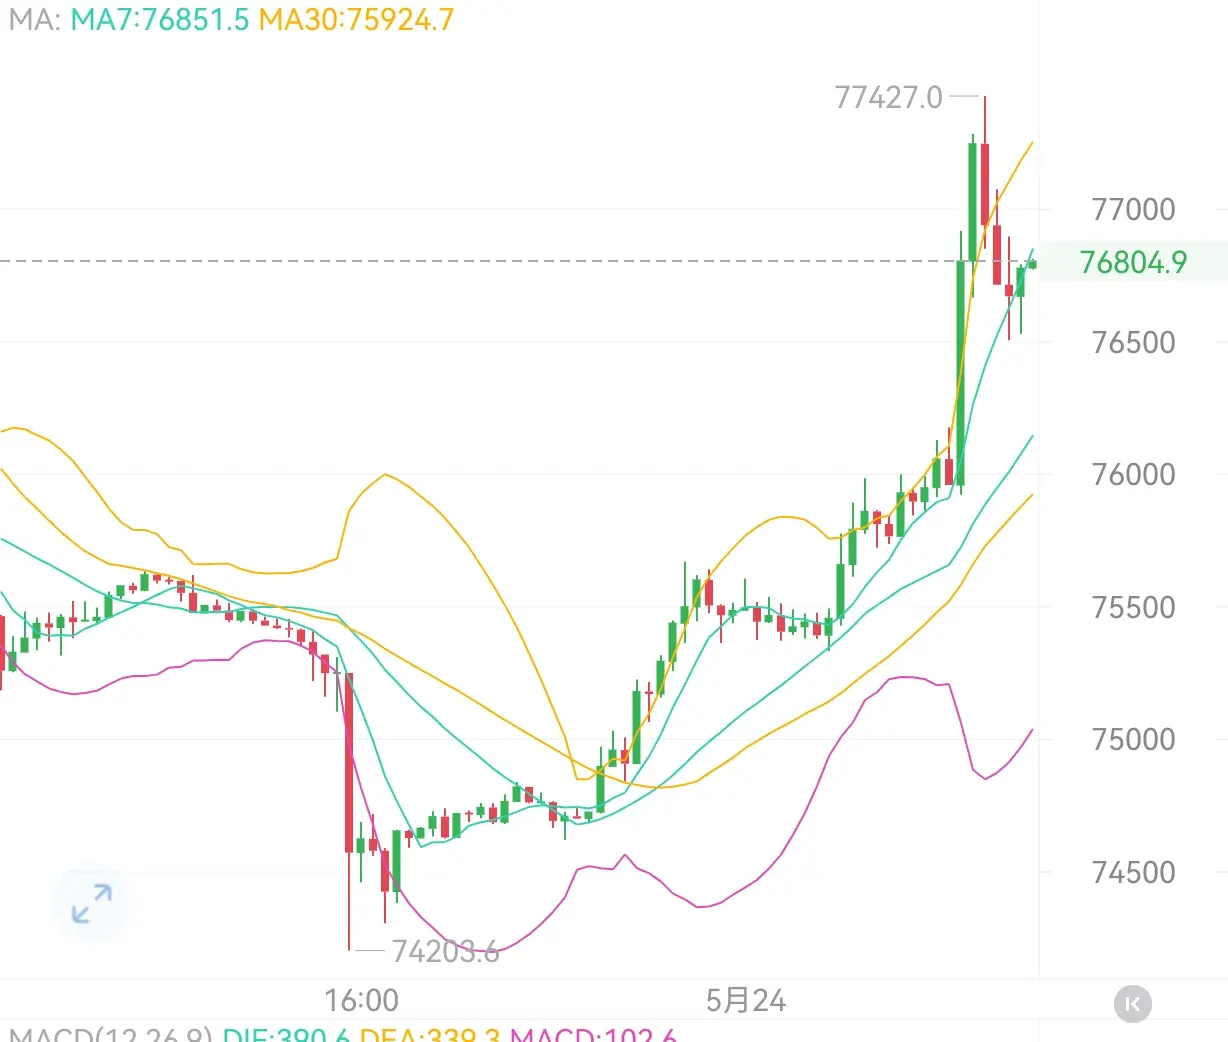
From the trend perspective, after the lowest dip to 76,056 in the early hours, a large bullish candlestick directly pulled back to the key zone, and the current price has risen back to 76,950.8, approaching the upper band of the Bollinger Bands, indicating strong market support, with panic selling quickly absorbed, and the short-term trend shifting from bearish to bullish.
On the technical indicator level, the current middle band of the Bollinger Bands is at 76,627.3, and the upper band is at 77,016.2. The p
BTC-0.62%
ETH-0.41%
View Original
post-image
  • Reward
  • Comment
  • Repost
  • Share
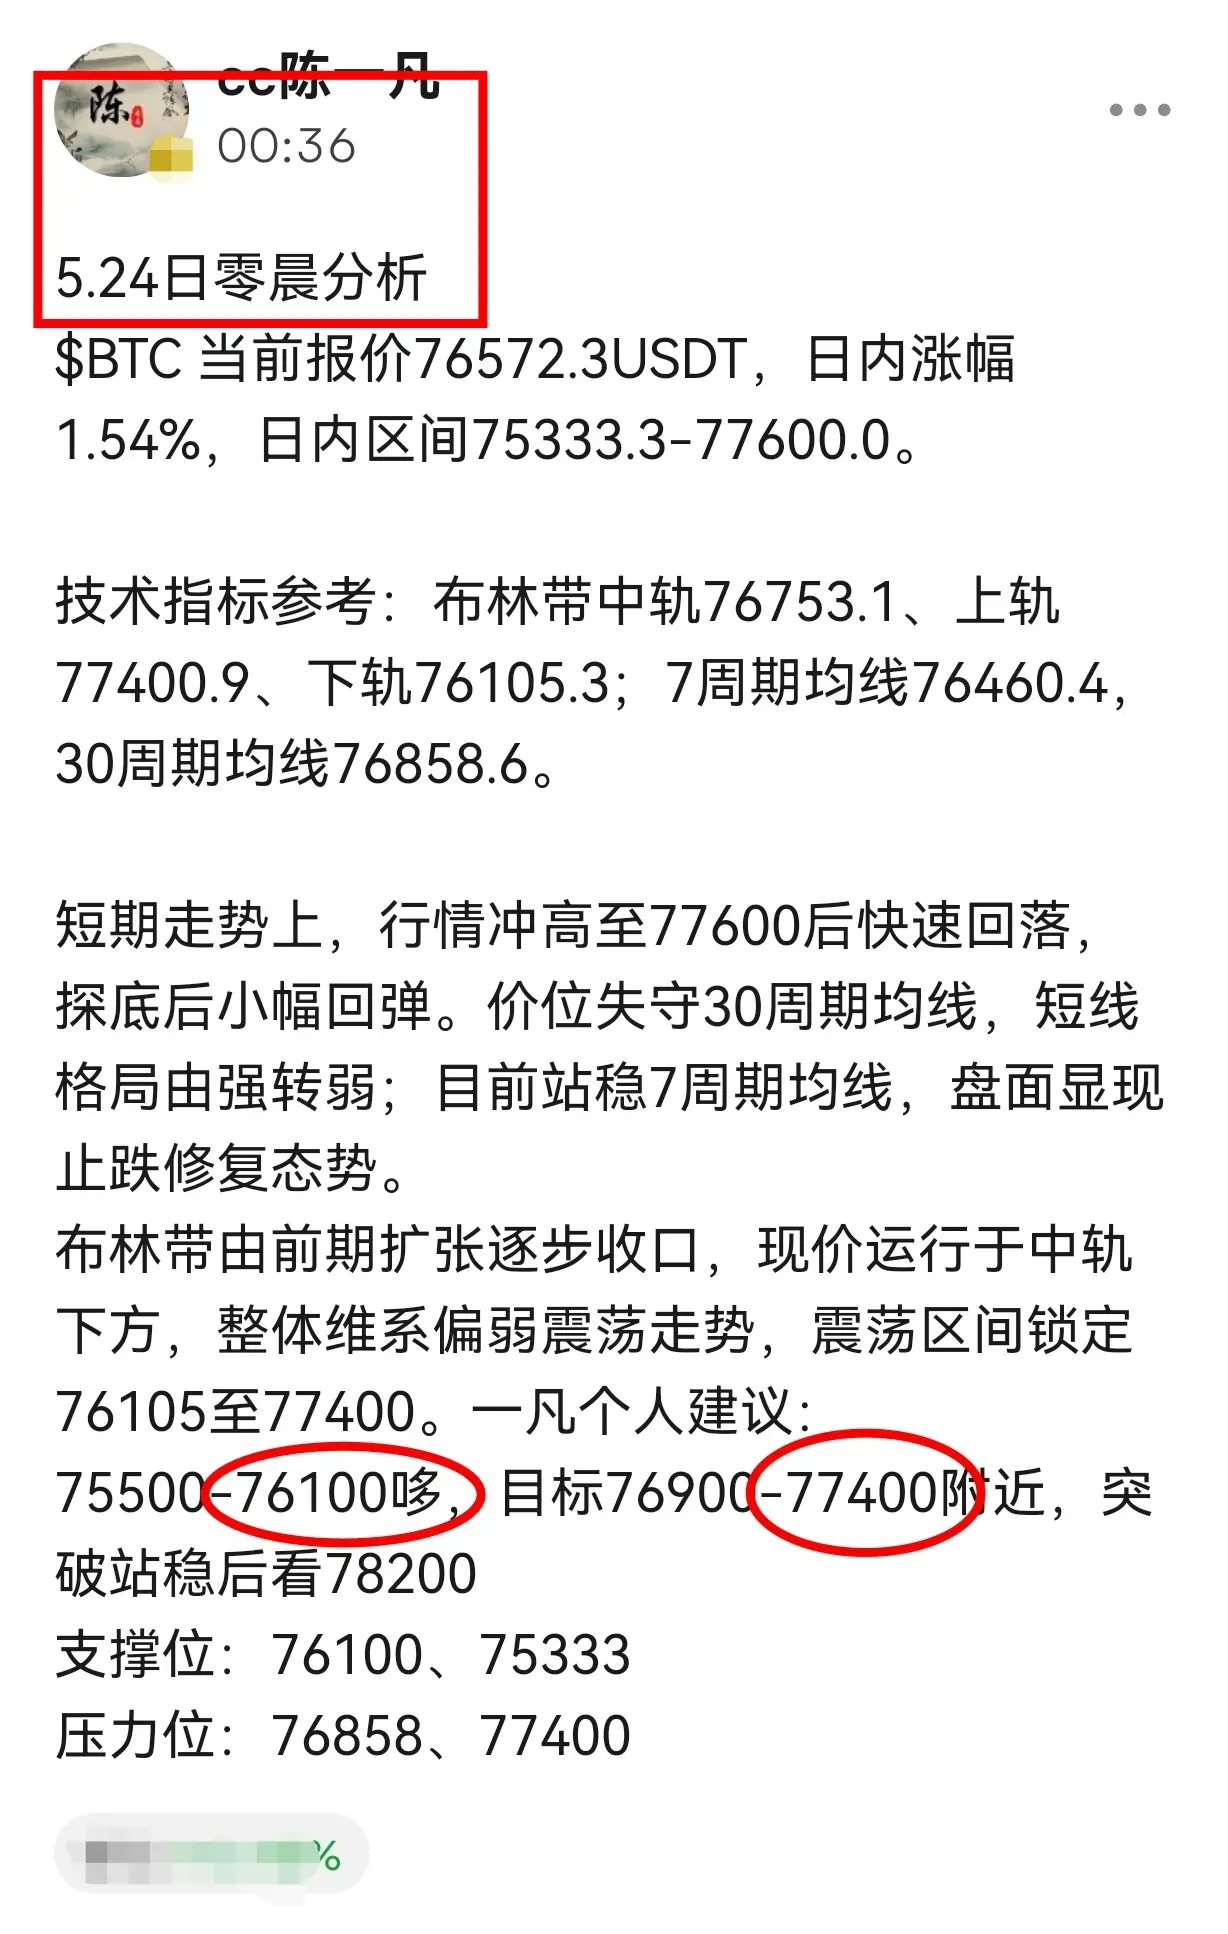
May 25 Early Morning Analysis
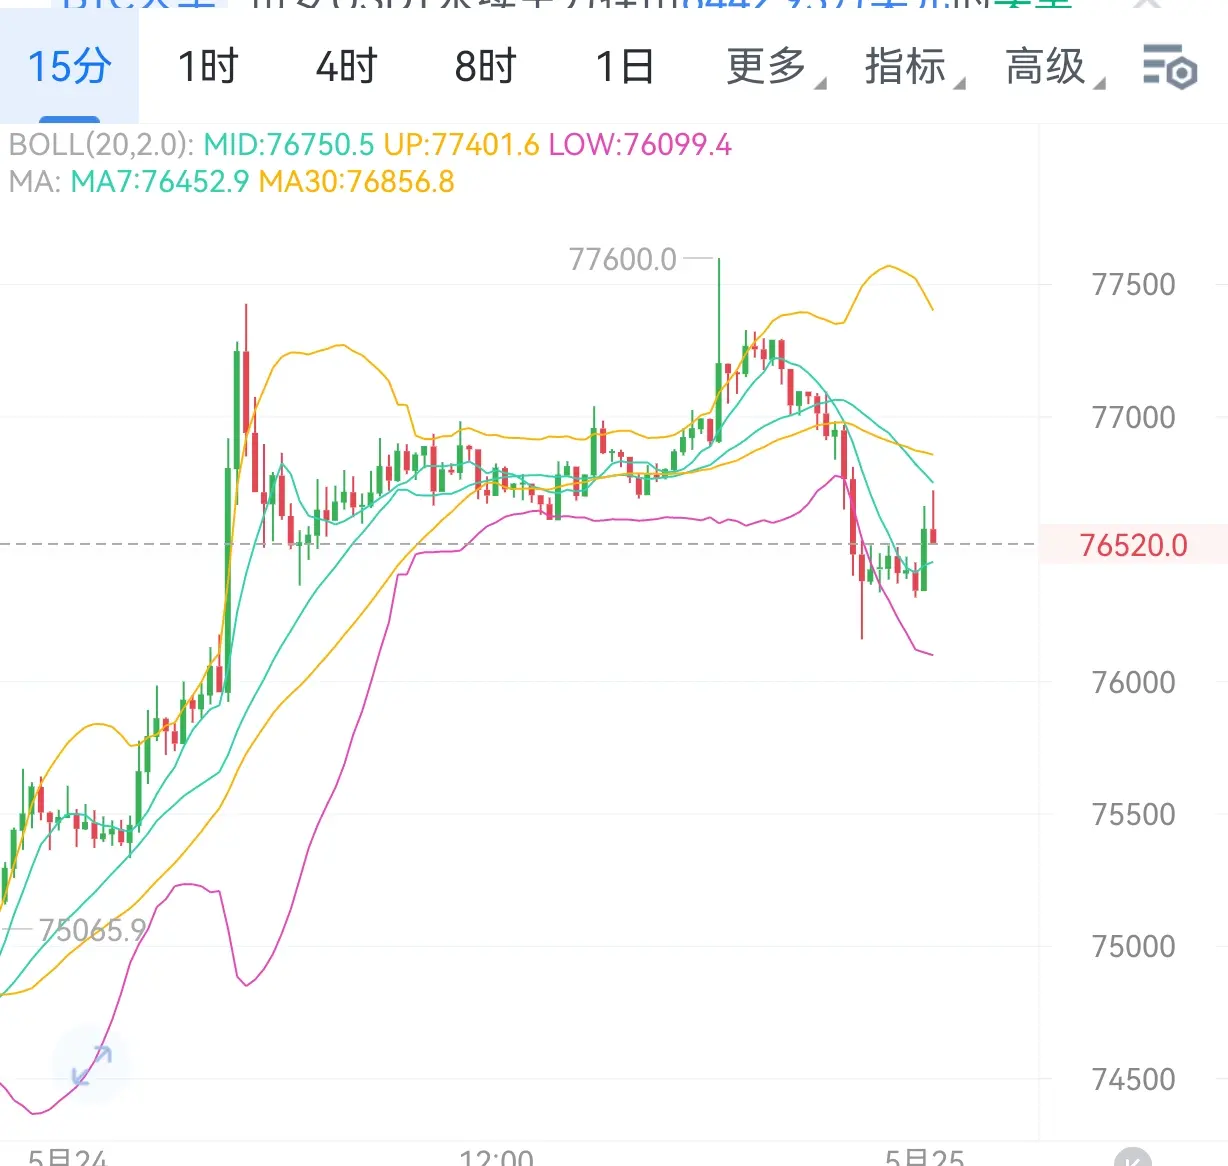
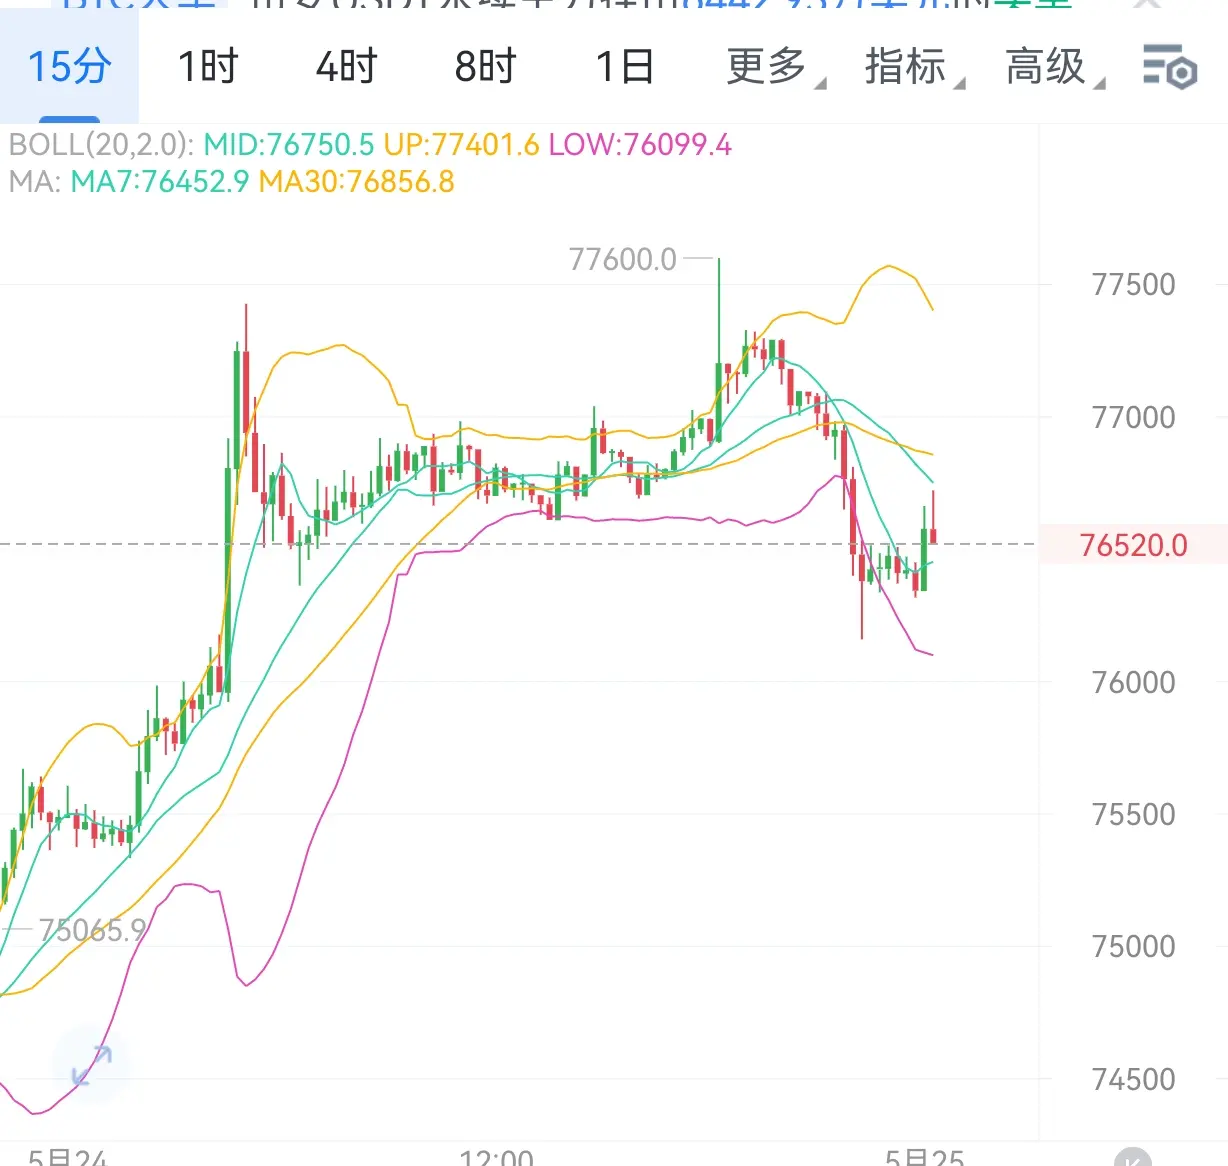
$BTC Current quote: 76,572.3 USDT, intraday increase of 1.54%, intraday range 75,333.3-77,600.0.

Technical indicator reference: Bollinger Bands middle band 76,753.1, upper band 77,400.9, lower band 76,105.3; 7-period moving average 76,460.4, 30-period moving average 76,858.6.

In the short term, the market surged to 77,600 then quickly pulled back, bottomed out, and rebounded slightly. Price broke below the 30-period moving average, turning the short-term pattern from strong to weak; currently stabilizing above the 7-period moving average, the market shows sig
BTC-0.62%
ETH-0.41%
View Original
post-image
post-image
  • Reward
  • Comment
  • Repost
  • Share
You damn idiot, all talk from your mouth, give us another positive signal.
View Original
post-image
  • Reward
  • Comment
  • Repost
  • Share
Weekend analysis for 5.24 $BTC in the morning
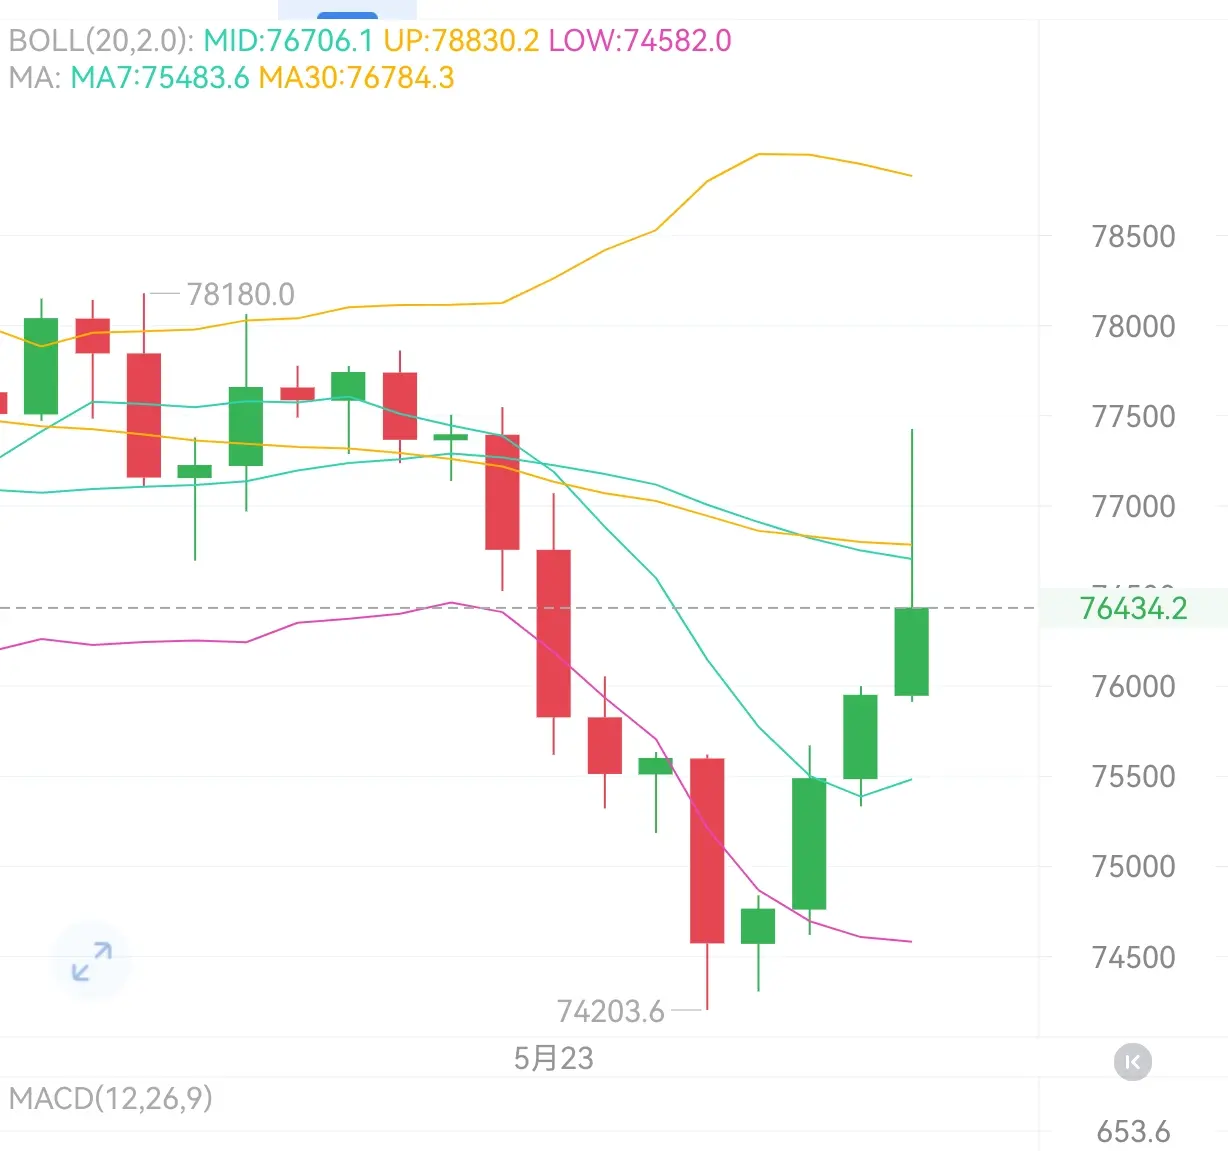
After the箜 order reached 74,500 yesterday, I observed the market stabilizing and decisively bought the dip. Currently, the哆 order has gained over 2,000 points of space. I want to especially thank Lao Te for his assistance. Let's take another look at the current market situation.
Currently, the Bollinger Bands (20, 2.0): the middle band at around 76,712.9 is the short-term support and resistance dividing line; the current price is oscillating below the middle band; the upper band at 78,835.1 corresponds to the previous high of 78,180 as a stron
BTC-0.62%
ETH-0.41%
View Original
post-image
post-image
  • Reward
  • Comment
  • Repost
  • Share
I knew you’d dump the market. You actually fell asleep in the middle of the night while doing it. This news flow is really strong. Old Ted is really amazing—this rebound can, thumbs up to Old Ted. #BTC #ETH #特朗普称美伊正敲定协议细节
BTC-0.62%
ETH-0.41%
View Original
post-image
post-image
  • Reward
  • Comment
  • Repost
  • Share
Middle East, finally seeing a window of de-escalation.
Iran says the framework has entered the final stage.
The US-Iran agreement may be coming soon.
But the market shouldn't pop the champagne too early.
Latest reports indicate that Iran has stated the framework text for reaching an agreement with the US is in the final drafting stage. Multiple sources also mention that both sides are continuing negotiations on extending the ceasefire, reopening the Strait of Hormuz, nuclear issue arrangements, sanctions relief, and phased release of frozen funds. (Financial Times)
This matter is ver
BTC-0.62%
View Original
post-image
  • Reward
  • Comment
  • Repost
  • Share
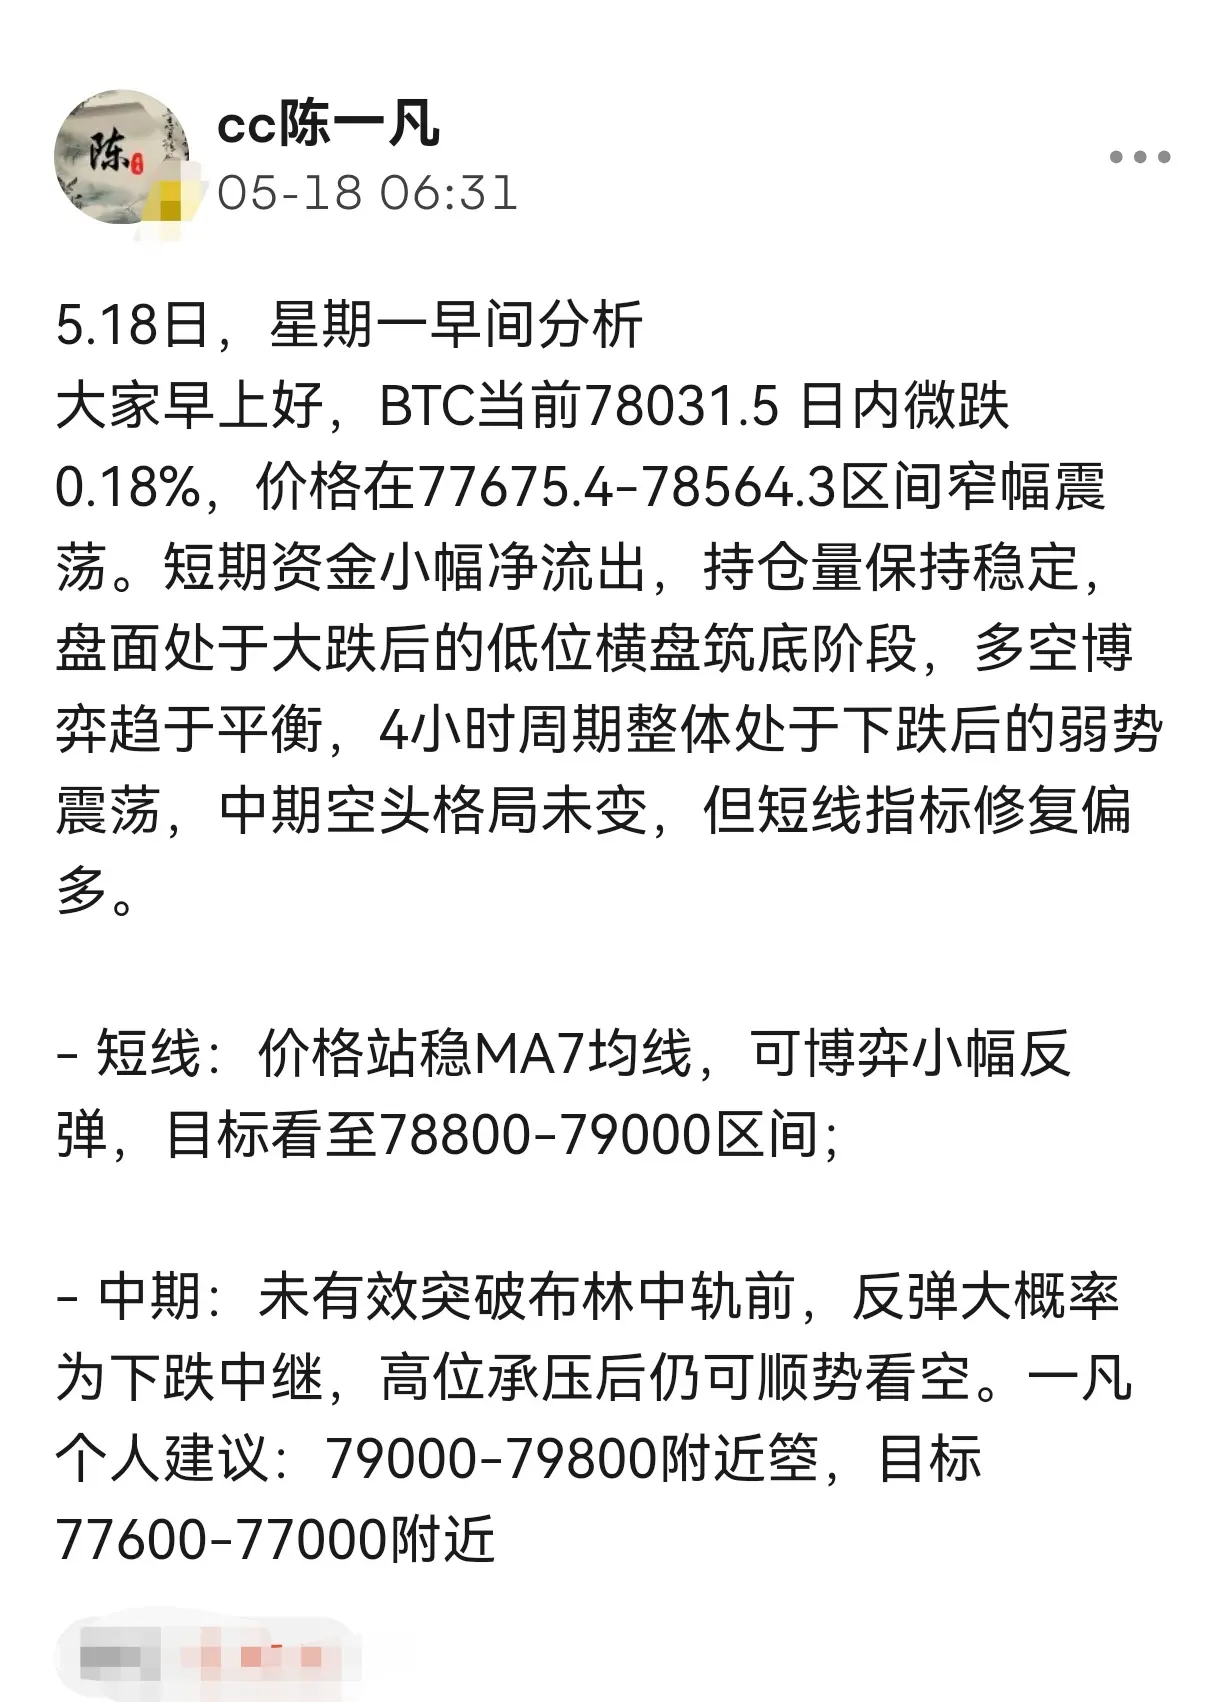
Let's review this week's market trend. Yifan has already reminded everyone to set up over the weekend, with 79664 reaching 76768. This morning, he directly reminded everyone of the position where it reached. Even if friends didn't catch up over the weekend, at least they could have gained a few hundred to nearly a thousand points by setting up early Monday morning. Throughout this time, when has Yifan's guidance for everyone been wrong? The target positions have also been accurate and on point. #BTC #ETH #BTC走势分析
BTC-0.62%
ETH-0.41%
View Original
post-image
  • Reward
  • Comment
  • Repost
  • Share
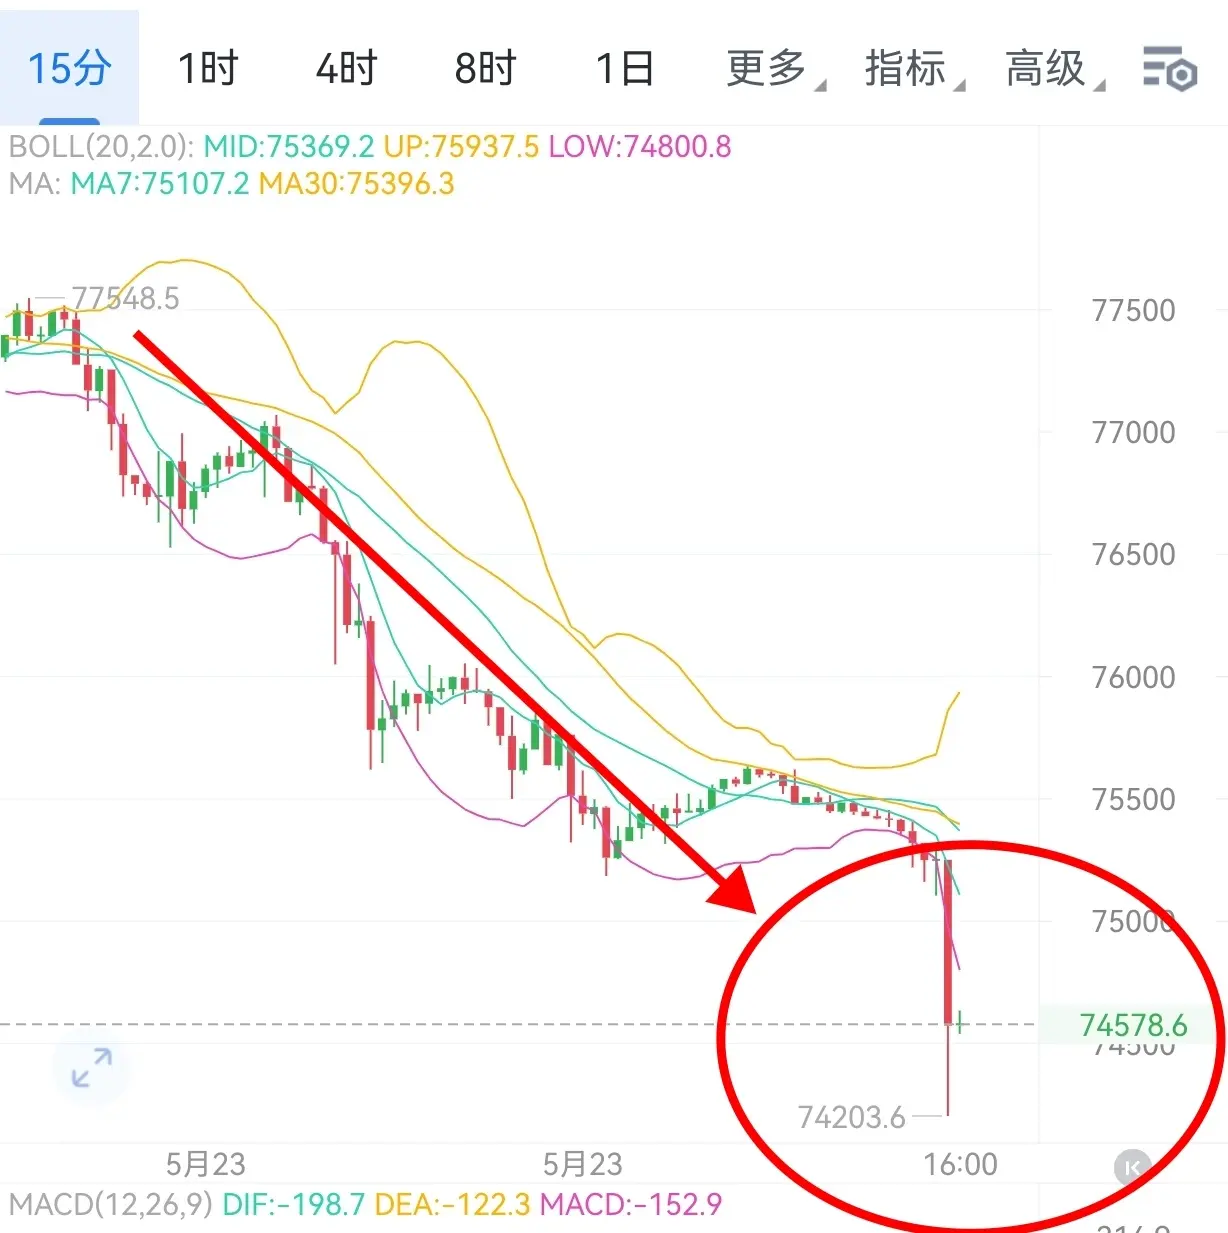
I just shared with everyone this morning. This wave directly hit 74,500. There are still plenty of friends who are thinking about buying the dip. Yifan has been reminding everyone lately: rebounds are a chance for everyone to get back in position. The previous “zhang hao” wasn’t useful. Now Yifan’s new account/channel is updating in real time every day—if you miss it, then you miss it. After seeing the post, many longtime fans came to follow along and keep up; don’t get lost again. I’ll share more dry, practical info with everyone every day. #BTC #ETH #特朗普称美伊正敲定协议细节
BTC-0.62%
ETH-0.41%
View Original
post-image
post-image
  • Reward
  • 3
  • Repost
  • Share
StayCalmWhilePlacingOrders:
I've been following you for almost half a year.
View More
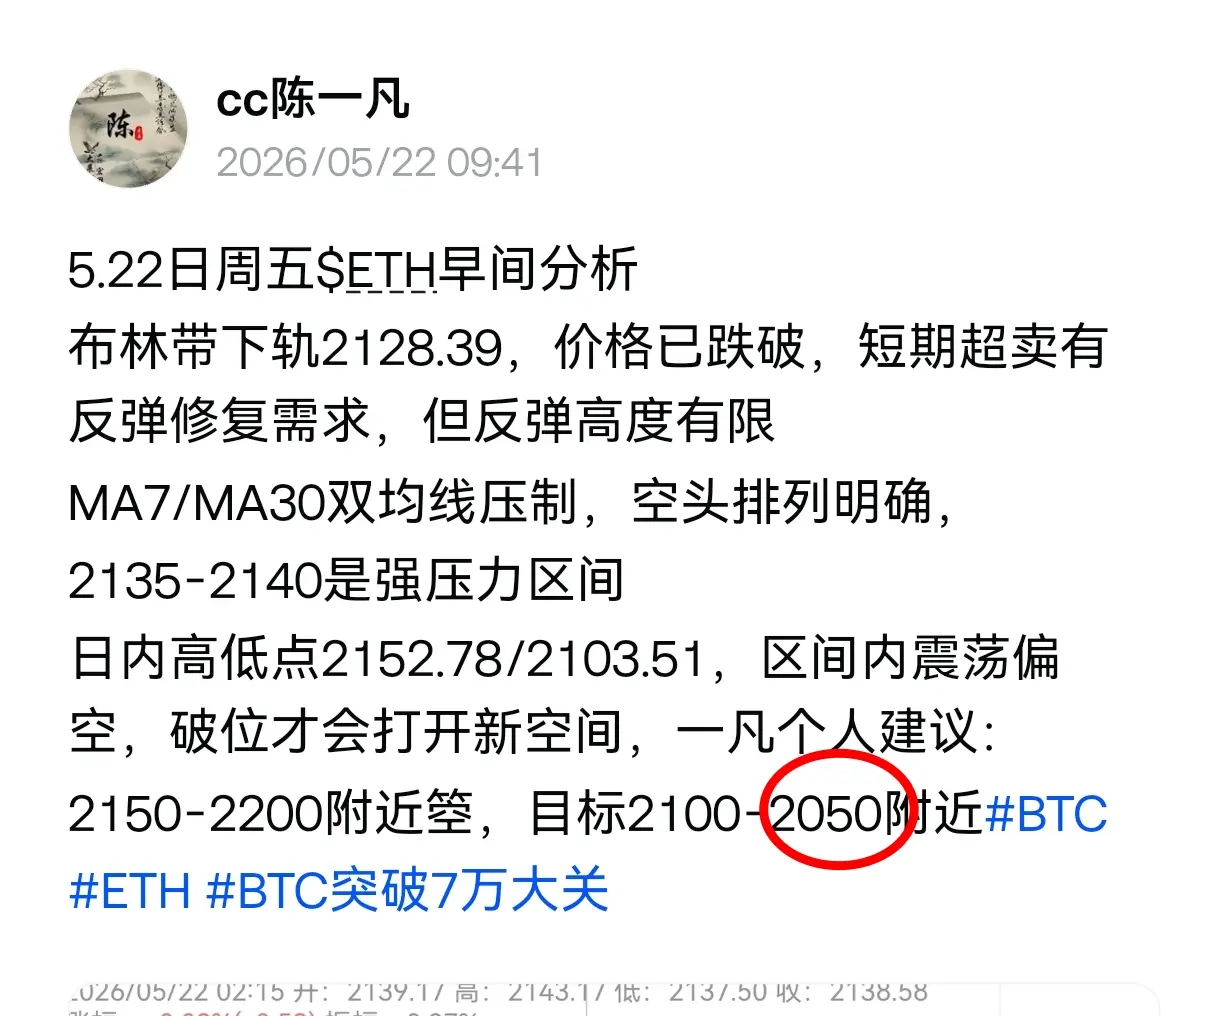
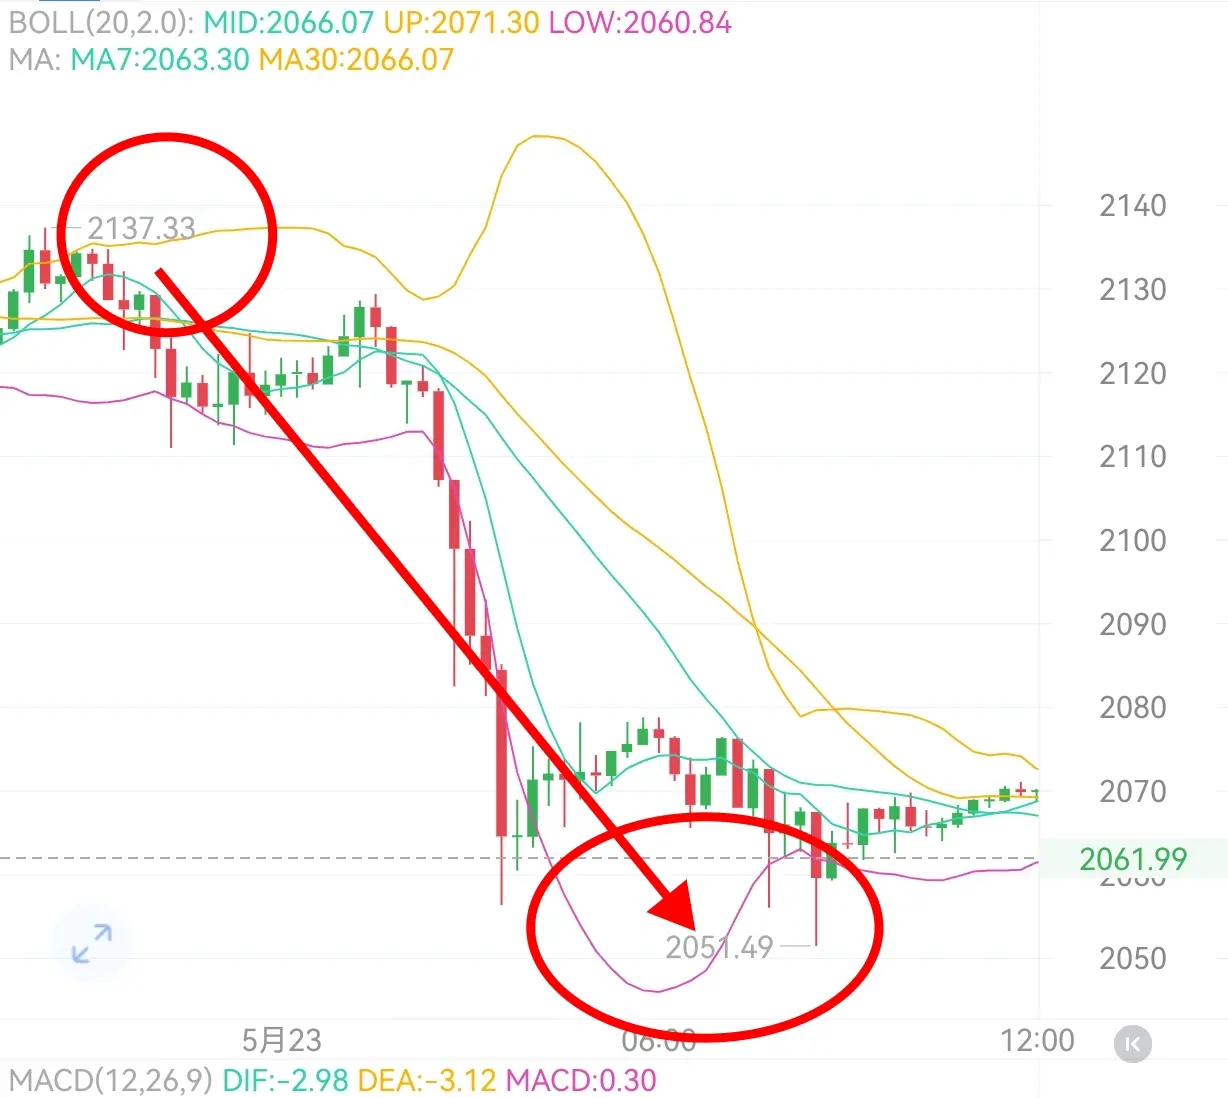
Happy weekend, everyone. Let’s take a look at the thinking and the “Dian Kun” levels I shared yesterday for Erbai. We’re aiming straight for 2050—directly reaching 2050. Many friends still doubt whether it can actually hit 2050. Friends who’ve followed Yifan know one thing: Yifan has always been pointing to exactly where to go—precise and spot-on, down to the point. Nearly a hundred Dian Kun levels.
Hesitating before was useless; many longtime fans missed out. If you’re still not following Yifan, follow Yifan now—so you won’t get lost. Daily real-time updates with valuable insights.
#BTC #ETH
BTC-0.62%
ETH-0.41%
HYPE-4.27%
View Original
post-image
post-image
  • Reward
  • 4
  • Repost
  • Share
GateUser-54e5ede0:
Eat meat with the teacher every day 😂
View More
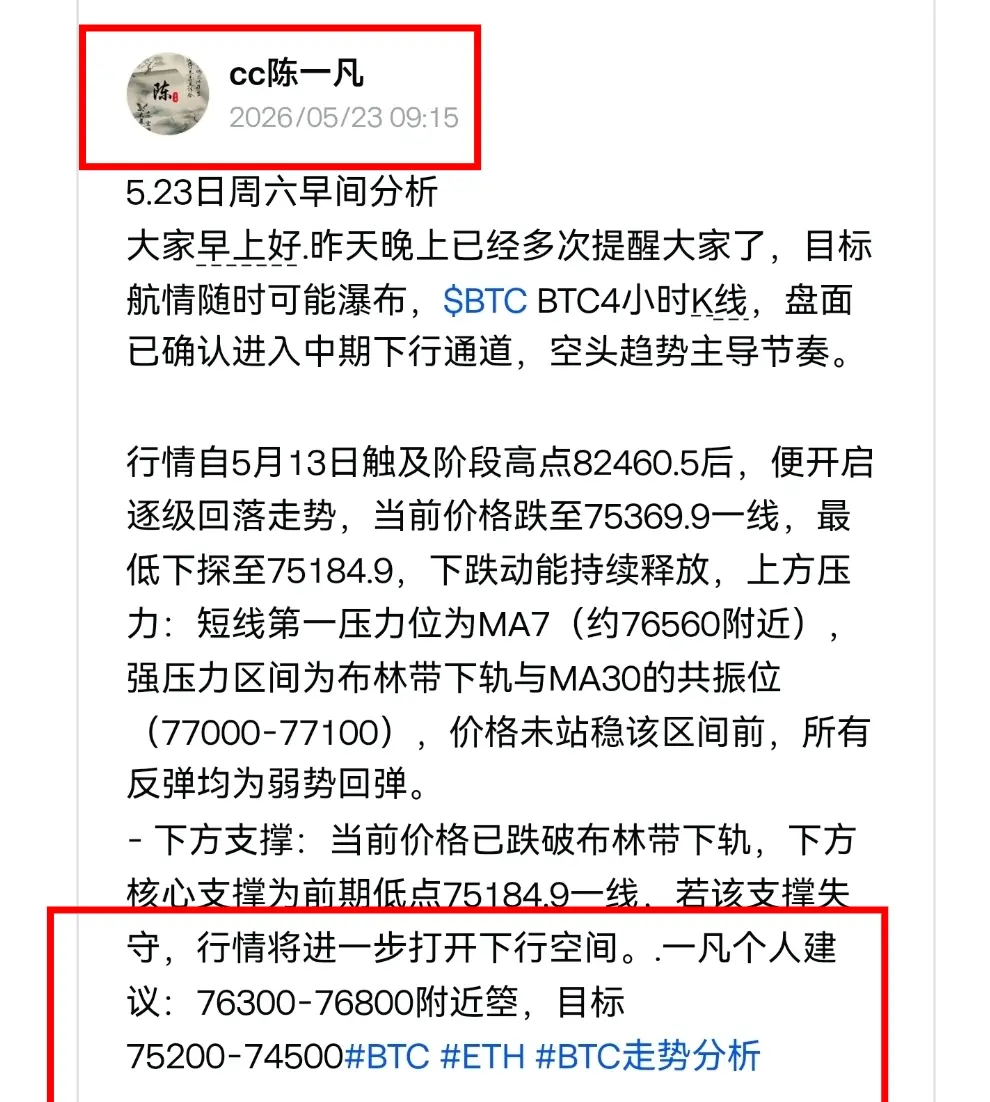
May 23rd Saturday Morning Analysis
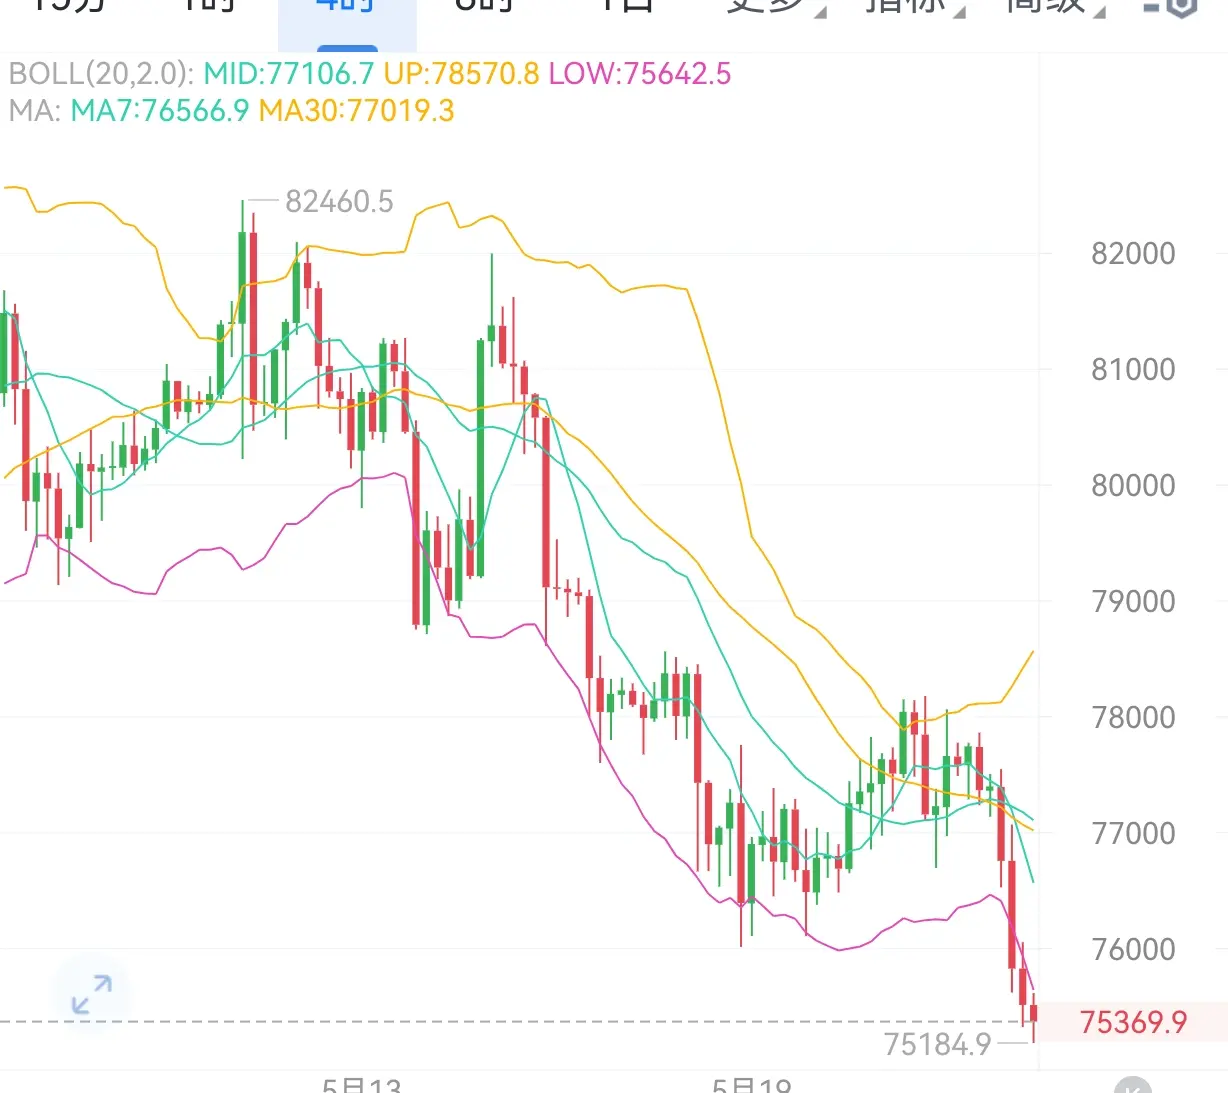
Good morning everyone. I have reminded everyone multiple times last night that the target market sentiment could plummet at any time. $BTC BTC 4-hour candlestick chart, the market has confirmed entry into a medium-term downtrend channel, with a bearish trend dominating the rhythm.
Since the market reached a high point of 82,460.5 on May 13th, it has begun a step-by-step decline. The current price has fallen to around 75,369.9, with a low of 75,184.9. The downward momentum continues to be released.
Upper resistance: the first short-term resistance level
BTC-0.62%
View Original
post-image
post-image
  • Reward
  • Comment
  • Repost
  • Share
Just took down over 1,000 Kongs, early, midday, and evening, I kept reminding everyone. Doing a rebound on Kongs is just Kongs, don't forget today is Friday, and there's also a market-moving news event. If the support level below isn't strong enough, it will just drop straight down in a waterfall, cash out and sleep. #BTC #ETH #BTC走势分析
BTC-0.61%
ETH-0.41%
View Original
post-image
post-image
  • Reward
  • Comment
  • Repost
  • Share
From the overall market trend perspective, the current bearish dominance has not undergone any substantial change. The slight rebound seen at this stage is essentially just a technical correction during the decline, not a sign of a trend reversal or strength. Adhering to the idea of "sell on rebounds" aligns with the current market rhythm. Be patient and wait for the market to weaken again and fall in a waterfall manner.
Looking at the recent price movement trajectory, the overall center of gravity has been gradually shifting downward. Each rebound rally lacks sufficient strong buying support,
BTC-0.61%
ETH-0.41%
View Original
post-image
post-image
  • Reward
  • Comment
  • Repost
  • Share
May 22 Evening Analysis
Will the new Federal Reserve Chair throw a wrench tonight? The secret to sudden wealth in historical patterns—stop only betting on rate cuts!
The market is all talking about a decisive moment tonight, but most people are still watching whether there will be a rate cut. However, the key signals that can truly change the trend have long been hidden in historical patterns; those who understand them are already quietly positioning.
Looking at the Bollinger Bands indicator, the price has just stabilized at the middle band, showing a short-term bullish trend. The upper
BTC-0.62%
ETH-0.41%
View Original
post-image
post-image
  • Reward
  • Comment
  • Repost
  • Share
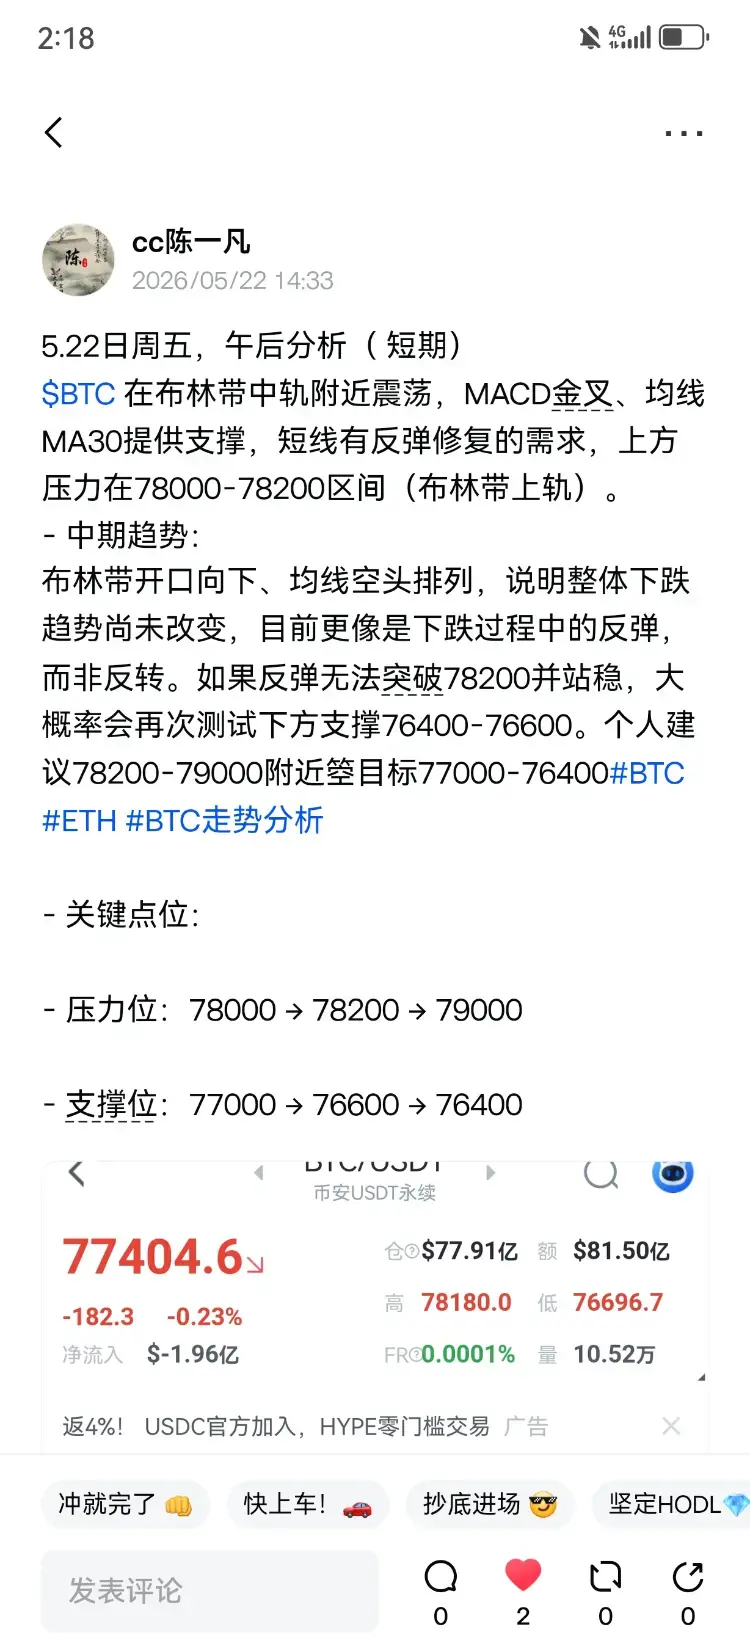
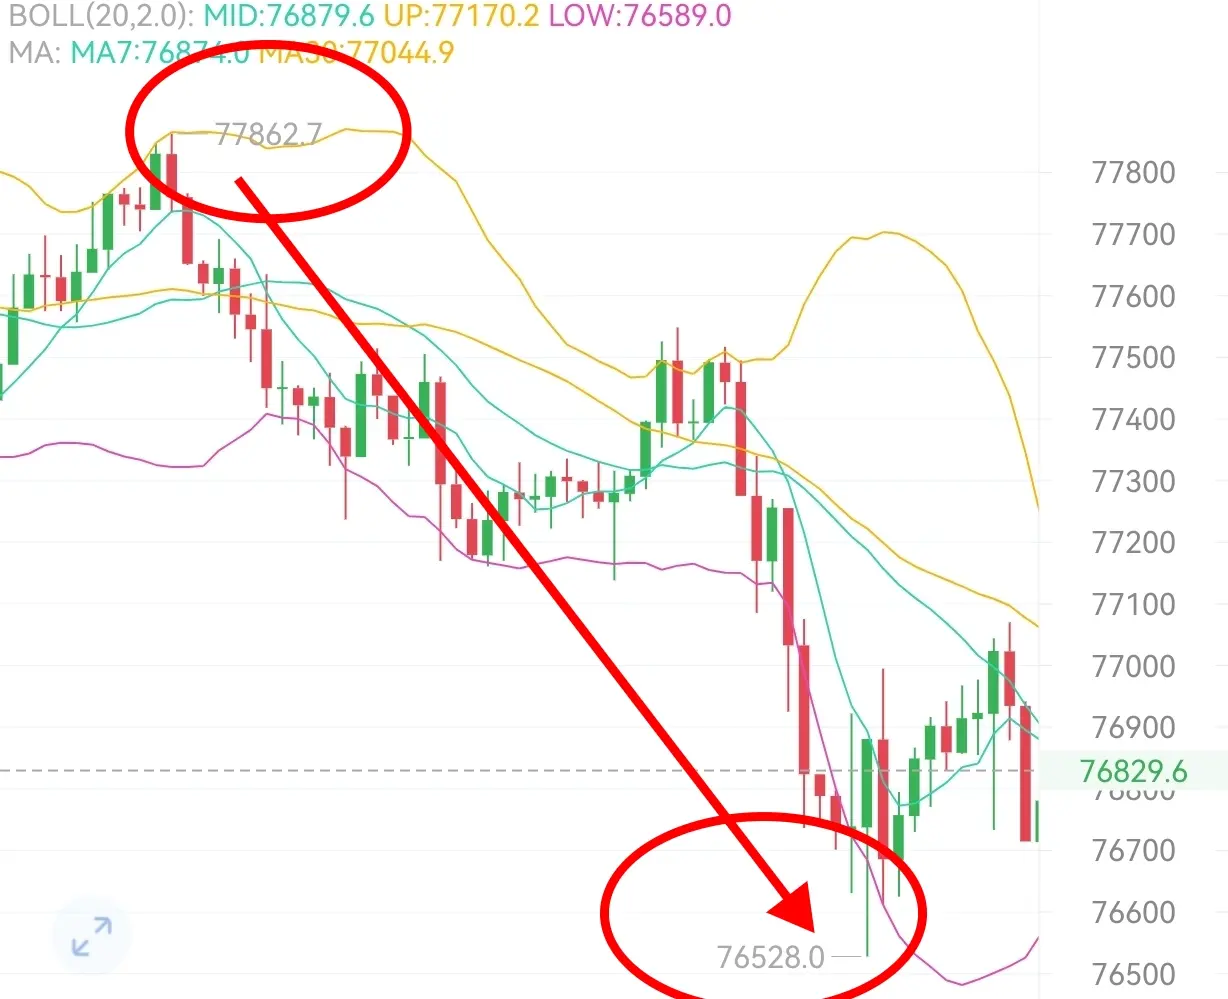
Friday, May 22nd, Afternoon Analysis (Short-term)
$BTC is oscillating near the middle band of the Bollinger Bands, MACD has a golden cross, and the MA30 moving average provides support. There is a short-term rebound and correction demand. Resistance above is in the 78,000-78,200 range (upper band of Bollinger Bands).
- Mid-term trend:
The Bollinger Bands are opening downward, and the moving averages are in a bearish alignment, indicating that the overall downtrend has not yet changed. Currently, it looks more like a rebound within a downtrend rather than a reversal. If the rebound cannot brea
BTC-0.62%
ETH-0.41%
View Original
post-image
  • Reward
  • Comment
  • Repost
  • Share
  • Pinned