#MyGateTradeStory Worldcoin представляє один із найзахоплюючих проектів у криптовалютній сфері, поєднуючи цифрову ідентифікацію з технологією блокчейн. Заснований Самом Алтманом із відомості OpenAI, WLD привернув значну увагу як роздрібних, так і інституційних трейдерів. Цей детальний аналіз охоплює все, що потрібно знати про торгівлю WLD за поточних рівнів близько 0,66.
Основи проекту та ринкова позиція
Worldcoin працює на перетині штучного інтелекту, цифрової ідентифікації та криптовалюти. Проект досяг значного масштабу з понад 30 мільйонами користувачів World App і приблизно 15 до 17,9 мільйонами підтверджених людей по всьому світу. Ця масова база користувачів надає WLD унікальну ціннісну пропозицію в криптоекосистемі. Токен отримує свою цінність із наративу доказу особистості, що стає необхідною інфраструктурою у майбутньому, домінованому штучним інтелектом. Однак інвестори повинні враховувати, що механізми прямої утиліти токена та монетизації залишаються в процесі розробки, тому WLD на цій стадії є переважно спекулятивним активом, зумовленим наративом.
Поточний стан ринку та цінова динаміка
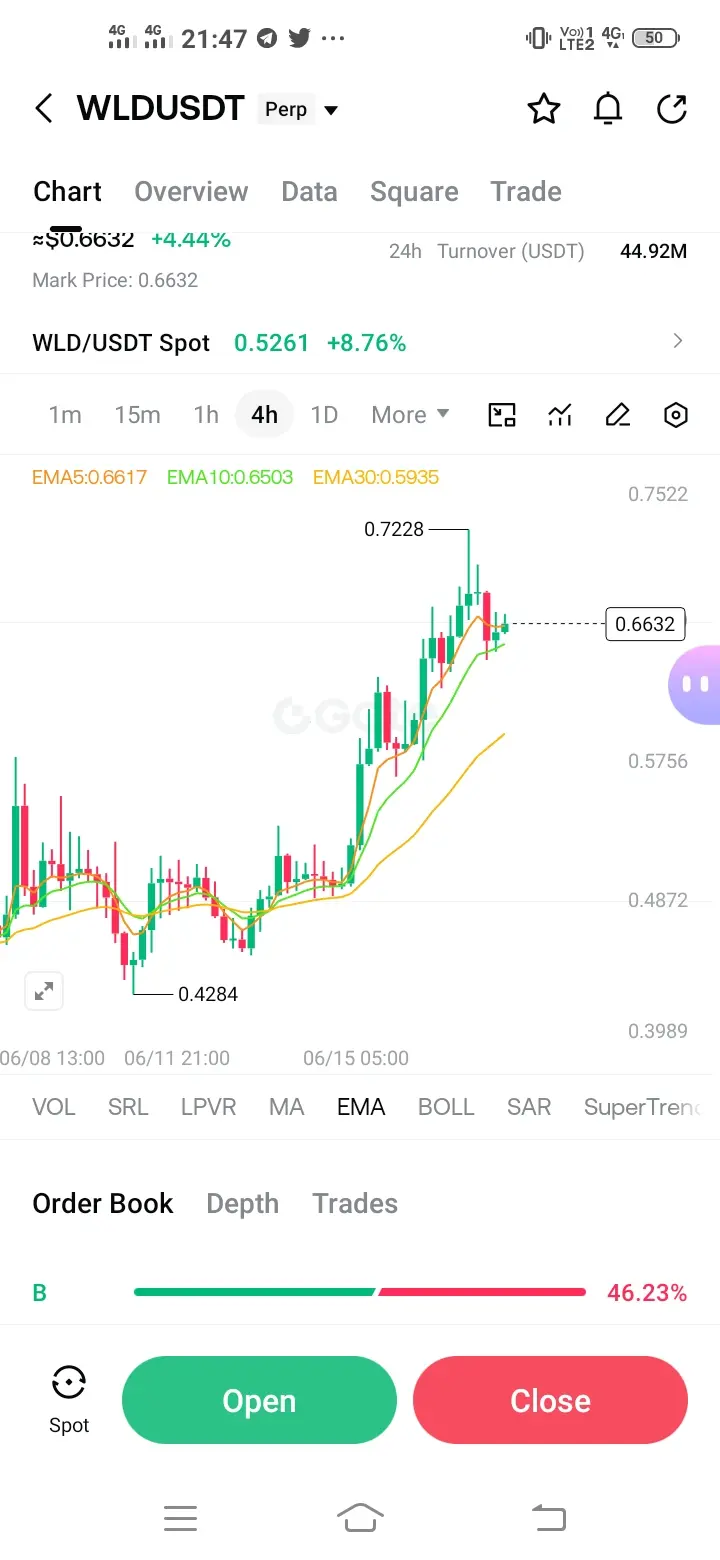
WLD наразі торгується приблизно за 0,66, що є значним відновленням від мінімумів близько 0,33, зафіксованих наприкінці травня 2026 року. Токен показав вражаючий приріст понад 70% за останні тижні, що зумовлено поєднанням накопичення великих гравців, зростанням активності мережі та ширшою зацікавленістю у секторі штучного інтелекту. Щоденний обсяг торгів склав близько 1,22 мільярда доларів, що свідчить про сильну ліквідність і активну участь учасників ринку. Відкритий інтерес у деривативних ринках піднявся понад 449 мільйонів доларів, що свідчить про значне використання кредитного плеча.
Аналіз підтримки та опору
Розуміння ключових рівнів цін є важливим для успішної торгівлі WLD. Негайна підтримка встановлена на рівнях 0,62–0,65, що відповідає нещодавньому зоні прориву, яка тепер перетворилася з опору на підтримку. Ця зона є критичною для підтримки бичачого імпульсу. Другорядна підтримка знаходиться на рівні 0,5677, що раніше виступало опором і тепер забезпечує захисний рівень для відкатів. Глибша підтримка може бути знайдена на рівні 0,55, де розташована 200-денна ковзна середня, і на рівні 0,504, що відповідає рівню відновлення за Фібоначчі 23,6%.
З боку опору, негайний опір знаходиться на рівні 0,6736, що відповідає максимуму 2026 року та значущому психологічному бар’єру. Вище цього рівня зона 0,70–0,75 представляє наступний великий кластер опору, де ймовірно посилиться фіксація прибутку. Рівень відновлення за Фібоначчі 38,2% розташований приблизно на 0,676, що додає конгруентності цій зоні опору. Подальші цілі зростання включають 0,80 і, зрештою, 0,85, хоча ці рівні вимагатимуть тривалого бичачого імпульсу та сприятливих умов ринку.
Аналіз ковзних середніх
Структура ковзних середніх для WLD стала дедалі більш бичачою. 50-денна ковзна середня наразі знаходиться приблизно на рівні 0,40, тоді як 200-денна — також біля 0,40. Це зближення вказує на період консолідації, який тепер розв’язується в бік зростання. 20-денна експоненціальна ковзна середня забезпечує динамічну підтримку біля поточних рівнів, тоді як 100-денна EMA розташована близько 0,35, пропонуючи глибший захист від значних корекцій.
Цінова дія вище за всі основні ковзні середні є бичачим сигналом, що свідчить про зміну тренду з медвежого на бичачий. Трейдери повинні стежити за перетином 50-денної MA вище за 200-денну MA, що підтвердить формування «золотої» перехрестя і потенційно викличе додатковий інтерес до купівлі від систематичних трейдерів.
Індикатори RSI та імпульсу
Індекс відносної сили для WLD наразі становить приблизно 66,3 за 14-періодною налаштуванням, що перебуває у нейтральній або трохи бичачій зоні. Це свідчить про те, що, хоча імпульс позитивний, токен ще не досяг стану перекупленості, що могло б передбачати неминучий відкат. RSI має ще потенціал для зростання до 70 або вище перед досягненням екстремальних рівнів.
Індикатор MACD демонструє бичачу кон’юнктуру з сигналовою лінією нижче за MACD-лінію, хоча гістограма вказує на обережність, оскільки імпульс може стабілізуватися. Стохастичний осцилятор підтверджує додаткову бичачу кон’юнктуру, з показниками, що свідчать про подальше зростання перед досягненням перекуплених рівнів.
Обсяг торгів та аналіз на блокчейні
Аналіз обсягу торгів виявляє сильний інституційний та великий інтерес до WLD. Транзакції великих гравців, що перевищують 100 000 доларів, досягли річних максимумів, що свідчить про накопичення позицій розумними грошима на поточних рівнях. Ця активність великих гравців часто передує значним рухам цін і повинна бути ретельно відслідковувана роздрібними трейдерами.
Активність мережі отримала поштовх від інтеграції Oku Trade у World App, що запровадила щотижневі нагороди до 100 WLD для користувачів, які беруть участь у обмінах токенів. Це створює органічний попит у екосистемі та підтримує стабільність цін.
Рівні відновлення за Фібоначчі
Застосування аналізу Фібоначчі до недавніх цінових рухів забезпечує додаткову точність для планування входу та виходу. Рівень відновлення 23,6% на 0,504 слугує негайною підтримкою, тоді як рівень 38,2% на 0,676 збігається з основним опором. Рівень 50% відновлення розташований приблизно на 0,50, а рівень 61,8% — біля 0,46. Ці рівні слід контролювати для потенційних можливостей відскоку під час корекційних фаз.
Стратегія спотової торгівлі для консервативних трейдерів
Для консервативних спотових трейдерів оптимальна стратегія входу полягає у чеканні відкатів до підтримки 0,62–0,65. Ця зона пропонує вигідне співвідношення ризику та нагороди з чітко визначеним стоп-лоссом нижче 0,60. Розмір позиції слід розраховувати так, щоб ризикувати не більше 2–3% від загальної вартості портфеля цим трейдом.
Цілі входу включають 0,63 для початкового масштабування, з додатковими покупками при 0,60, якщо ринок пропонує глибші знижки. Стоп-лосс слід розмістити на 0,58 для захисту капіталу у разі провалу тренду. Цілі фіксації прибутку — 0,70 для 50% позиції, 0,75 для 75% і рух із трейлінг-стопами для залишкової експозиції вище 0,75.
Агресивна стратегія спотової торгівлі
Агресивні трейдери можуть розглянути можливість входу за поточних рівнів близько 0,66, приймаючи вищий ризик для негайної експозиції потенційного зростання. Ця стратегія вимагає більш жорсткого управління стоп-лоссом на 0,62, щоб обмежити втрати. Розмір позиції має бути меншим, ніж у консервативної, через менш сприятливу ціну входу.
Ціль агресивної стратегії — швидке досягнення 0,70 для часткового фіксування прибутку, з рештою позиції, що прагне до 0,75–0,80. Ця стратегія найкраще працює у сильних трендових ринках і вимагає активного моніторингу позицій.
Стратегія довгих позицій
Довгі позиції переважають, поки WLD підтримує підтримку вище 0,62. Технічна картина підтримує використання кредитного плеча з відповідним управлінням ризиками. Точки входу для довгих позицій включають поточні рівні або будь-які зниження до 0,63–0,65.
Стоп-лосс для довгих позицій слід розмістити на 0,60, що відповідає прориву останньої структури прориву. Ціль 1 — 0,70, Ціль 2 — 0,75, і Ціль 3 — 0,80 для розширених рухів. Співвідношення ризику та нагороди для цієї стратегії приблизно 1:3, що робить її привабливою з точки зору ймовірності.
Стратегія коротких позицій
Короткі позиції слід розглядати лише у разі, якщо WLD не зможе утримати підтримку 0,62 на щоденному закритті. Вхід для шортів активується при підтвердженому прориві нижче 0,62 з цілями 0,58 і 0,55. Стоп-лосс для коротких позицій слід розмістити вище за 0,66.
З огляду на поточний бичачий імпульс і накопичення великих гравців, шортити WLD несе підвищений ризик і має виконуватися лише досвідченими трейдерами із суворим управлінням ризиками.
План свінг-торгівлі
Свінг-трейдери повинні зосередитися на діапазоні 0,60–0,75 на найближчі тижні. Входи біля мінімумів діапазону з виходами біля максимумів пропонують передбачувані можливості для прибутку. Стратегія полягає у купівлі зниження до 0,62–0,65 і продажу підвищень до 0,70–0,73, повторюючи цей цикл, доки діапазон зберігається.
Трейдери, що працюють на прорив, повинні готуватися до потенційного розширення вище 0,75, що може викликати швидкий рух до 0,85 або вище. Навпаки, прорив нижче 0,60 скасує бичачу структуру і вкаже на глибший відкат до 0,50.
Розгляд денної торгівлі
Денним трейдерам слід зосередитися на графіках 15-хвилинних і годинних для внутрішньоденних можливостей. Ключові рівні для спостереження — 0,65 як внутрішньоденна підтримка і 0,68 як негайний опір. Можливості скальпінгу існують у діапазоні 0,65–0,68 для швидких прибутків.
Аналіз профілю обсягу свідчить, що 0,66 є високоволатильним вузлом, де відбувається значна торгівля, що робить його точкою опори для внутрішньоденної орієнтації. Прорив вище 0,68 із підтримкою обсягу підтримує бичачий рух, тоді як відторгнення на цьому рівні свідчить про діапазонну торгівлю.
Рамки управління ризиками
Правильне управління ризиками є ключовим для успіху торгівлі WLD. Ніколи не ризикуйте більше 2–3% від капіталу на один трейд. Використовуйте стоп-лоси у кожній позиції без винятку. Розглядайте масштабування у позиції, а не входження з повним розміром одразу. Беріть часткові прибутки на рівнях опору, щоб зменшити ризик і зберегти потенціал зростання.
Розмір позиції має враховувати волатильність WLD, яка може сягати 10–20% щодня. Менші розміри позицій є доцільними для цього високоволатильного активу. Завжди тримайте резерви готівки для додавання до виграшних позицій або зниження середньої ціни при високій впевненості.
Настрій ринку та каталізатори
Цінова динаміка WLD значною мірою залежить від настроїв у секторі AI та новин, пов’язаних з OpenAI і Самом Алтманом. Позитивні події у впровадженні AI зазвичай сприяють WLD через його зв’язок із наративом AI. Регуляторні зміни щодо цифрової ідентифікації також впливають на цінову динаміку, сприятливі регуляції підтримують зростання, а обмежувальні політики створюють перешкоди.
Майбутні каталізатори включають потенційні листинги на біржах, оновлення протоколу та оголошення партнерств. Трейдерам слід стежити за офіційними каналами Worldcoin і новинами криптоіндустрії для розвитку подій, що можуть вплинути на ціну.
Довгостроковий прогноз цін
Аналітики прогнозують, що WLD може досягти максимуму 0,6736 у 2026 році, із середніми цінами близько 0,5427. Далі, за прогнозами, ціни можуть коливатися між 1,81 і 2,17 до 2029 року за умови значного зростання adoption і попиту на ринку. До 2032 року деякі прогнози передбачають, що WLD може піднятися до максимуму 3,57, хоча ці довгострокові прогнози мають значну невизначеність.
Звичайні помилки у торгівлі, яких слід уникати
Уникайте гонитви за цінами після великих зелених свічок, оскільки вони часто позначають локальні вершини. Не знижуйте середню ціну на програшних позиціях без чіткої технічної причини. Ніколи не торгуйте без стоп-лосів, особливо у волатильних альткоінах, таких як WLD. Уникайте надмірного використання кредитного плеча, оскільки волатильність WLD може швидко ліквідувати позиції. Не ігноруйте ширший контекст ринку, оскільки напрям Bitcoin суттєво впливає на поведінку альткоінів.
Резюме для активних трейдерів
WLD за 0,66 пропонує бичачу можливість для торгівлі з чітко визначеними ризиками. Ключовий рівень для спостереження — підтримка 0,62–0,65, яка має триматися, щоб зберегти бичачу структуру. Входи при зниженнях до цієї зони пропонують найкращі співвідношення ризику та нагороди, із стоп-лоссами нижче 0,60 для захисту від провалу тренду. Цілі зростання — 0,70, 0,75 і потенційно 0,80 для підтримки імпульсу.