#IranUSConflictEscalates
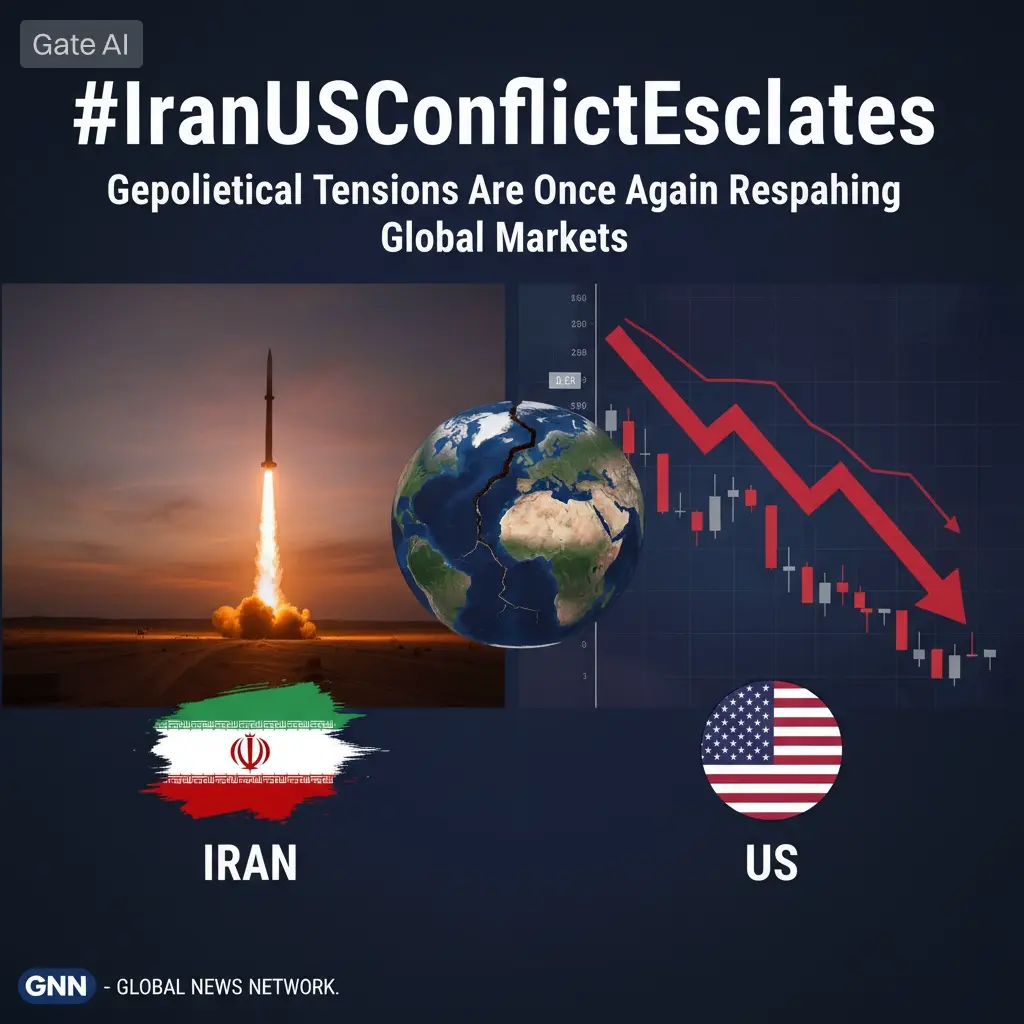
L'escalade du conflit entre l'Iran et les États-Unis a provoqué des ondes de choc sur les marchés financiers mondiaux, créant une incertitude accrue pour les investisseurs en cryptomonnaies et les négociants de matières premières. La situation s'est considérablement détériorée ces derniers jours, le Corps des gardiens de la révolution islamique d'Iran revendiquant la responsabilité d'attaques coordonnées de missiles et de drones visant des positions militaires américaines au Koweït et à Bahreïn. Cette évolution survient malgré les pourparlers de paix antérieurs et les discussions sur un éventuel accord de paix, démontrant à quelle vitesse les tensions géopolitiques peuvent dégénérer.
Le marché des cryptomonnaies a été particulièrement sensible à ces développements. Le Bitcoin, qui était passé de 58 000 à 66 000 pendant la brève période d'optimisme entourant les négociations de paix, est maintenant retombé à environ 59 950 à mesure que le conflit s'intensifie. Cette évolution des prix reflète le sentiment classique d'aversion au risque qui accompagne généralement les crises géopolitiques, les investisseurs se tournant vers des actifs plus sûrs. Plus d'un milliard de dollars de positions en cryptomonnaies ont été liquidés en une seule période de 24 heures alors que le Bitcoin est tombé à environ 59 175, marquant une baisse substantielle par rapport à son sommet de 126 000 en octobre 2025. La fourchette de 59 000 à 60 000 est désormais considérée comme un support critique, les analystes avertissant d'un risque de corrections plus profondes si ce niveau ne tient pas.
L'Ethereum se négocie actuellement autour de 1 570, tandis que Solana se situe à environ 70, et Dogecoin se négocie près de 0,072. Ces altcoins ont également subi des pressions alors que le marché plus large des cryptomonnaies est confronté à la fois à l'incertitude géopolitique et à d'autres facteurs négatifs, notamment les sorties d'ETF et les ventes importantes de Bitcoin par les détenteurs institutionnels. Le marché intègre désormais une probabilité réduite que le Bitcoin atteigne les objectifs élevés précédents comme 90 000 à court terme, la probabilité d'atteindre ces niveaux tombant à environ 18,9 % pour juin 2026.
L'or, traditionnellement une valeur refuge en temps de crise, affiche des performances mitigées avec des prix autour de 4 065. Bien que l'on s'attende à ce que l'or monte en flèche lors de tels troubles géopolitiques, le métal fait face à des vents contraires provenant de diverses dynamiques de marché. La situation actuelle représente une interaction complexe entre la demande traditionnelle de valeurs refuges et des préoccupations économiques plus larges.
Le marché pétrolier a connu une volatilité dramatique en réponse au conflit. Le pétrole brut Brent a atteint des sommets proches de 120 dollars le baril au plus fort des tensions lorsque le détroit d'Ormuz était effectivement bloqué, mais a depuis considérablement reculé. Les prix actuels sont tombés en dessous de 75 dollars pour le Brent et en dessous de 70 dollars pour le brut WTI alors que le trafic de pétroliers à travers le détroit d'Ormuz a repris suite à un accord entre les États-Unis et l'Iran pour rouvrir cette voie maritime vitale. Cependant, le risque d'une nouvelle escalade reste important. Goldman Sachs Research estime que si le détroit d'Ormuz devait se fermer à nouveau, les prix du pétrole pourraient bondir de 1 à 15 dollars le baril selon la durée et l'ampleur de la perturbation. Le détroit gère environ un cinquième des approvisionnements mondiaux en pétrole et en gaz naturel liquéfié, ce qui en fait l'un des points de passage les plus critiques du système énergétique mondial.
La probabilité d'un accord nucléaire complet entre l'Iran et les États-Unis d'ici août 2026 est tombée à seulement 20,5 % selon les marchés de prédiction, tandis que la probabilité d'un accord d'ici le 30 juin 2026 a chuté à un simple 0,1 %. Ces cotes reflètent le scepticisme du marché quant à une résolution diplomatique compte tenu de l'escalade militaire récente. Les Gardiens de la révolution ont explicitement menacé de résilier tout accord existant en raison de violations présumées du cessez-le-feu par les États-Unis, compliquant davantage le paysage diplomatique.
La situation économique mondiale ajoute une autre couche de préoccupation pour les investisseurs. J.P. Morgan attribue actuellement une probabilité de 40 % de récession pour l'économie américaine et mondiale d'ici la fin 2025, tandis que Morgan Stanley prévoit une croissance mondiale ralentissant à 2,9 % par an à mesure que les droits de douane américains plus élevés freinent la demande mondiale. La combinaison de l'instabilité géopolitique, des tensions commerciales et de l'incertitude de la politique monétaire crée un environnement difficile pour les actifs risqués, y compris les cryptomonnaies.
Les grandes entreprises ressentent déjà l'impact du conflit iranien. Le groupe BMW a émis un avertissement sur ses bénéfices et a annoncé son intention de réduire ses effectifs mondiaux jusqu'à 5 % d'ici la fin 2026, citant l'affaiblissement des ventes en Chine et l'impact économique plus large du conflit au Moyen-Orient. Cela démontre comment les conflits régionaux peuvent avoir des conséquences considérables sur les chaînes d'approvisionnement mondiales et la rentabilité des entreprises.
Pour les investisseurs en cryptomonnaies, l'environnement actuel nécessite une gestion prudente des risques. Les données historiques suggèrent que le Bitcoin et les altcoins subissent généralement des krachs éclairs immédiats de 5 à 15 % lorsque des frappes militaires majeures ou des déclarations de guerre surviennent. Cependant, le Bitcoin a également montré une résilience en tant que couverture potentielle contre la dévaluation monétaire et le risque souverain sur des périodes plus longues. Les investisseurs devraient surveiller plusieurs indicateurs clés dans les semaines à venir, notamment les données continues sur les entrées d'ETF, l'activité des portefeuilles baleines, les trajectoires des prix de l'énergie et toute nouvelle escalade dans la perturbation opérationnelle d'Ormuz.
Les prévisions des prix du pétrole restent fortement dépendantes de l'évolution du conflit. Si les efforts diplomatiques échouent et que l'escalade militaire reprend, en particulier autour du détroit d'Ormuz, les prix du pétrole pourraient rapidement remonter vers 100 dollars ou plus. À l'inverse, si la paix fragile actuelle tient et que les voies maritimes restent ouvertes, les prix pourraient se stabiliser dans une fourchette de 70 à 80 dollars pour le pétrole brut Brent. L'Agence internationale de l'énergie a estimé qu'environ 4,2 millions de barils par jour de pétrole transitant par le détroit d'Ormuz pourraient être redirigés en utilisant les capacités de pipelines de rechange existantes, mais cela laisserait encore environ 16 millions de barils par jour exposés au risque d'une fermeture complète.
En conclusion, le conflit entre l'Iran et les États-Unis représente une source importante d'incertitude pour les marchés mondiaux. Les investisseurs en cryptomonnaies doivent se préparer à une volatilité continue, avec le support critique du Bitcoin au niveau de 59 000 à 60 000 qui est testé. Les prix du pétrole restent vulnérables aux craintes de perturbations de l'offre, tandis que l'économie mondiale plus large fait face à des vents contraires liés aux tensions commerciales et aux risques de récession. Les semaines à venir seront cruciales pour déterminer si les voies diplomatiques peuvent empêcher une nouvelle escalade militaire ou si les marchés doivent intégrer le risque d'un conflit régional plus large avec des conséquences économiques potentiellement graves.
@Gate_Square #IranUSConflictEscalates