Summary
-
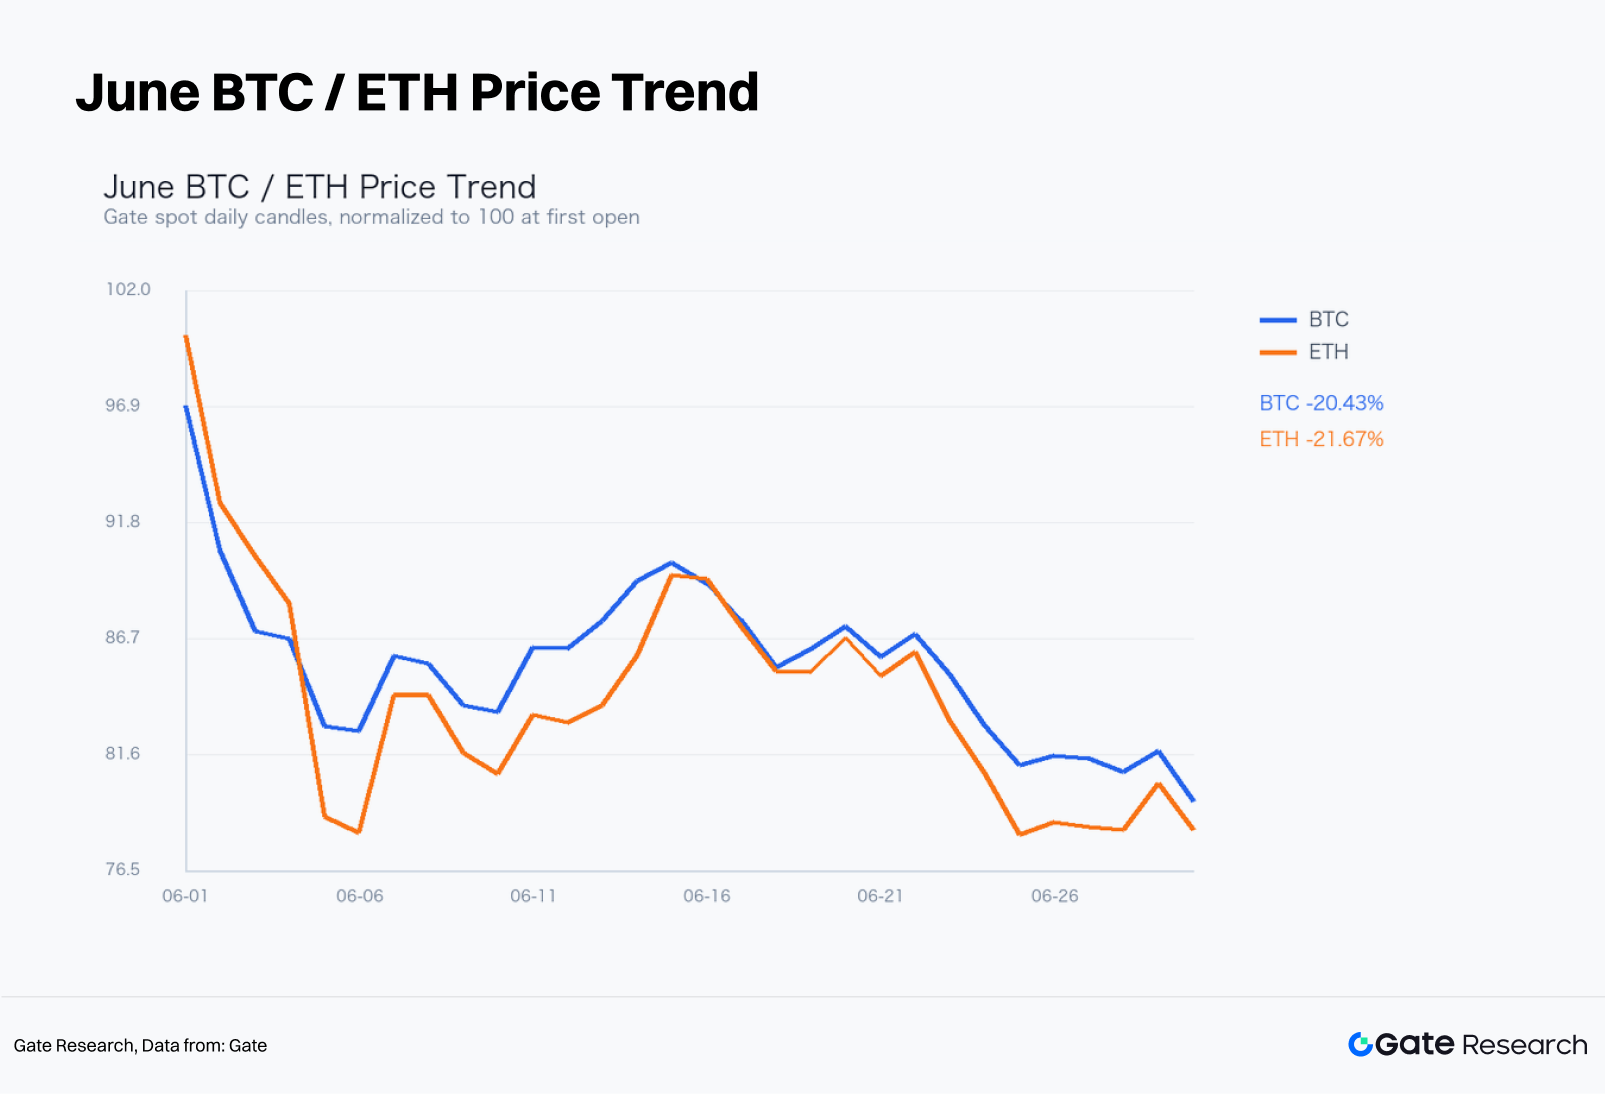
In June, BTC and ETH declined 20.43% and 21.67%, respectively. The cryptocurrency market remained under pressure, with the overall price level continuing to trend lower, while ETH continued to underperform BTC.
-
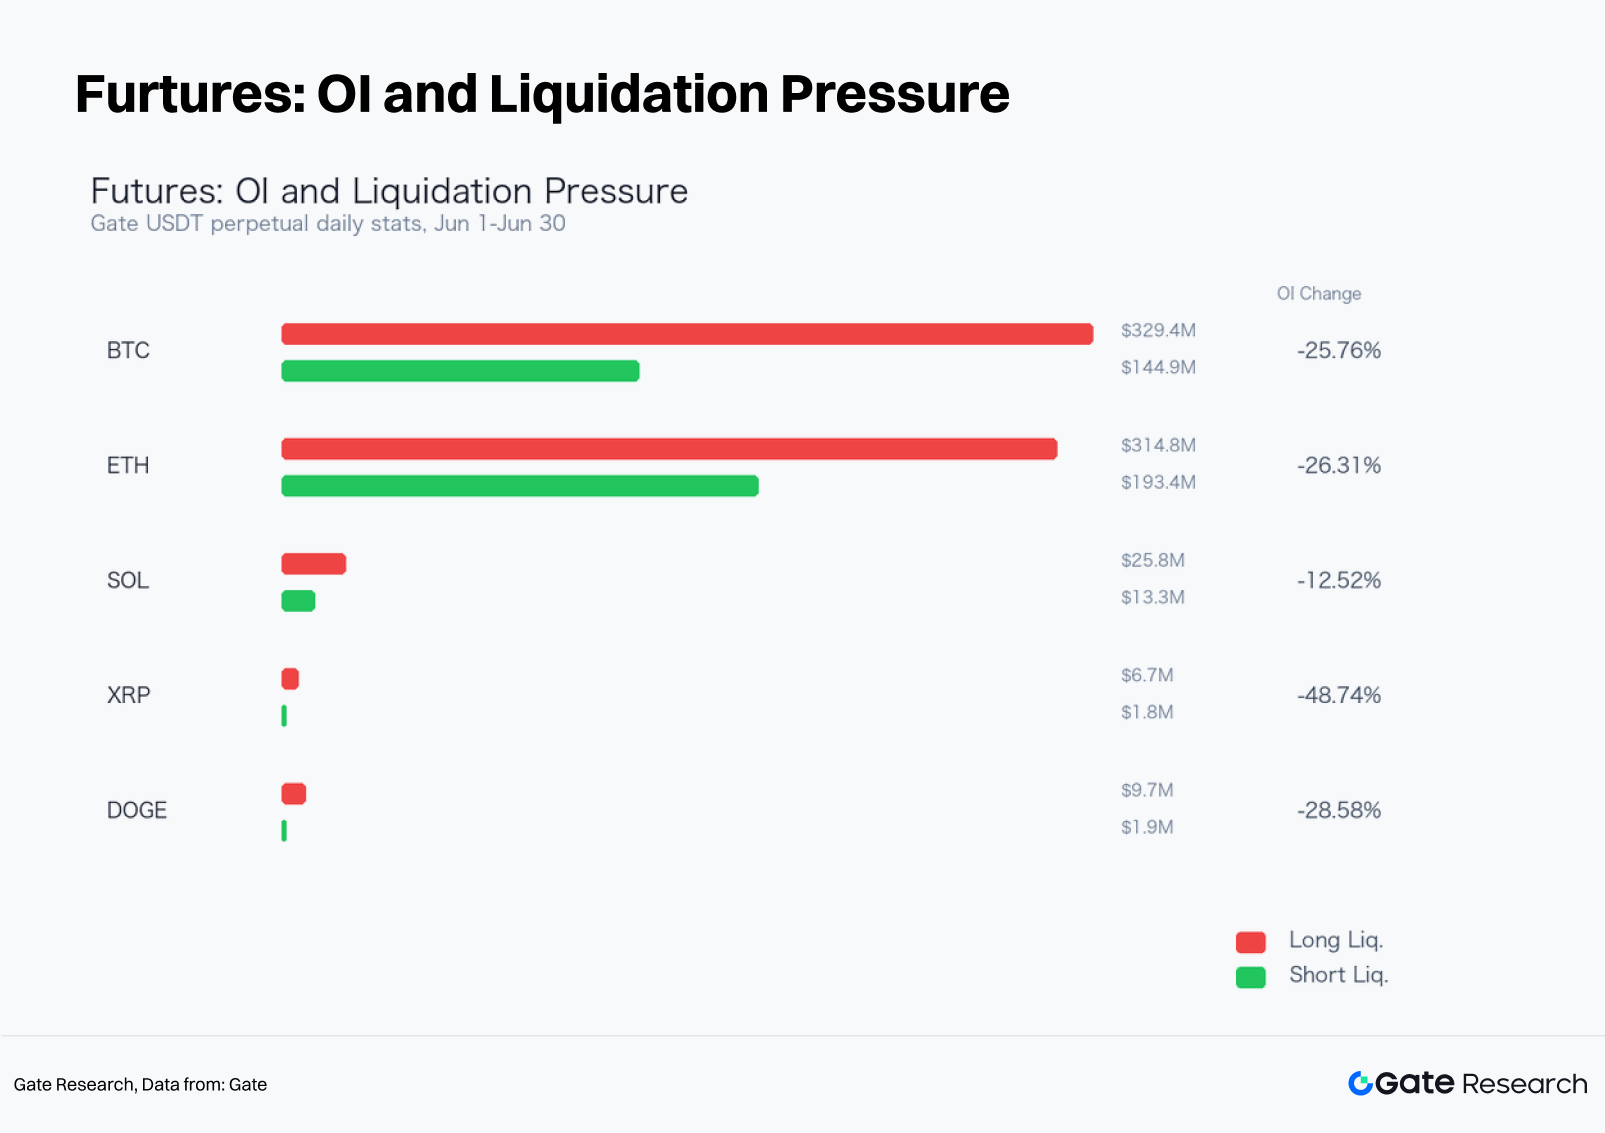
The derivatives market remained in a deleveraging phase, with open interest in BTC and ETH perpetual contracts declining by 25.76% and 26.31%, respectively. Long liquidations significantly exceeded short liquidations, while funding rates remained broadly neutral, indicating that the market decline was primarily driven by spot selling pressure alongside weakening risk appetite.
-
Market conditions in June were favorable for trend-following and breakout confirmation strategies. Parameter backtesting showed that the Dense Moving Average Breakout Strategy outperformed a buy-and-hold approach overall and was better suited for capturing directional market moves.
-
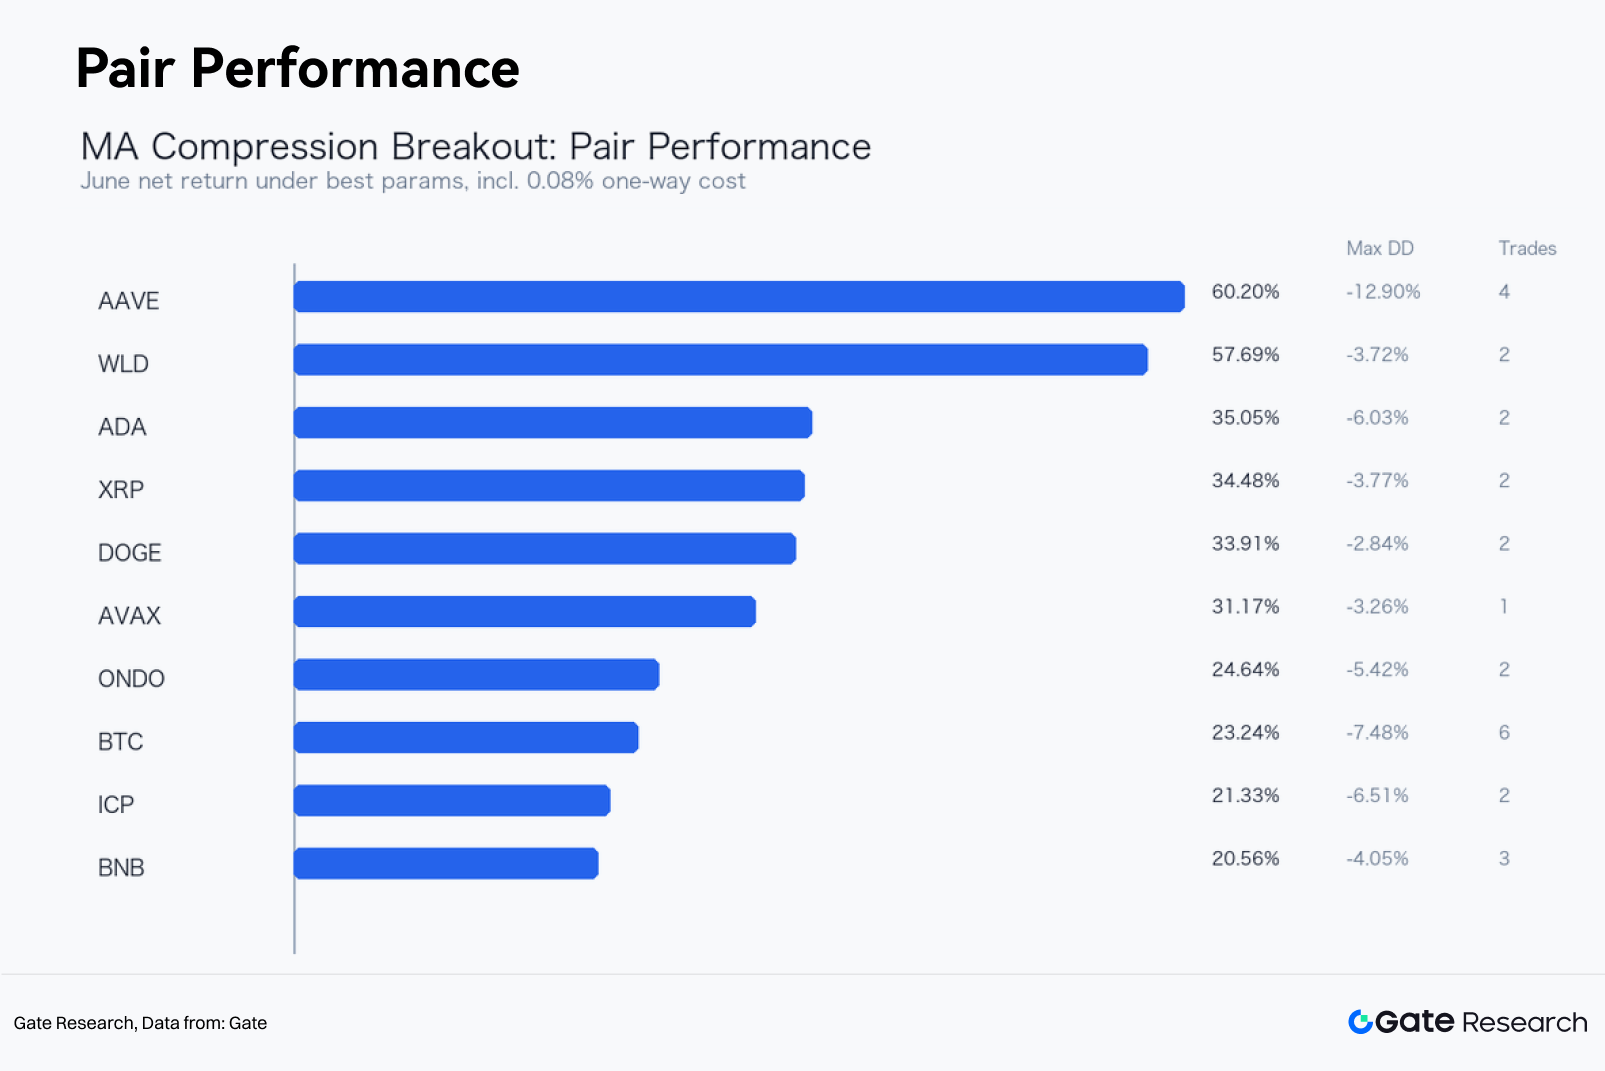
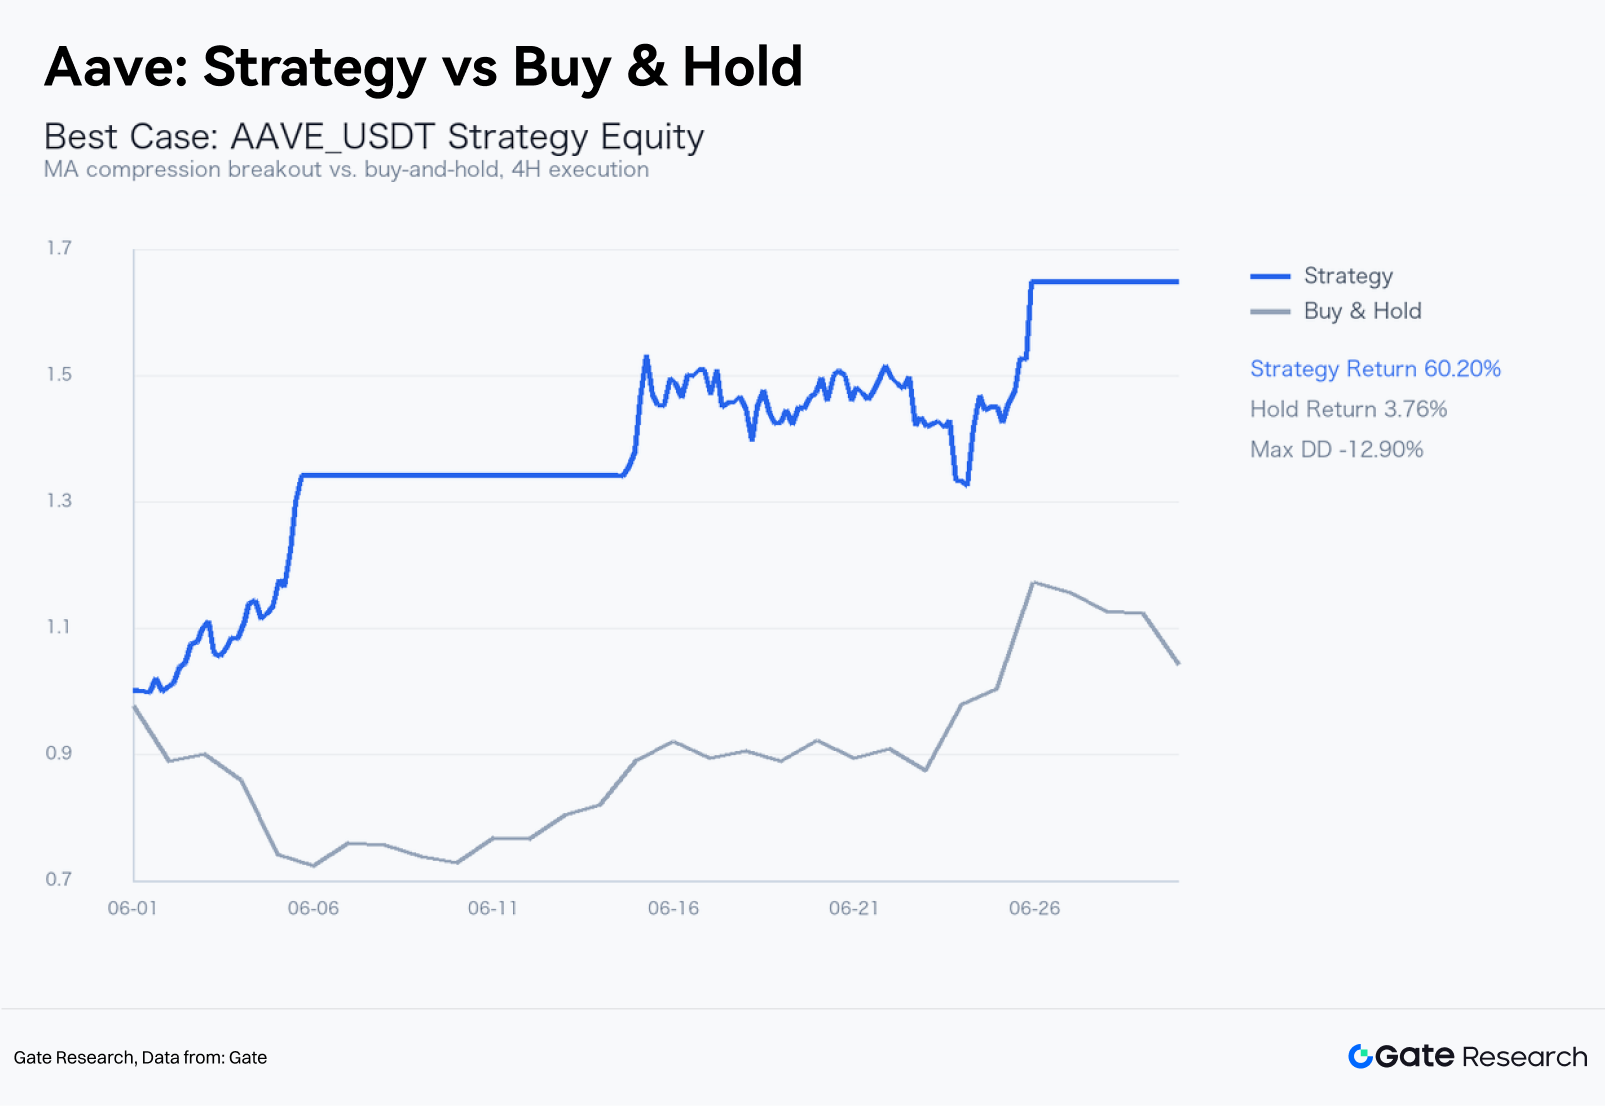
Based on net return, maximum drawdown, and trade frequency, AAVE USDT was the best-performing case study in June. The strategy delivered a net return of 60.2%, compared with a buy-and-hold return of 3.76%, while limiting maximum drawdown to 12.9%.
-
In July, the Dense Moving Average Breakout Strategy remains worth tracking. Combining volume confirmation with BTC trend filtering can improve signal quality and reduce the risk of false breakouts caused by counter-trend trading.
In June 2026, major crypto assets remained under pressure, with weakness persisting and spreading across the market. BTC opened the month at $73,684.1 and closed at $58,632.4, posting a monthly return of -20.43%. During the month, it reached a high of $74,090.8 and a low of $58,106.9, with a price range of 27.51%. ETH recorded a monthly return of -21.67% over the same period, with a maximum drawdown of -21.88%. From a structural perspective, BTC fell sharply in early June before entering a low-level recovery phase. However, the mid-month rebound failed to re-establish upward momentum, and prices retreated again toward the end of the month. ETH exhibited even greater relative weakness, with limited price elasticity and increased pressure amid tightening liquidity conditions.
Data from the derivatives market shows that open interest in major perpetual contracts failed to recover in a sustained manner. The notional open interest of BTC USDT perpetual contracts declined from $5.19B to $3.85B, representing a monthly decrease of 25.76%, while ETH recorded a monthly decline of 26.31% in notional open interest. In terms of liquidation structure, long liquidations significantly exceeded short liquidations, indicating that forced long deleveraging remained the dominant force during the market decline. Funding rates stayed slightly positive or near neutral for most of the month, suggesting that the price decline was driven not by excessive short positioning but by the combined impact of spot selling pressure and weakening risk appetite.
From a quantitative strategy perspective, June was well suited to trend-following and breakout confirmation strategies. This report conducts a parameter grid backtest on 29 valid USDT spot trading pairs listed on Gate using 4-hour candlestick data. The screening criteria include: monthly Gate spot trading volume above $50 million, at least two trades during the month, a maximum strategy drawdown below 20%, and a one-way transaction cost plus slippage assumption of 0.08%. Based on net return, maximum drawdown, and trade frequency, the best-performing strategy in June was the AAVE USDT Dense Moving Average Breakout Strategy, which generated a monthly net return of 60.2%, compared with a buy-and-hold return of 3.76%, with a maximum drawdown of -12.9%, four completed trades, a 75% win rate, and a profit factor of 9.63.
1. Market Overview
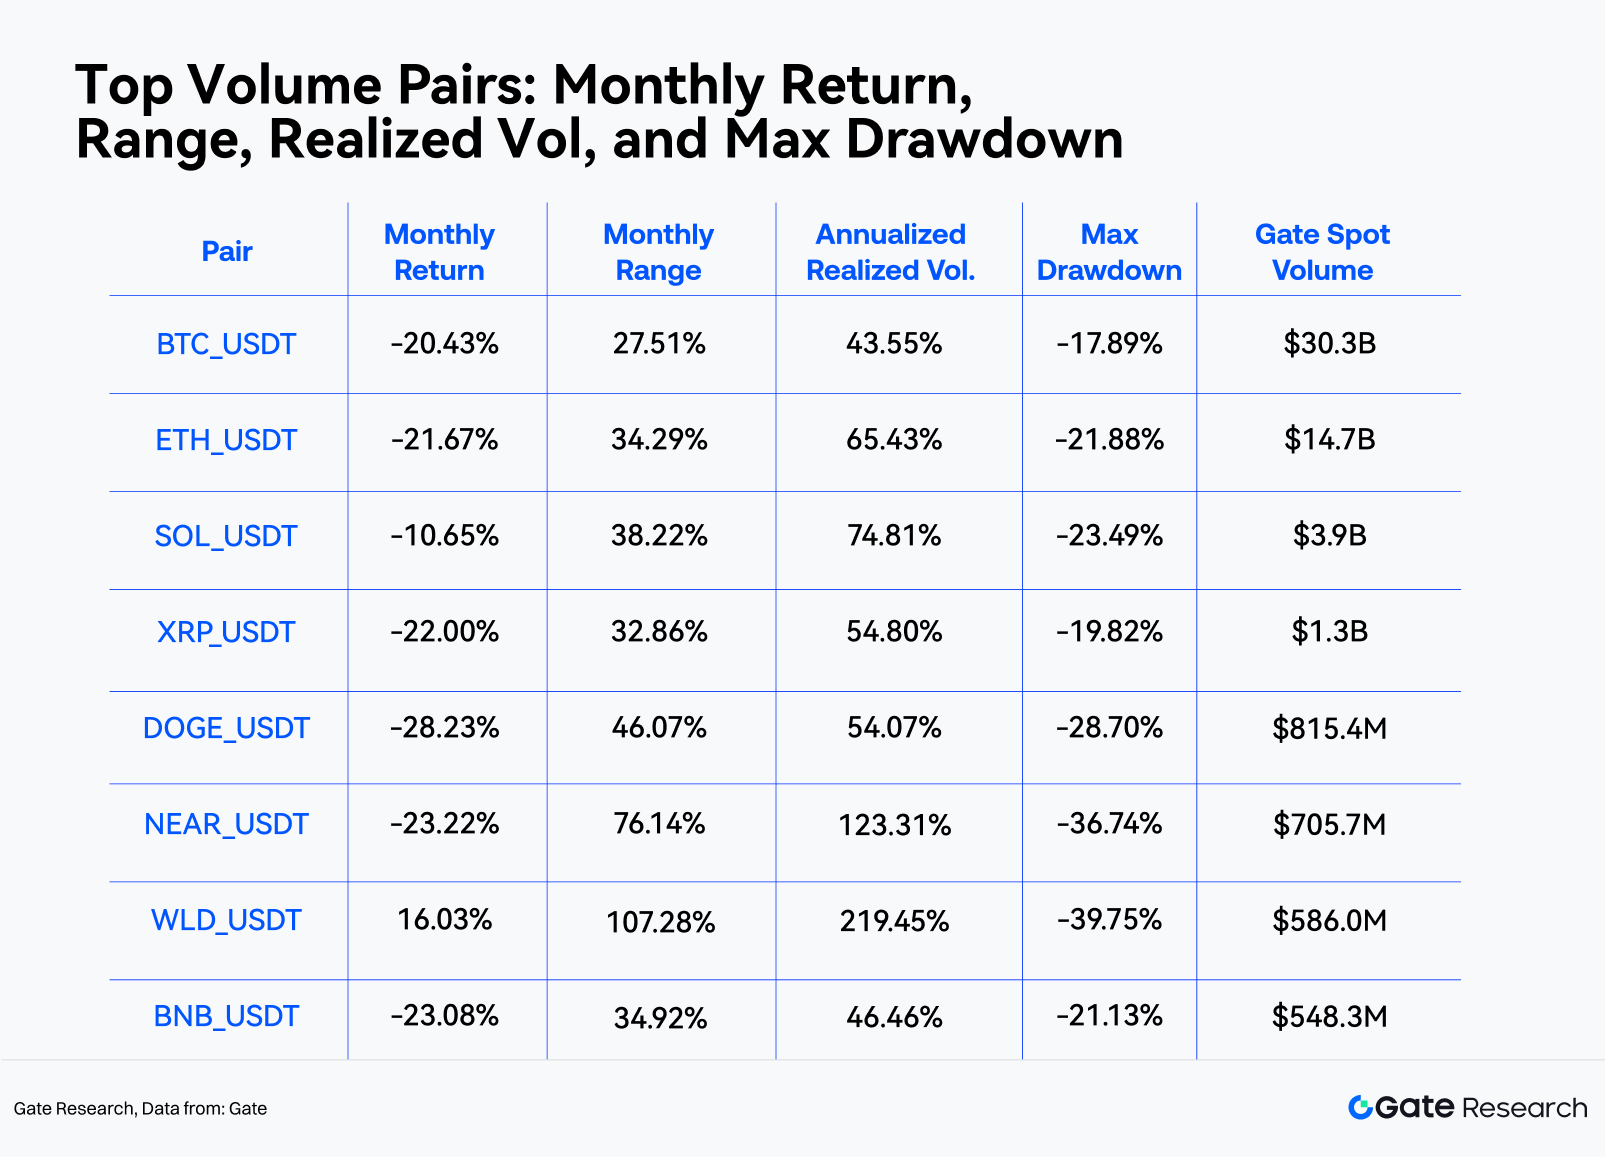
The defining characteristics of the June market were a continued downward shift in the overall price range, limited sustainability of rebounds, and trading activity becoming increasingly concentrated in BTC and a handful of large-cap assets. BTC and ETH remained the primary market benchmarks. BTC recorded a monthly price range of 27.51%, with an annualized realized volatility of approximately 43.55%, while ETH posted a monthly price range of 34.29% and an annualized realized volatility of approximately 65.43%. When major assets experience significant drawdowns simultaneously, cross-asset diversification provides limited short-term downside protection, making strict position management and disciplined exit rules essential from a strategy perspective.
In terms of trading volume, the highest Gate spot trading volumes in June were concentrated in highly liquid assets such as BTC, ETH, SOL, XRP, and DOGE. High trading volume has two important implications. First, backtest signals are more representative of executable real-market conditions. Second, during periods of heightened volatility, rising trading volume is typically accompanied by both forced stop-loss selling and active portfolio rebalancing, creating conditions that are more favorable for trend-following strategies to capture sustained directional price moves.
2. BTC and ETH Structure Analysis
BTC's price action in June can be divided into three phases. The first phase, from June 1 to June 6, saw a sharp decline from the beginning-of-month range, with consecutive daily losses accompanied by a surge in long liquidations in the futures market. The second phase, from June 7 to June 18, was characterized by a recovery within the lower trading range. Although the rebound triggered some short covering, BTC never managed to reclaim its early-June highs. During the third phase, in late June, BTC broke below the support established in mid-June and closed the month near its lows, indicating that market participants continued to reduce risk exposure.
ETH underperformed BTC. ETH posted a monthly return of -21.67% in June, 1.25 percentage points weaker than BTC. During weak market conditions, ETH typically requires additional support from on-chain activity, ecosystem capital inflows, or improving risk appetite. This month, however, these factors were insufficient to offset macroeconomic headwinds and the impact of market deleveraging. From a strategic perspective, ETH is better viewed as a barometer of market risk rather than a standalone offensive asset. When ETH fails to outperform BTC, the beta exposure of altcoin portfolios should be reduced.
The relationship between trading volume and volatility is also worth monitoring. BTC trading volume increased significantly during both the initial sell-off and the late-month decline, suggesting that the price weakness was not merely the result of thin liquidity but was supported by genuine market turnover. If BTC later re-enters a low-volatility consolidation phase, the Moving Average Compression Breakout strategy will wait for the moving average band to converge before determining the breakout direction. If prices continue to follow a downward trend channel, short-term trend-following models may continue to outperform mean-reversion strategies.
3. Futures Market: Open Interest, Liquidations, and Funding Rates
The futures market data delivered a broadly consistent signal: the market remained in a phase of passive deleveraging following the decline. Total long liquidations reached $329.4M for BTC, compared with $144.9M in short liquidations. For ETH, total long liquidations amounted to $314.8M, versus $193.4M in short liquidations. The significantly higher share of long liquidations indicates that leveraged long positions were forced to exit as prices declined, amplifying negative market sentiment and transmitting pressure to the spot market.
Funding rates never reached extreme negative levels, indicating that the market was not experiencing an overcrowded short positioning. For most of the month, funding rates remained close to neutral or slightly positive, suggesting that some market participants were still attempting to buy the dip or maintain long positions despite weakening prices. A short-term rebound is more likely when funding rates turn sharply negative while prices stop making new lows. Such a strong reflexive setup did not emerge during June.
An account long/short ratio above 1 should not automatically be interpreted as a bullish signal. In a weak market, a rising long/short ratio may simply reflect retail traders attempting to buy against the trend. Without simultaneous expansion in open interest (OI) and upward price movement, such positioning can instead become a source of future liquidation pressure. On several trading days, BTC and DOGE recorded elevated account long/short ratios, yet prices failed to sustain a recovery. Such divergences should be incorporated into risk management.
4. Quantitative Analysis: Moving Average Compression Breakout Strategy
4.1 Strategy Logic
This report adopts the core concept of the Moving Average Compression Breakout strategy. As multiple short- and medium-term moving averages gradually converge, the market enters a compression phase before choosing a direction. A breakout above the upper boundary of the moving average band indicates that bulls are regaining control, while a breakdown below the lower boundary suggests a higher probability that the bearish trend will continue. Rather than attempting to predict market turning points, the strategy waits for price to reveal its direction after the moving average band has converged.
The strategy constructs a moving average band using six moving averages, consisting of three SMA and three EMA pairs. The parameter grid includes four moving average period combinations: (6,18,54), (8,24,72), (12,36,108), and (20,60,120). Compression thresholds are set at 1.2%, 1.8%, 2.2%, 3%, and 4%, while dynamic take-profit multiples are set at 3, 4, 6, and 8. The strategy is tested using 4-hour candlesticks. Data from May 1 to May 31 is used as the indicator warm-up period, while performance is evaluated from June 1 to June 30.
The entry and exit rules are as follows:
-
Moving average band width = (Highest value among the six moving averages − Lowest value among the six moving averages) / Closing price;
-
A moving average band width below the specified threshold is defined as a moving average compression;
-
When the closing price breaks above the upper boundary of the moving average band, a long position is opened at the open of the next 4-hour candle;
-
When the closing price breaks below the lower boundary of the moving average band, a short position is opened at the open of the next 4-hour candle;
-
A long position is stopped out if the price falls below the lower boundary of the moving average band, while a short position is stopped out if the price rises above the upper boundary;
-
Once profit reaches "the moving average band width at entry × the take-profit multiple," the position is closed at the open of the next 4-hour candle;
-
Any remaining open positions are force-closed at the closing price of the final 4-hour candle of the month.
The backtest assumes a transaction cost of 0.08% for each position change, including trading fees and slippage. This assumption does not represent Gate's actual fee schedule and is used solely to provide a consistent basis for comparing different trading pairs and parameter combinations. The strategy uses no leverage, with capital utilization fixed at 100%. Buy-and-hold returns are calculated using the opening price of the first daily candle and the closing price of the last daily candle in June for the same trading pair.
4.2 Sample Selection and Filtering
The candidate universe consists of 29 valid Gate USDT spot trading pairs, including BTC, ETH, SOL, XRP, DOGE, BNB, ADA, TRX, LINK, AVAX, BCH, LTC, DOT, NEAR, UNI, AAVE, ICP, ETC, ATOM, FIL, OP, ARB, SUI, WLD, INJ, PEPE, SHIB, ONDO, and HBAR. TON_USDT was excluded because it was returned as an invalid trading pair by the Gate spot API during this study.
To prevent an isolated trade from becoming the best-performing sample by chance, the practical strategy candidates were restricted to those meeting the following criteria: monthly Gate spot trading volume above $50 million, at least two trades executed during June, a maximum drawdown no greater than 20%, and maximum position exposure below 95%. The objective of these filters is not to identify the theoretically highest return, but rather to select strategy combinations that were realistically executable under actual market conditions during June.
4.3 Best Practical Case in June: AAVE USDT
Based on the screening criteria above, AAVE USDT was selected as the best practical case for June. The trading pair recorded a monthly spot trading volume of $108.2M, a buy-and-hold return of 3.76%, a monthly price range of 72.28%, and a maximum drawdown of -24.02%. The optimal strategy parameters were a moving average period combination of (8, 24, 72), a moving average compression threshold of 4%, and a dynamic take-profit multiple of 8.
The backtest results show that the AAVE USDT equity curve exhibited a stepwise progression throughout June. Rather than attempting to predict the market direction at the beginning of the month, the strategy waited for breakout signals after the moving average band had converged. This characteristic enabled it to avoid some false breakouts while maintaining positions during sustained directional moves. Compared with the buy-and-hold approach, the strategy outperformed by 56.44 percentage points while limiting the maximum drawdown to -12.9%, indicating that the month's returns were primarily generated through directional shifts and dynamic take-profit execution. This case is not merely a replay of spot price movements but also provides a practical foundation for expressing both long and short market views through perpetual futures.
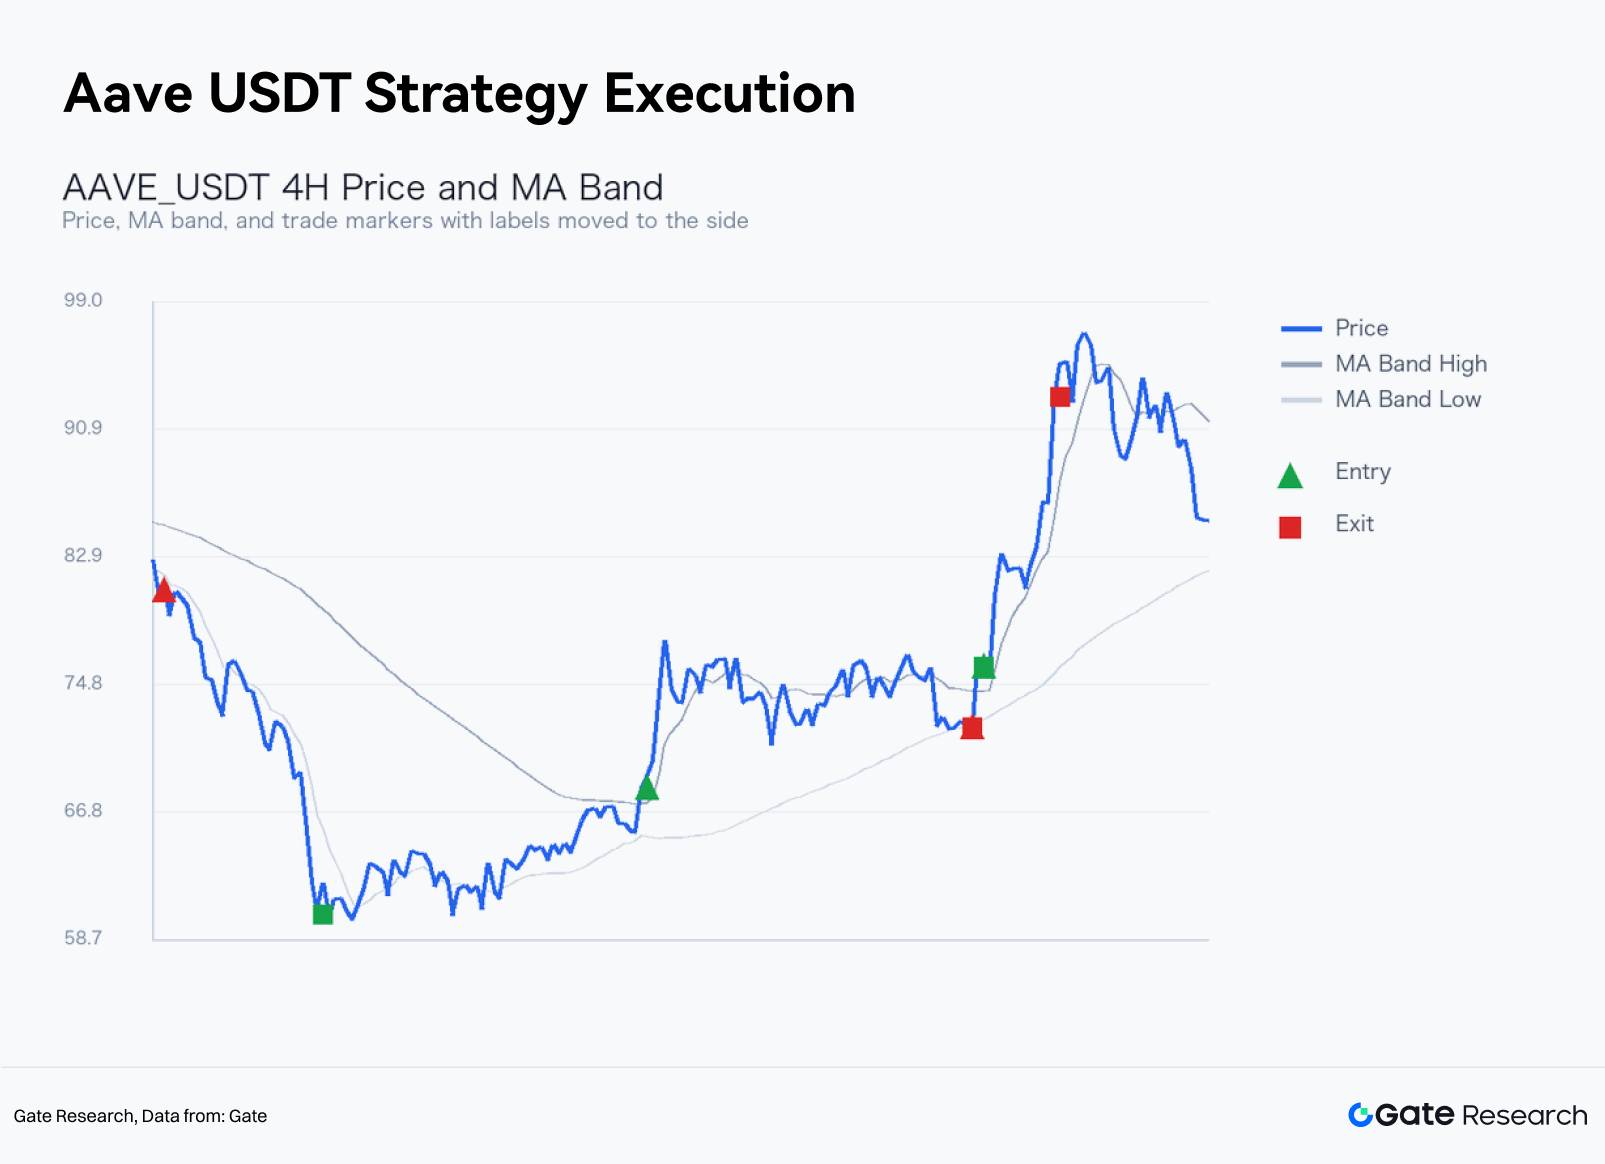
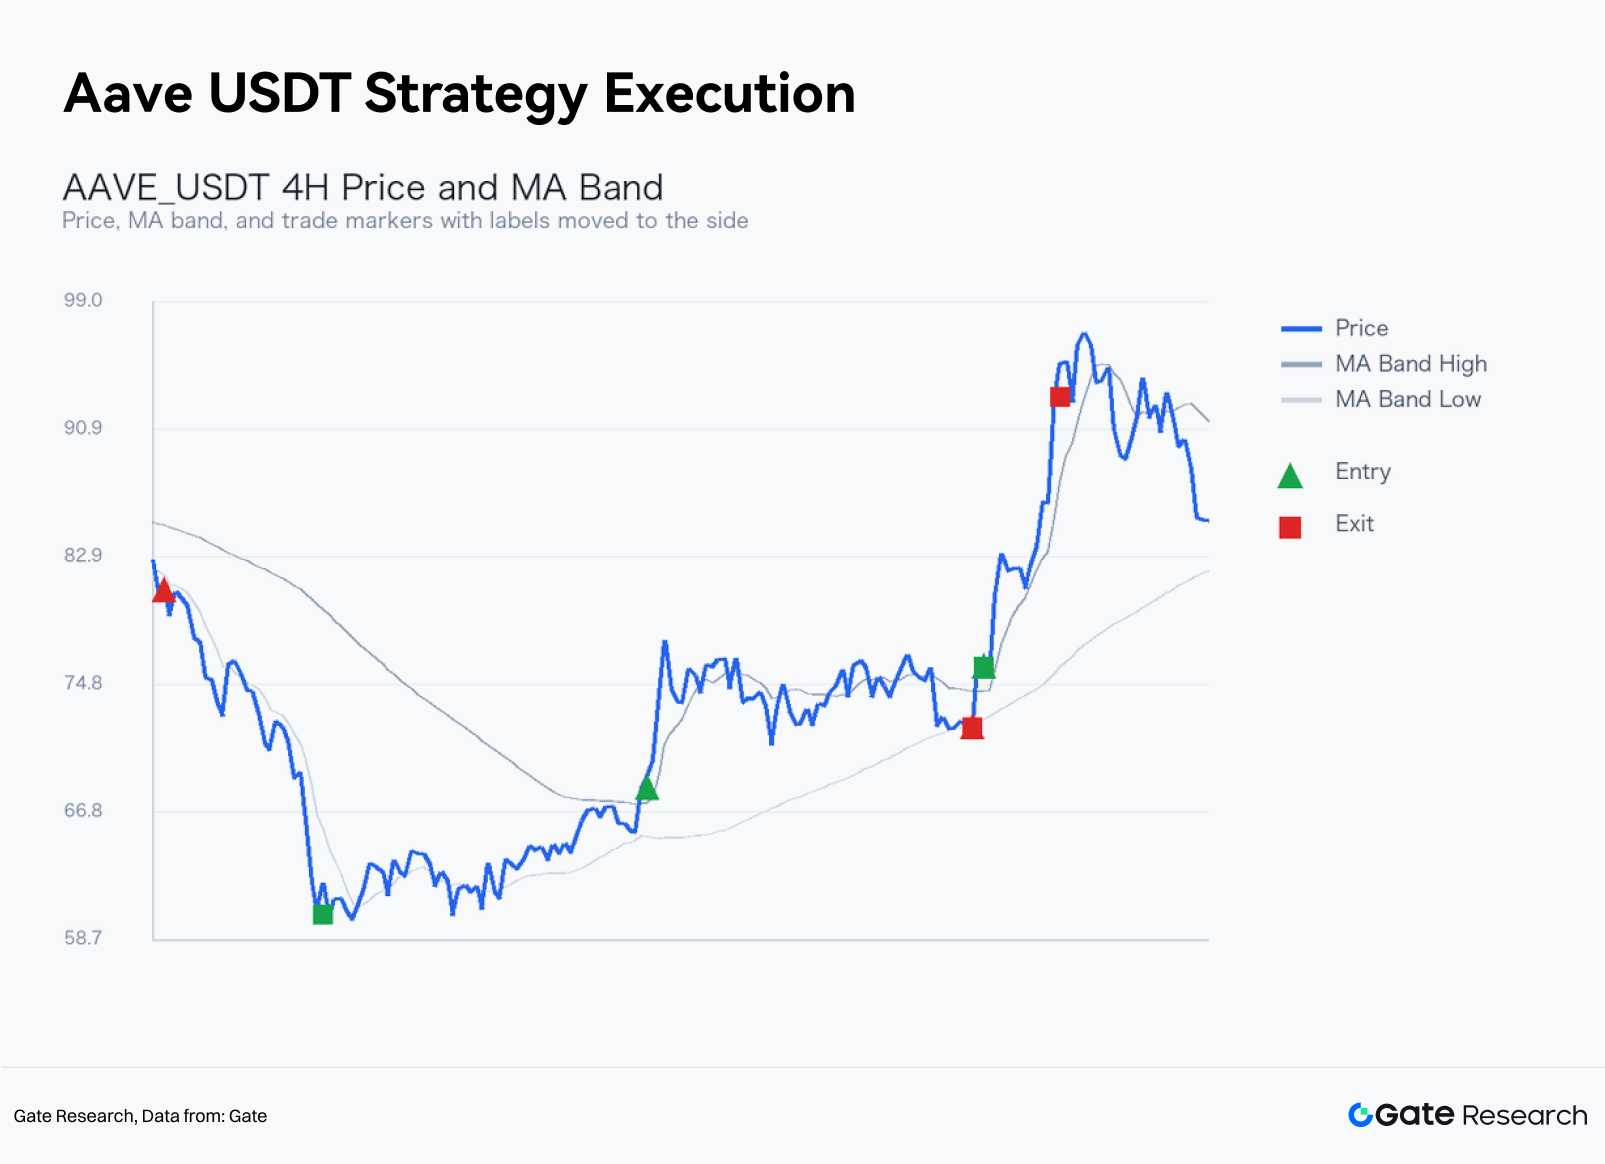
The trade log shows that the strategy performed best during periods when prices moved rapidly away from the moving average band. Short signals contributed more during the downtrend, while long signals primarily served to confirm rebounds. If only spot long positions had been allowed, the strategy's returns would have been significantly lower. If implemented through perpetual futures, however, additional attention should be paid to funding rates, liquidation prices, and position limits.
4.4 Sources of Strategy Returns
The effectiveness of the Moving Average Compression Breakout strategy in June can be attributed primarily to three market characteristics.
First, prices repeatedly transitioned from narrow-range consolidation into directional expansion. The moving average compression condition divides the market into two states—"waiting" and "execution"—thereby reducing unnecessary trading during choppy price action. The strategy only assumes directional risk once prices break away from the moving average band.
Second, declines were more persistent during the weak market environment. Many high-beta trading pairs did not recover immediately after a single-day decline in June but instead continued falling over several consecutive 4-hour candles. Under such market conditions, trend-following strategies are more likely to generate positive expected returns than mean-reversion strategies.
Third, the dynamic take-profit mechanism helped reduce profit giveback. Fixed take-profit targets tend to exit positions too early when volatility expands, while relying solely on moving-average stop-losses may surrender previously realized gains. This strategy sets the take-profit target as "the moving average band width at entry × the take-profit multiple," allowing the profit target to adjust according to the degree of price compression at entry. The tighter the moving average band, the shorter the take-profit distance after the breakout; a wider band allows the strategy to capture larger trend moves.
The limitations of the strategy are also clear. Confirmation based on moving averages is inherently lagging and cannot capture the earliest stage of a trend. During sharp price reversals, short positions may be stopped out near the upper boundary of the moving average band. In addition, when the market enters a broad, directionless trading range, repeated cycles of moving average convergence and divergence can lead to excessive trading costs that erode returns. Therefore, this strategy is better suited as a trend-enhancement component within a broader portfolio rather than as a standalone all-weather strategy.
5. Portfolio Perspective: Combining Trend Enhancement with Market-Neutral Strategies
The June sample demonstrates that trend-following strategies can serve both defensive and offensive purposes during declining markets. Short signals can hedge spot beta exposure, while long signals can capture rebounds from oversold levels, although the return profile is not smooth. When incorporated into portfolio management, the Moving Average Compression Breakout strategy is better suited as an enhancement module combined with low-correlation strategies.
A practical portfolio framework is as follows:
-
Use BTC, ETH, or stablecoin yield strategies as the low-turnover core allocation.
-
Activate the trend enhancement module only after a breakout from moving average compression; otherwise, remain in cash.
-
Limit the risk budget for any single trading pair to 10%–15% of total portfolio equity.
-
Set tighter per-trade loss limits for high-beta altcoins.
-
Reduce the weighting of long signals if both BTC and ETH break below their short- and medium-term daily moving averages.
-
Avoid chasing long positions when funding rates remain significantly positive while prices fail to make new highs.
-
Increase the weighting of rebound signals only after funding rates turn negative, prices stop making new lows, and open interest (OI) begins to recover steadily.
The key objective of this framework is to integrate strategy signals into a disciplined risk budget rather than extrapolating the results of a single backtest. Although June's best-performing case is representative of that month's market conditions, it does not imply that similar returns can be replicated in July. The strength of trend-following strategies lies in disciplined execution: remain out of the market until a compression breakout occurs, exit when stop-loss conditions are triggered, and lock in profits once the dynamic take-profit target is reached.
6. Risks and Outlook
Three indicators deserve close attention going forward.
First, whether BTC can reclaim the rebound range established in mid-June. If BTC remains trapped in a low-level consolidation, the sustainability of altcoin rebounds is likely to remain limited. Conversely, if BTC breaks out on strong volume and drives a recovery in the ETH/BTC ratio, the quality of long signals generated by trend-following models should improve.
Second, whether futures open interest (OI) expands alongside a price rebound. A price recovery without OI growth often reflects nothing more than short covering. A rebound accompanied by rising OI and moderate funding rates is more indicative of fresh capital entering the market.
Third, whether funding rates and the account long/short ratio become extreme once again. A high long/short ratio combined with positive funding rates and weak prices may signal potential liquidation pressure, whereas negative funding rates combined with sideways price action near market lows may provide the conditions for a rebound.
From a strategy perspective, the Moving Average Compression Breakout model remains worth tracking in July. However, two additional filters are recommended. First, incorporate a volume confirmation filter by requiring the breakout candle's trading volume to exceed the average volume of the previous 20 four-hour candles. Second, add a BTC trend filter by reducing long exposure in altcoins when BTC itself remains in a daily downtrend. These enhancements can help reduce false breakouts caused by trading against the prevailing market trend.
Source:
Gate Research is a comprehensive blockchain and cryptocurrency research platform that provides deep content for readers, including technical analysis, market insights, industry research, trend forecasting, and macroeconomic policy analysis.
Disclaimer
Investing in cryptocurrency markets involves high risk. Users are advised to conduct their own research and fully understand the nature of the assets and products before making any investment decisions. Gate is not responsible for any losses or damages arising from such decisions.