Summary
-
In June 2026, global markets remained volatile against a backdrop where easing geopolitical risks coexisted with constraints from high interest rates. The crypto market as a whole continued its structural divergence, while institutional capital remained cautiously on the sidelines.
-
ETF flows continued to see net outflows in late June. Spot Bitcoin and Ethereum ETFs came under pressure at the same time, reflecting an overall reduction in institutional risk exposure to crypto assets.
-
Style rotation emerged in global equity markets. Leading AI names entered pullbacks from elevated levels, while defensive sectors such as healthcare performed strongly. Gold and crude oil weakened, and commodities showed structural divergence.
-
Prediction markets and consumer-oriented RWAs continued to heat up. The Polymarket channel ecosystem kept expanding, and Physical TCG pushed the on-chainization of physical collectibles into a phase of rapid growth.
-
Global regulators and traditional financial institutions accelerated their blockchain scope. Japan’s three major banks advanced a yen stablecoin plan, and the U.S. SEC launched a regulatory pilot for tokenized stock trading.
-
Gate became the largest weekly distribution channel for Polymarket Builders, and exchanges are gradually becoming an important gateway for prediction market user growth and liquidity expansion.
1. Macro Market Trends
1.1 The situation in the Middle East is disturbing global capital markets, and institutional capital is more inclined to control volatility exposure.
At the same time, the Middle East situation remained an important source of external disturbance in June, but by the end of the month, as ceasefire and negotiation expectations heated up, oil prices fell notably from high levels, and the risk premium narrowed at the margin. At the macro level, this produced a combination characterized by “easing geopolitical disturbances, persistent rate constraints, and pressure on growth valuations.” For the crypto market, this environment did not constitute a trend-like incremental positive. Institutional capital was more inclined to control volatility exposure and wait for greater clarity in policy and risk appetite. Therefore, the market in June as a whole still remained dominated by volatility and structural divergence.
1.2 ETF Flows: Continued Net Outflows in Late June, Institutional Risk Appetite Cooled Significantly
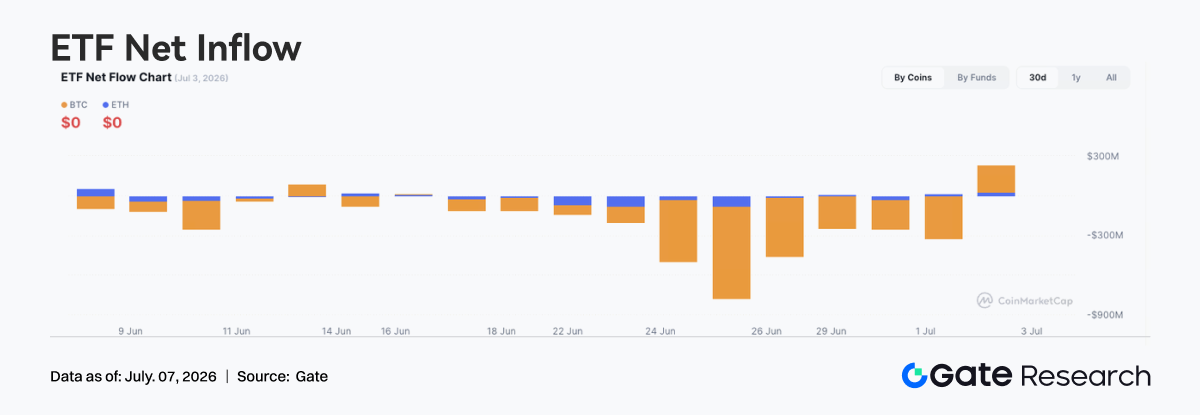
From the perspective of ETF fund flows, the main tone of June 2026 was continued cooling. The 30-day fund flow range shows that most trading days from June 9 to July 3, 2026 recorded net outflows, with particularly large outflows appearing consecutively from June 24 to June 26, indicating that institutional investors significantly reduced crypto asset risk exposure in the late-month phase.
Structurally, spot Bitcoin ETFs were still the main source of this round of capital change, with the orange bars accounting for almost all of the total net outflow. Although Ethereum ETFs were smaller in size, the blue portion also maintained a negative contribution most of the time. This means institutions were not merely making minor position adjustments in a single asset, but were instead adopting a more conservative allocation stance toward the entire mainstream crypto asset sector.
It is worth noting that a noticeable replenishment appeared at the end of the chart on July 3, indicating that extreme pessimism eased somewhat in the short term. But if one looks only at the continuous capital withdrawal in late June, what the ETF market still reflects is an institutional behavior pattern of “de-risk first, then wait and see.” Overall, weak ETF flows in June were one of the important variables suppressing risk appetite in the crypto market.
1.3 Global Capital Market Trends
1.3.1 Major Global Equity Indices: Volatility Intensified, Recovery Appeared from End-June to Early July
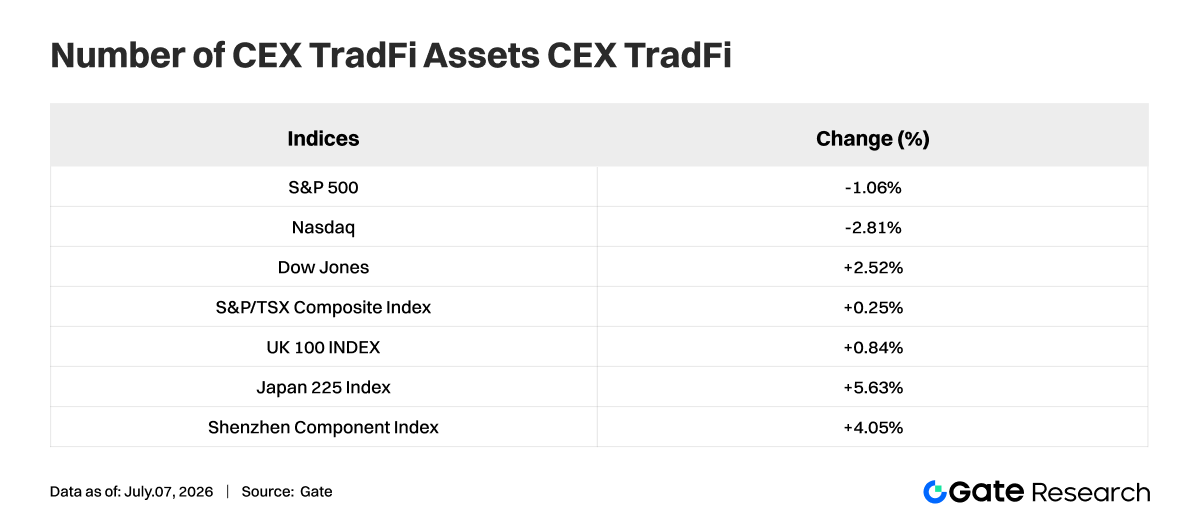
From the perspective of global equity markets, June 2026 was not a one-way upward move, but rather a stage in which high-level volatility coexisted with regional divergence. The three major U.S. indices diverged during the month: the Dow Jones Industrial Average rose 2.52%, the S&P 500 fell 1.06%, and the Nasdaq Composite fell 2.81%. This shows that the main market trading line shifted from the previous concentrated pursuit of highly valued growth names to rebalancing between value and growth.
Overall, global equity indices went through a process of “valuation compression first, sentiment repair afterward” during June. Risk appetite did not disappear completely, but pricing was no longer chasing a single growth narrative as intensely as before. For institutional capital, this kind of environment is more suitable for balanced allocation and sector rotation rather than high-position bets on high-volatility assets.
1.3.2 Stocks: AI Leaders Pulled Back from High Levels, Defensive Nature of Healthcare Became Prominent
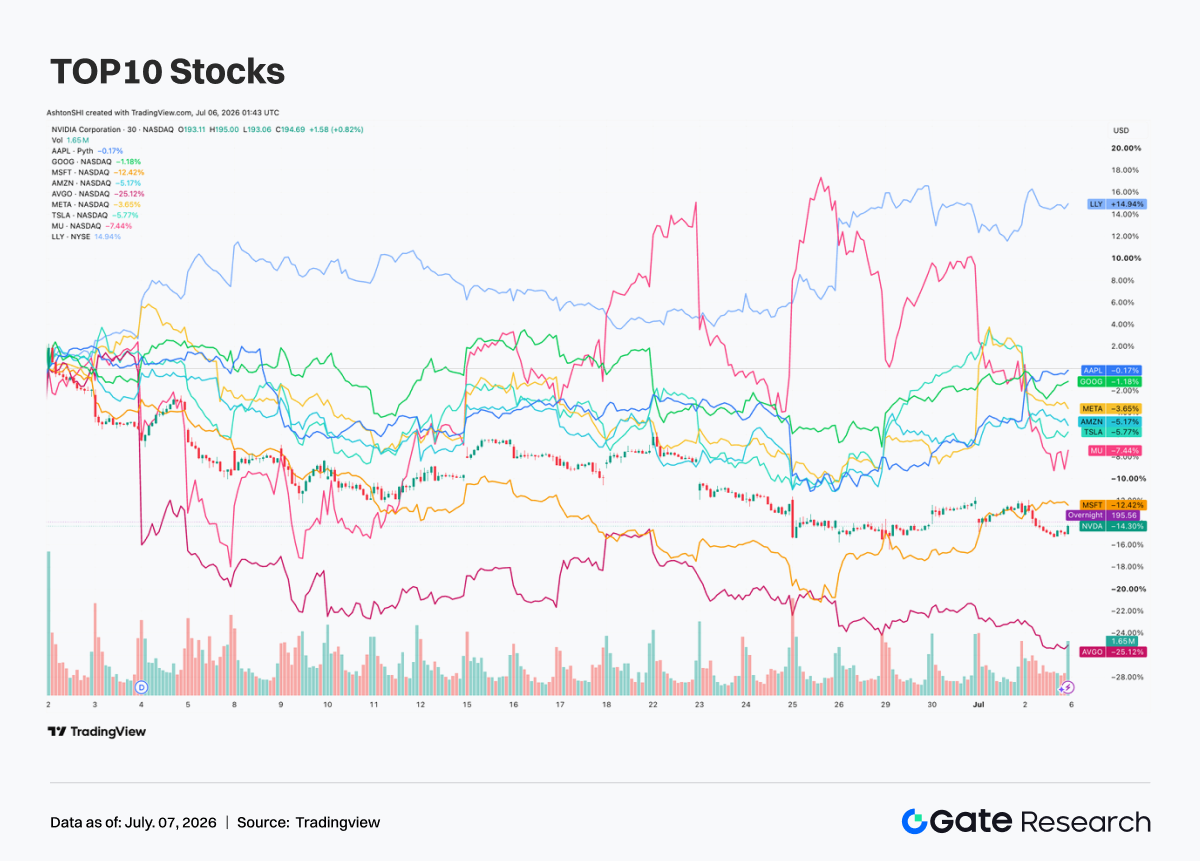
At the single-stock level, the clearest feature in June was that AI leaders collectively entered a retracement phase, and the previously high-flying semiconductor and computing-power chain cooled significantly. Looking at relative returns from June 2 to July 6, 2026, Nvidia (NVDA) fell 14.30%, Microsoft (MSFT) fell 12.42%, Broadcom (AVGO) fell 25.12%, and Micron (MU) fell 7.44%, showing that profit-taking pressure on highly valued AI assets rose significantly.
At the same time, Apple (AAPL) fell only 0.17%, Google (GOOG) fell 1.18%, Meta fell 3.65%, and Amazon (AMZN) fell 5.17%, showing relatively resilient performance. This indicates that the market was not indiscriminately dumping technology stocks, but was instead re-differentiating between “high-expectation, high-elasticity” names and large platform companies with “more stable cash flow and more controllable valuations.” The AI narrative remains in place, but the valuation premium the market is willing to pay is declining.
The healthcare sector continued to provide defensive excess returns. Eli Lilly (LLY) rose 14.94% over the same period, significantly outperforming most major technology leaders, reflecting that capital has begun to prefer assets combining both growth and defensive characteristics. Overall, the style rotation in the equity market in June was very clear, with institutions more inclined to pull away from crowded trades and shift toward areas with more balanced valuations and higher earnings certainty.
Precious metals weakened significantly in June. Looking at the relative return range for commodities, gold showed a return of -10.24% in the corresponding early-July interval, silver -13.46%, and platinum -15.87%. If one looks only at the June trend, all three showed a relatively consistent downward slope during the month, indicating that precious metals trades previously supported by safe-haven sentiment and easing expectations were cooling.
What this reflects is not that gold’s long-term logic has been destroyed, but rather that short-term capital has taken profits in safe-haven assets in stages. On the one hand, although global risk assets were volatile, there was no sustained systemic panic; on the other hand, market views on inflation, growth, and the policy path became more divided, causing the one-way bullish narrative for gold to temporarily lose momentum in June.
Therefore, gold in June was more like a downward extension of consolidation at high levels rather than a trend-like collapse. For institutional allocation, gold’s long-term hedging value remains, but at the short-term trading level, the precious metals sector has shifted from a strong asset class earlier in the year to an observation range waiting for new catalysts.
1.3.4 Commodities: Crude Oil Slumped and Dragged the Whole Sector, Copper and Natural Gas Were Relatively Stronger
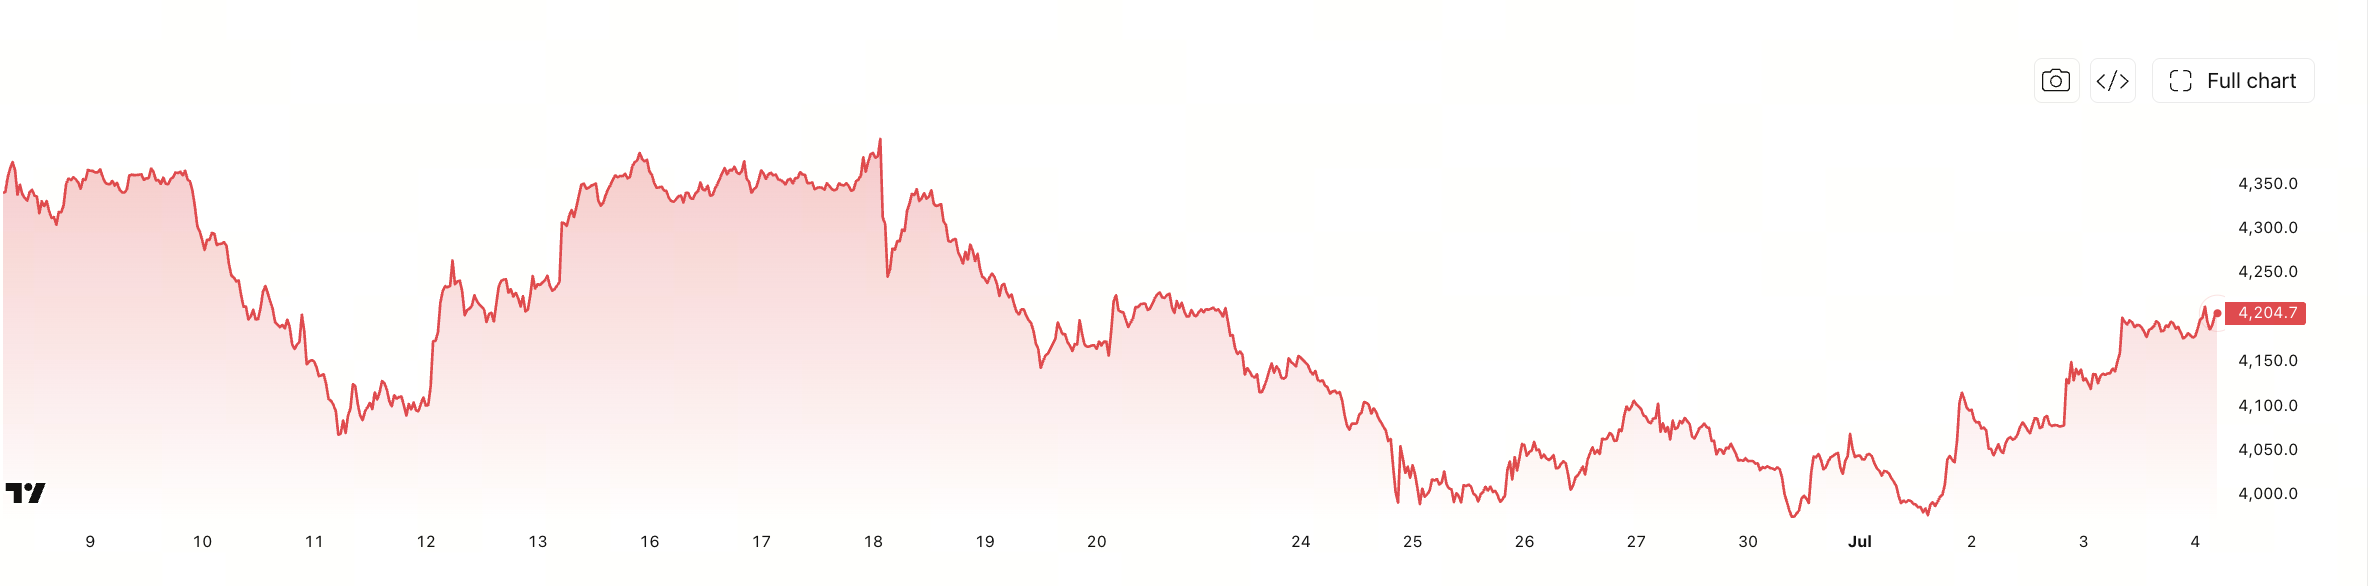
The divergence in commodities became even more extreme in June. The weakest was energy: light crude oil’s return in the relevant interval dropped to -38.99%, and it suffered a continued decline in the middle and latter parts of June, indicating that the oil-price logic previously driven by supply concerns and geopolitical premiums had clearly faded. The sharp pullback in crude oil also directly depressed both risk appetite and inflation expectations across the broader commodity sector.
But not all commodities weakened simultaneously. Natural gas still recorded a positive return of 12.49% during the same period, and copper also maintained relative strength at 11.58%, showing that expectations for industrial demand had not fully collapsed. Rather, the market had simply shifted from “broadly betting on rising resource prices” to more segmented product selection. Overall, the commodity market in June 2026 shifted from a broad-based rally logic to structural pricing, with energy correction and the relative resilience of industrial metals becoming the most important trading characteristics.
2. Analysis of Hot Sectors
2.1 CEX Channel Penetration and Redistribution of On-Chain Entry Points: Gate Becomes the Largest Weekly Polymarket Distribution Channel
The channel structure of Polymarket Builders is undergoing obvious changes. According to official Polymarket Builders data, Gate has become one of the most prominent external gateways in terms of trading volume, ranking first in weekly trading volume, second in monthly trading volume, and also among the leaders in cumulative trading volume within Builder channels. Traffic sources for prediction markets are expanding from early crypto-native communities, trading front ends, and bot tools into a multi-entry structure jointly involving exchanges, wallets, aggregators, and on-chain trading tools. Polymarket is no longer just an independent prediction market front end, but is being redistributed by different types of crypto infrastructure.
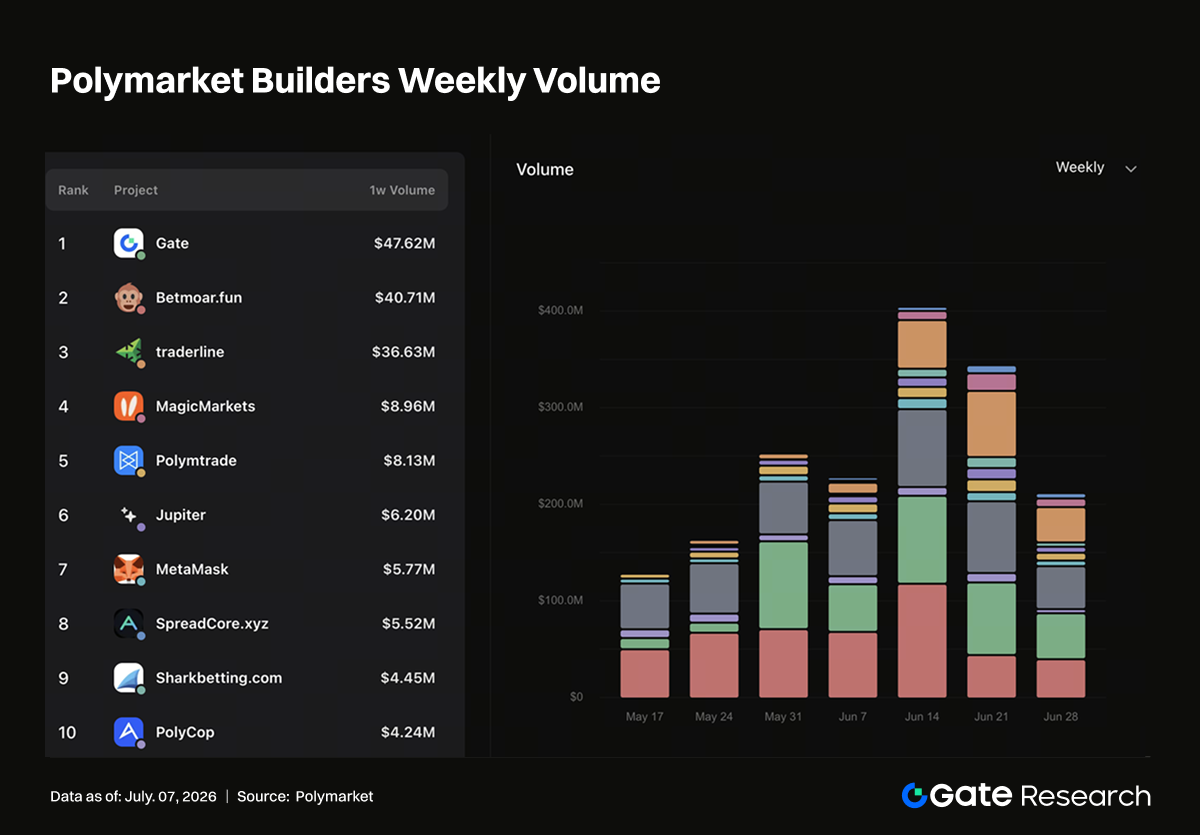
Gate’s growth represents a more substantive stage of CEX penetration into Polymarket. Exchanges possess ready-made account systems, asset balances, trading education, market data pages, and event reach capabilities. Users do not need to re-understand on-chain interactions, nor go through the full process of wallets, cross-chain transfers, deposits, and approvals before being guided into prediction market trading scenarios. Exchanges represented by Gate are well suited to packaging prediction markets as a type of “event trading category,” displayed alongside existing exchange products such as spot, contracts, wealth management, Alpha, and new tokens.
Another CEX wallet provides a different sample. Although its trading volume ranking is not as high as Gate’s, it contributed nearly 40% of the weekly share in active address count, showing that exchange-affiliated wallet channels are likewise undertaking large-scale reach and entry-point distribution. Wallet users naturally possess on-chain operating capability and are suitable for participating in small-ticket, high-frequency, event-driven markets, while also being more easily mobilized by airdrops, points, tasks, and competition incentives. For Polymarket, CEXs like Gate provide incremental retail capital, while wallets like that other CEX wallet provide incremental on-chain addresses; the two correspond respectively to the two dimensions of growth in trading volume and user count.
Well-known on-chain tools such as Jupiter, MetaMask, and Axiom are also gradually gaining traction. Jupiter represents aggregator traffic, MetaMask represents the foundational wallet gateway, and Axiom represents a user group more oriented toward trading front ends and on-chain tooling. These gateways mostly cover deep DeFi users, who are more familiar with on-chain assets, signing, arbitrage, and cross-application flows, and are more likely to conduct strategy-based trading around probability differences, changing odds, information asymmetry, and liquidity. Compared with CEX users, this segment may not grow the fastest, but it is especially important for market depth, price discovery, and long-tail trading scenarios.
Large events such as the World Cup further amplify this channel competition. Sports events are naturally suited to prediction market dissemination: outcomes are clear, cycles are concentrated, and audiences are broad, enabling them to attract crypto users, sports users, and general trading users at the same time. CEXs can quickly bring in retail traders through event pages, trading tasks, leaderboards, and reward pools; wallets can expand address participation through task systems and on-chain identity accumulation; aggregators and trading front ends can build tool-based enhancements around odds, market depth, fund flows, and combination trading. The traffic peaks brought by large events are in fact also a concentrated test of the conversion capability of all kinds of entry points.
Overall, the changes in Polymarket Builders indicate that prediction markets are entering a phase of channel financialization. The platform itself provides event markets and settlement infrastructure, while external Builders are responsible for bringing in different types of users. Gate’s first place weekly ranking and second place monthly ranking prove that CEXs can already directly influence the trading-volume structure of Polymarket; Bitget Wallet’s address contribution proves that exchange-affiliated wallets have become key entry points for the spread of on-chain users; and the growth of Jupiter, MetaMask, and Axiom preserves the influence of DeFi-native users on market depth and tool-based trading.
2.2 On-Chainization of Physical Trading Cards: A New Sample of Consumer-Oriented RWA
Physical TCG is becoming one of the most representative niche categories between RWA and on-chain consumer applications. According to DeFiLlama data, Physical TCG protocols generated more than $25 million in fees in June. Their fee income comes from physical card sales, pack opening, custody, redemption, secondary market trading, and platform commissions, closely resembling the revenue model of on-chain consumption, e-commerce, and collectibles trading.
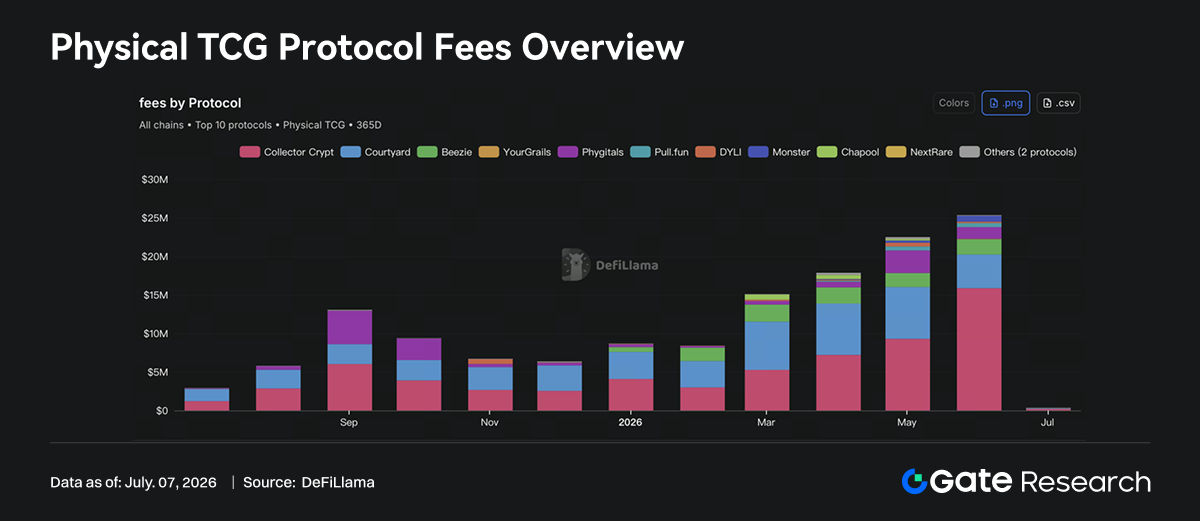
From the fee trend, Physical TCG has gone through obvious volume expansion over the past year. Monthly fees for the category were about $3.08 million in July 2025, rose to about $5.79 million in August, reached about $13.06 million in September, then fell back and stabilized in the $6-9 million range from October to December. After entering 2026, the growth slope rose again: about $8.69 million in January, about $8.41 million in February, about $15.10 million in March, about $17.85 million in April, about $22.49 million in May, and further up to about $25.34 million in June. The continuous growth after March indicates that this track has entered a stage of sustained category expansion.
However, the fee structure is highly concentrated. Collector Crypt generated about $15.87 million in fees in June, accounting for about 63% of monthly Physical TCG fees, making it the absolute core protocol in the sector at present. Courtyard generated about $4.36 million, accounting for about 17%; Beezie about $1.99 million, around 8%; and Phygitals about $1.52 million, around 6%. The top four protocols together contributed more than 90% of total fees, and truly scaled revenue remains concentrated on only a few leading platforms. This pattern is very similar to the early NFT market, where users and liquidity quickly concentrate on the platforms with the strongest inventory, clearest gameplay, best settlement experience, and highest market recognition.
Collector Crypt’s growth is especially important. Its fees were about $9.29 million in May and rose to about $15.87 million in June, an increase of about $6.58 million in a single month, making it the main source behind Physical TCG reaching a new high again in June. Its fees and revenue mainly come from gacha card pack sales of physical cards such as Pokemon, fiat/credit card channel sales, on-chain purchases, and secondary market fees, while deducting some pack buyback expenditure. The essence of Collector Crypt is a combination of physical card pack opening + custody + an on-chain trading marketplace, rather than a pure NFT trading platform. What users buy is not an abstract image, but rights to a physical asset that has offline collectible value and can be custodied, redeemed, and traded.
Courtyard represents another path. Its positioning is more oriented toward tokenization and market trading of physical collectibles. It generated about $4.36 million in fees in June, lower than about $6.73 million in May, but it still remained the second-largest protocol. Courtyard’s presence in the Polygon ecosystem also shows that the core competition in Physical TCG depends on inventory, custody, authentication, trading experience, and user trust. The difficulty of putting physical trading cards on-chain is not minting NFTs, but ensuring that the cards truly exist, that their condition is verifiable, that redemption procedures are executable, and that there is sufficient buy and sell liquidity in the secondary market. These links determine whether a protocol can evolve from a one-time pack-opening activity into a continuously traded collectibles financial market.
Protocols such as Beezie, Phygitals, Pull.fun, Monster, and DYLI form the second tier. Beezie runs on Base, with around $1.98 million in 30-day fees, mainly from claw pull, BidRouter swap, and marketplace sale commissions; Phygitals runs on Solana, with around $1.51 million in 30-day fees, generating revenue around vaulted collectible cards, gacha, royalties, lucky draws, and marketplace activity; Pull.fun’s model is on-chain pack opening, market trading, and physical redemption, with around $520,000 in 30-day fees; projects such as Monster, DYLI, and YourGrails are exploring similar models in ecosystems such as MegaETH, Abstract, and Avalanche. Multiple public chains are trying to transform physical collectibles into tradable on-chain consumer assets.
In terms of chain distribution, Solana currently has a clear advantage. Based on a rough split of 30-day fees, Solana contributed about $17.39 million, accounting for nearly 69%, mainly driven by Collector Crypt and Phygitals; Polygon about $4.36 million, around 17%, almost entirely from Courtyard; Base about $2.02 million, around 8%, mainly from Beezie; while Off-chain, MegaETH, Abstract, Avalanche, and similar entry points are still at a much earlier stage. Which chain can attract Physical TCG projects depends not only on gas and TPS, but also on wallet experience, fiat on-ramps, social dissemination, and the user base for NFTs/collectibles.
The growth logic of Physical TCG differs from that of traditional NFTs. The core assets of NFTs are mostly native on-chain scarcity and community consensus, while the core assets of Physical TCG come from the established pricing systems of offline physical collectibles. Pokemon, sports cards, One Piece cards, game cards, and similar items already have mature collector demand. What on-chain protocols provide is faster trade settlement, more transparent ownership records, more flexible fractional circulation, and stronger gameplay design. Pack opening/gacha brings consumer impulse, custody and redemption provide a physical anchor, and the secondary market adds a space for financialized trading. After these three layers are combined, Physical TCG is closer than ordinary NFTs to a tradable collectibles e-commerce model.
The risks are also more concentrated off-chain. Custody of physical assets, authenticity verification, grading standards, redemption fulfillment, cross-border transport, and consumer protection all affect protocol credibility. Gacha and pack-opening mechanisms may also face issues around gambling-like behavior, minor protection, and lottery regulation. The faster revenue grows, the more platforms need to prove that inventory is real, pricing is fair, buyback mechanisms are transparent, and redemption paths are stable. If these issues are not handled well, high fee growth may turn into a trust discount; if handled well, Physical TCG may become one of the earliest consumer-oriented RWA categories to produce real revenue at scale.
3. Industry Developments
3.1 Warsh Chairs His First FOMC Meeting: Analysis of How Differences Between the Warsh Era and the Powell Era Affect Financial Assets
On June 17, Kevin Warsh chaired an FOMC meeting for the first time as Federal Reserve Chair. The meeting itself did not adjust interest rates, and the federal funds target range remained at 3.50%-3.75%, but what the market truly focused on was not “holding steady,” but the clear shift in the policy narrative. The Fed statement confirmed that rates would remain unchanged, and the new quarterly projections showed that 9 Fed officials already expected at least one more rate hike before the end of 2026. At the same time, the policy statement removed previous wording that had implied possible rate cuts within the year. In other words, the core signal of the June meeting was not a pause, but that the Fed had shifted back from a framework of “waiting for cuts” to one of “guarding against renewed hikes.”
The reason this meeting is a turning point is first of all that the communication style of the Warsh era differs from that of the Powell era.
3.1.1 Warsh Era vs. Powell Era: How Assets Move Together
The core characteristic of the Powell era was a “risk-management central bank”: first using extremely loose policy to support the economy after the pandemic, then rapidly raising rates after inflation got out of control, and later turning to data dependence while avoiding premature declarations of victory. Its policy function was relatively pragmatic, emphasizing a balance among employment, financial stability, and inflation expectations. If Warsh represents another policy style, it is more likely to emphasize dollar credibility, central bank balance sheet discipline, inflation prevention, and a rule-based framework. He has previously been wary of excessive QE, fiscal dominance, and central-bank intervention in market pricing. Therefore, the market usually interprets a “Warsh-style Fed” as more hawkish, more focused on long-term rate signals, and more willing to let risk assets reprice on their own.
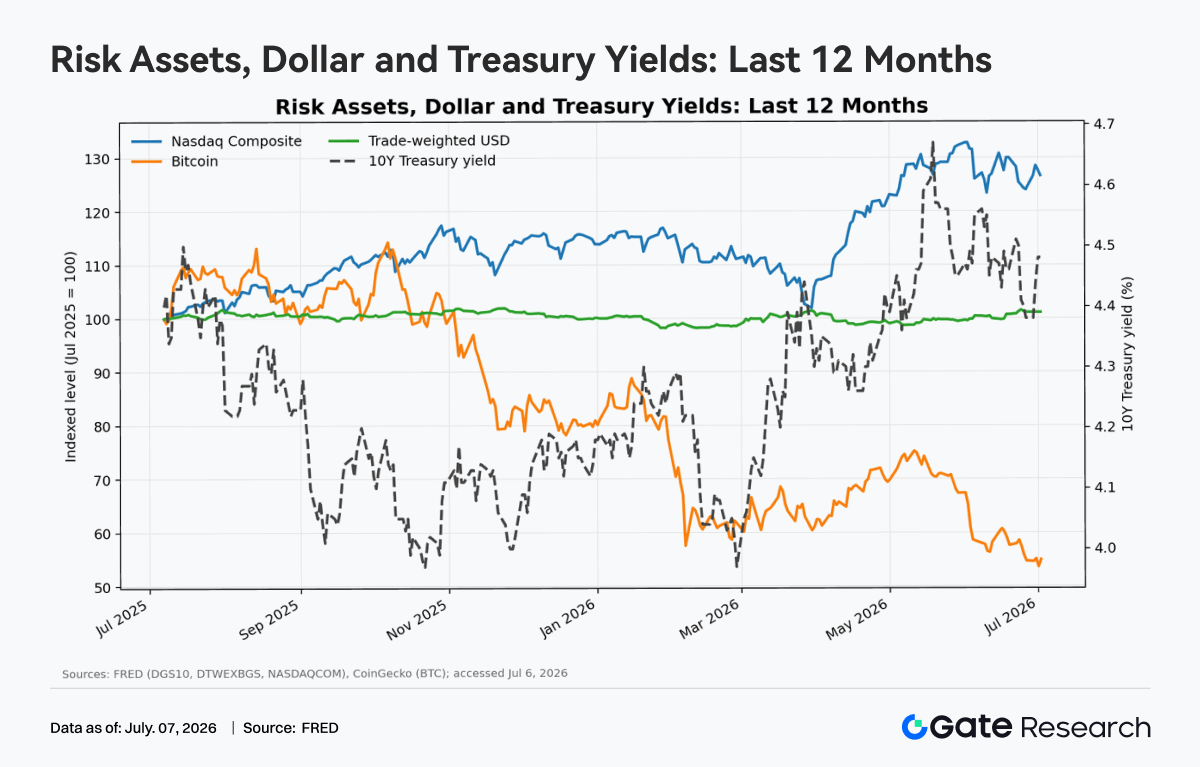
The linkage among the U.S. dollar, Treasuries, technology stocks, and crypto assets fundamentally revolves around global dollar liquidity. When 10-year Treasury yields rise, the risk-free return on dollar assets increases, making it easier for capital to flow back into dollar cash, short-duration bonds, and high-grade bonds; a stronger dollar then tightens global financial conditions, especially putting pressure on non-U.S. financing, commodities, and crypto assets. Tech stocks and Bitcoin both carry “long-duration asset” characteristics: current cash flow or intrinsic yield is not high, and valuation depends more on future growth and loose liquidity. Therefore, they often rise together when real rates fall, the dollar weakens, and risk appetite improves; and they come under pressure together when yields rise and the dollar strengthens.
3.1.2 Valuation Compression of Risk Assets Under High Rates
High interest rates compress the valuation of risk assets through two paths. The first is the discount-rate path: future cash flows are discounted at higher rates, causing present value to fall, and the P/E and P/S of growth stocks as well as crypto network-value multiples are all pushed lower. The second is the asset-substitution path: when short-duration bonds can provide relatively high risk-free yields, investors demand higher risk premiums from risk assets, otherwise they reduce positions. Figure 2 uses a simplified model to show that, when the long-term growth rate remains unchanged, a rise in the 10-year yield from 2% to 5% causes the theoretical P/E ratio to decline significantly; the higher the growth expectation of an asset, the more sensitive it is to interest rates.
Therefore, the market focus in the Powell era was “when rate cuts will come, how much they will be, and whether a soft landing can be achieved”; if the Warsh narrative gains traction, the focus will become “dollar credibility, fiscal discipline, and whether long-term rates stay on a higher plateau.” For technology stocks and crypto assets, the truly critical factor is not nominal rates alone, but whether real rates, the dollar’s direction, liquidity, and earnings/adoption can improve simultaneously. If high rates persist while growth slows, risk assets may continue to undergo valuation compression; if inflation falls, real rates decline, and earnings remain intact, tech stocks will recover first, while crypto assets usually follow with higher beta.
3.2 Japan’s Three Major Banks to Jointly Issue a Yen Stablecoin: Competition Among Non-Dollar Stablecoins Enters the Sovereign Currency Level
On June 10, Reuters reported that banks under Japan’s three major financial groups, Mitsubishi UFJ Bank, Sumitomo Mitsui Banking Corporation, and Mizuho Bank, plan to jointly issue a yen stablecoin within the current fiscal year ending in March 2027, and will establish a committee to study the operating framework and issuance preparations. Japan’s Financial Services Agency is also supporting the project’s experimental phase, hoping to improve payment system efficiency with blockchain technology. On the surface, this is a technical attempt by the Japanese banking industry to advance digital payments; but at a deeper level, it means that stablecoin competition is moving from a dollar liquidity tool inside the crypto market into a new stage jointly involving banks, regulators, and sovereign currencies.
3.2.1 Yen Stablecoins Are Still in an Early Exploration Stage
Stablecoins have long been dominated by the U.S. dollar. Whether USDT, USDC, or the compliant dollar stablecoins that have risen in recent years, their main function has been to provide a unit of account, settlement tool, and on-chain dollar liquidity for crypto trading. The reason dollar stablecoins expanded so rapidly is essentially that global investors already need dollar assets, while blockchain simply allows dollars to circulate globally at lower cost and higher efficiency. By contrast, non-dollar stablecoins have developed slowly not because the technology is infeasible, but because use cases, liquidity networks, and regulatory frameworks remain immature. Reuters also noted in its 2025 report on JPYC that dollar-pegged stablecoins account for the overwhelming majority of the stablecoin market, while yen stablecoins are still in an early exploration phase.
The importance of the joint issuance of a yen stablecoin by Japan’s three major banks lies first in the change of issuer type. Previously, the representative yen stablecoin was JPYC, a startup company, whose significance was in proving the legal and technical feasibility of putting the yen on-chain. But the participation of Mitsubishi UFJ, Sumitomo Mitsui, and Mizuho pushes yen stablecoins from startup pilots toward infrastructure-level experiments within the banking system. Japan’s three major banks not only have huge enterprise client bases, clearing networks, and compliance capabilities, but are also deeply embedded in Japan’s domestic payment, trade finance, and cross-border settlement systems. Once they jointly formulate the operating framework, the yen stablecoin will no longer be just a niche asset in crypto trading, but may become a new settlement tool among banks, between enterprises, and in cross-border payments.
Japan is also special in that its stablecoin regulatory framework clarified relatively early “who may issue stablecoins.” Previous documents from Japan’s Financial Services Agency showed that, in order to address bank-run risk and ensure redemption at par, issuers of digital-currency-type stablecoins must be banks, fund transfer service providers, or trust companies, and must provide users with clear redemption rights. This means Japan is not allowing unregulated entities to issue stablecoins freely, but is instead bringing stablecoins into the existing framework of financial licensing and prudential regulation. Unlike the U.S. path, which is led more by market innovation and private issuers, Japan places greater emphasis on having regulated financial institutions take the lead, ensuring reserves, redemption, and user protection first, and only then gradually expanding use cases.
Therefore, this event also reflects the transformation of stablecoins from “crypto assets” into “payment infrastructure.” In the past, the main demand for stablecoins came from crypto exchanges and on-chain DeFi, and users focused on liquidity, trading depth, and cross-platform transfer efficiency. But the potential use cases of bank-issued yen stablecoins are more oriented toward enterprise payments, cross-border remittances, supply-chain settlement, and inter-institution clearing. For enterprises, traditional cross-border payments often involve banking intermediaries, clearing time differences, foreign exchange conversion, and relatively high fees; if a yen stablecoin can achieve 24-hour transfers and near-real-time settlement within a compliant framework, it may reduce corporate capital turnover costs. For financial institutions, stablecoins may also become the funding layer for the future settlement of tokenized bonds, funds, deposits, and securities.
3.2.2 Yen Stablecoins Are Expected to Enter Asian Trade and Financial Activity
More notably, the Japanese government and ruling party are placing yen stablecoins into an Asian settlement strategy. Reuters reported on June 1 that a policy group within Japan’s Liberal Democratic Party called on the government to promote the use of yen stablecoins in Asian financial settlement and to build a legal framework supporting crypto ETFs. This indicates that yen stablecoins are not merely a domestic payment innovation, but are also being given significance in regional currency competition. In Asian trade and financial activity, the U.S. dollar has long held a dominant position; if yen stablecoins can serve settlement between Japanese enterprises and Asian supply chains, they may strengthen the presence of the yen in regional payments.
However, it will not be easy for yen stablecoins to truly challenge dollar stablecoins. Competition among stablecoins is not simply issuance competition, but network-effect competition. Dollar stablecoins have already formed a global liquidity network around exchanges, market makers, DeFi protocols, cross-chain bridges, and payment platforms. By contrast, even with the endorsement of the three major banks, yen stablecoins still need to solve problems such as insufficient use cases, limited on-chain liquidity, complex cross-border compliance, and the migration of user habits. Especially in Japan, cash and credit cards remain important payment methods, and digital payment transformation itself requires a relatively long time. Reuters also pointed out that Japan remains a market with high usage of cash and credit cards, and stablecoin adoption will not happen overnight.
3.3 U.S. SEC Plans to Allow Tokenized Stock Trading: A Regulatory Experiment on Stock Market Infrastructure
On June 17, Reuters reported that the U.S. SEC is preparing to introduce a new policy allowing crypto companies to provide blockchain-based tokenized stock trading. The policy is expected to be implemented in the form of an “innovation exemption,” allowing some market participants to test tokenized securities trading models within a specific time frame and scope.
The SEC’s plan to use an “innovation exemption” to allow crypto companies to test tokenized stock trading is important not because “stocks will immediately move fully on-chain,” but because it marks a shift in U.S. regulatory attitude from enforcement-driven to sandbox-style experimentation. The so-called innovation exemption is essentially a regulatory testing window given to specific entities, specific products, specific time periods, and specific investor groups: it neither fully exempts securities laws nor requires compliance from day one with all the requirements of the traditional systems of exchanges, clearing, custody, transfer agents, and brokers. This is a major marginal change for the crypto industry, because it turns the former gray area of “do it first and get fined later” into an institutional path of “limit the scope first, then observe the risks.”
The core of tokenized stocks is not merely to repackage shares such as Apple or Nvidia, but to reconstruct the back-end processes of the securities market. Traditional stock trading, although already highly electronic, still relies on exchange matching, broker accounts, clearinghouses, custodian banks, and T+1 settlement. The blockchain version seeks to achieve longer trading hours, near-real-time settlement, on-chain ownership records, composable collateral, and cross-border accessibility. For crypto companies, tokenized stocks can bring high-credit assets like U.S. equities into the on-chain ecosystem, becoming a new type of collateral and yield-bearing asset beyond stablecoins; for traditional finance, they constitute an infrastructure experiment in securities settlement systems.
3.3.1 Benefits and Constraints in the Meaning of SEC Policy
But the policy implications must be viewed on two levels. The first level is the positive side: if the SEC allows pilots, it means regulators acknowledge that “securities can be tokenized,” and that the technical form itself is not inherently problematic. In the past, the core U.S. conflicts around crypto assets involved the Howey Test, unregistered securities issuance, and whether trading platforms were illegally matching securities trades. If the innovation exemption is implemented, it may open a formal front door for compliant ATSs, registered brokers, transfer agents, qualified custodians, and on-chain issuance platforms. Securitize, Ondo, Robinhood, U.S. CEXs, and traditional exchange groups may all benefit.
The second level is the constraint: if tokenized stocks are to endure over the long term, they must answer the question of “what exactly does the token represent?” If it only represents price exposure, investors may not have voting rights, dividend rights, corporate action rights, or true bankruptcy-remote ownership of the underlying shares; if it truly represents the underlying shares, then there must be mechanisms for custody, registration, redemption, and shareholder-rights pass-through. Without this layer, tokenized stocks could become a replay of the FTX-style synthetic stocks of 2021: convenient on the surface, but in reality carrying price de-pegging risk, redemption risk, and insufficient legal rights.
3.3.2 Potential Scale of Tokenized Stocks
In terms of market impact, the short term is more likely to be a narrative catalyst than an immediate rewriting of the structure of the U.S. stock market. The chart shows that tokenized Treasuries grew from about $7.4 billion in 2025 to about $15 billion in 2026. The growth rate is fast, but relative to the U.S. stock market, which is measured in tens of trillions of dollars, it is still extremely small. In other words, tokenized securities are currently in a phase of “high growth, low penetration.” The real opportunities are not in trading volume shifting immediately, but in three scenarios: first, on-chain cash management; second, securities used as DeFi collateral; and third, global investors gaining 24/7 exposure to U.S. stocks.
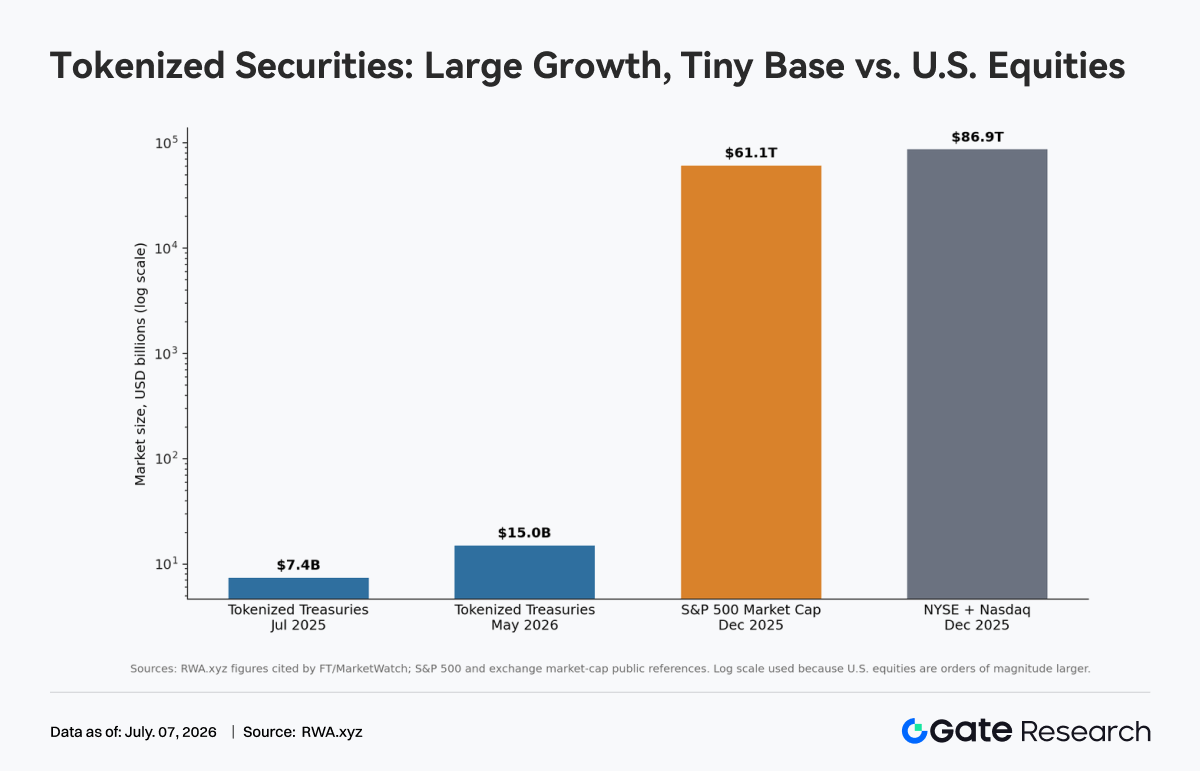
The biggest risk is market fragmentation. If the same stock is traded simultaneously on the NYSE, Nasdaq, ATSs, on-chain platforms, and offshore platforms, price discovery may be split. If arbitrage and clearing mechanisms are not smooth, volatility could be amplified. Another risk is regulatory arbitrage: crypto platforms may want to use “technological innovation” to reduce compliance costs, while traditional exchanges will demand equivalent regulatory standards. The SEC’s difficulty lies precisely in drawing the line between innovation and fair competition.
The conclusion is that if this policy is implemented, it will be a key step for RWA to move from “tokenized Treasuries/funds” to “tokenized stocks,” but it is more like a financial market infrastructure pilot than a full opening for retail investors to trade U.S. stocks around the clock immediately. What truly determines success or failure is not blockchain performance, but whether shareholder rights, custody and redemption, settlement finality, information disclosure, and cross-market regulation can form a closed loop.
Data Source:
Gate Research is a comprehensive blockchain and cryptocurrency research platform that provides deep content for readers, including technical analysis, market insights, industry research, trend forecasting, and macroeconomic policy analysis.
Disclaimer
Investing in cryptocurrency markets involves high risk. Users are advised to conduct their own research and fully understand the nature of the assets and products before making any investment decisions. Gate is not responsible for any losses or damages arising from such decisions.