Summary
-
In June 2026, the cryptocurrency market failed to extend May's recovery rally. BTC and ETH both declined by more than 20% during the month, while major assets including BNB, XRP, DOGE, and ADA also came under broad selling pressure, indicating that the correction reflected a system-wide contraction in market risk appetite rather than isolated asset-specific weakness.
-
The market was characterized by broad-based declines, significant performance divergence, and distorted average returns. Among the 493 valid tokens in the Top 500 universe, 126 gained, 350 declined, and 17 remained broadly unchanged, with losers accounting for 70.99% of the sample.
-
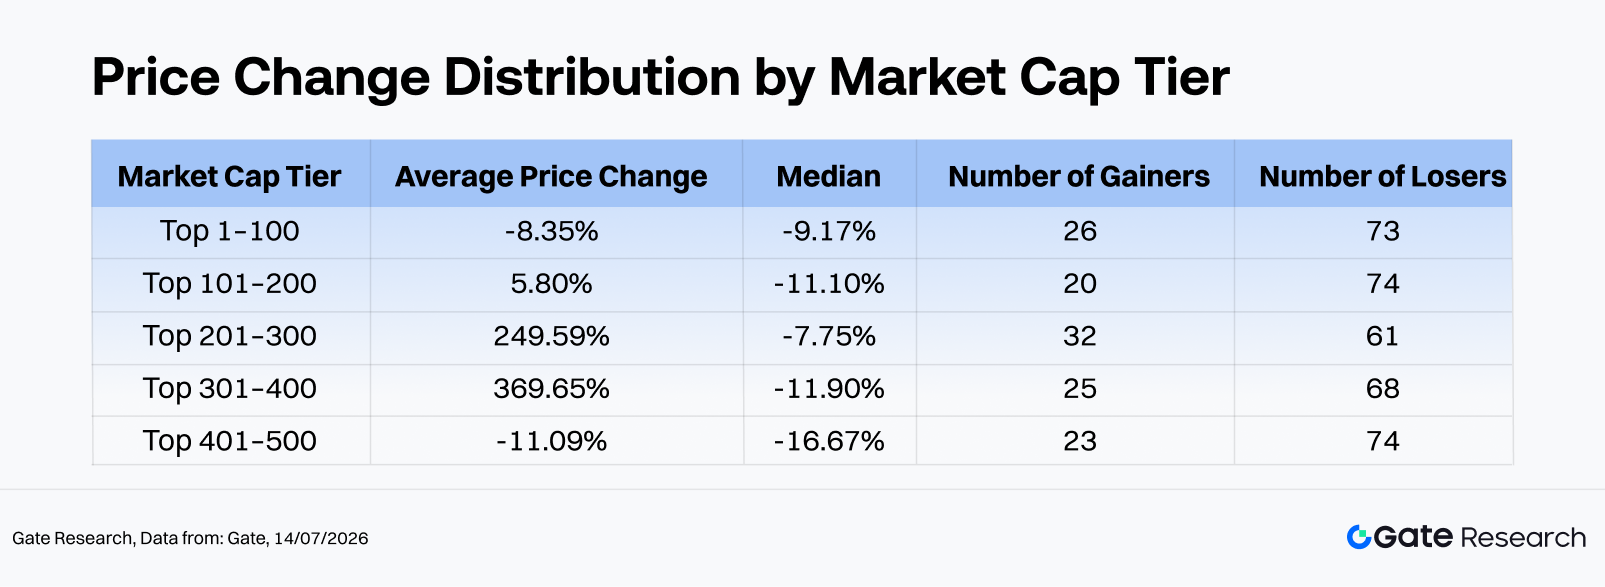
Across market-cap tiers, the Top 1–100 recorded an average return of -8.35% and a median return of -9.17%, while the Top 401–500 posted an average return of -11.09% and a median return of -16.67%. Although the Rank 201–400 segment saw its average return significantly boosted by extreme outliers such as CYDX and ANSEM, the majority of tokens still declined, illustrating a classic market structure in which a handful of explosive gainers masked widespread losses.
-
The top gainers were dominated by low-cap, high-volatility, event-driven tokens, led by CYDX (+35,729.13%), ANSEM (+23,901.60%), and VELVET (+1,548.44%). In contrast, the worst performers were largely assets affected by fading liquidity, weakening narratives, or a lack of fresh catalysts, with H (-84.36%) and M (-80.17%) recording the steepest declines.
-
In terms of trading activity, the 450 valid samples recorded an average Volume Spike of 2.54x, while the median was only 0.49x. Only 17 tokens experienced trading volume increases exceeding 3x, and just 8 tokens surpassed 10x. TEMPLE (289.05x), CX (259.13x), and MTBILL (128.15x) ranked among the largest volume surges. Notably, CX, VELVET, and SYN exhibited synchronized increases in both price and trading volume, whereas tokens such as ELF and CELO experienced high-volume selloffs, signaling potential distribution activity or mounting liquidity pressure.
1. Crypto Market Overview
Following May's recovery, the global cryptocurrency market weakened again in June 2026, with total market capitalization falling from approximately $2.56 trillion on June 1 to $2.16 trillion on June 30, representing a 15.74% monthly decline. The market peaked on June 1 and bottomed on June 29, suggesting that selling pressure persisted throughout nearly the entire month before showing limited signs of stabilization toward month-end.
BTC declined from around $73,570 at the beginning of the month to an intramonth low of approximately $58,189, before closing near $58,519, down roughly 20.5% for June and approaching its lowest price range since 2024. Risk appetite deteriorated markedly as capital continued rotating away from crypto assets toward AI, semiconductors, and high-profile IPO themes. The relationship between Bitcoin and U.S. technology equities shifted from being a supportive factor in May to becoming a source of downside pressure in June. Spot Bitcoin ETFs continued to experience net outflows. Public reports indicated that major products remained under sustained redemption pressure from late May through early June, with IBIT alone recording approximately $3.1 billion in outflows between May 18 and June 3, while total Bitcoin fund outflows over six consecutive weeks reached roughly $5–6 billion. Institutional positioning therefore evolved from the "buy-then-sell" pattern seen in May into persistent risk reduction throughout June.
On the macro front, the market narrative shifted from "a weaker U.S. dollar and improving risk sentiment" to "higher-for-longer interest rates, geopolitical risks, and the repricing of risk assets." The hawkish policy stance adopted by newly appointed Federal Reserve Chair Kevin Warsh reduced expectations for near-term rate cuts. Combined with a temporary cooling of the AI trade, escalating geopolitical tensions, and stronger-than-expected U.S. employment data, higher Treasury yields and a stronger U.S. dollar weighed heavily on crypto assets as high-beta risk investments. On the regulatory side, although the CLARITY Act continued to serve as the primary framework for digital asset market structure reform, uncertainty surrounding its passage this year meant that regulatory optimism provided far less support than capital outflows and macroeconomic headwinds.
On-chain activity also softened. According to DeFiLlama, total DeFi TVL declined from approximately $80.1 billion at the end of May to $70.4 billion by June 30, a monthly decrease of roughly 12.1%, largely reflecting the passive contraction of collateral values as major crypto assets declined. Meanwhile, the total stablecoin market capitalization remained above $300 billion, reaching approximately $311.7 billion by mid-July. USDT, with roughly $184.2 billion outstanding, continued to account for around 60% of the market, indicating that liquidity largely remained within the crypto ecosystem but shifted toward defensive positioning rather than risk-taking. According to DeFiLlama, total DEX spot trading volume reached approximately $222.7 billion during June, averaging $7.4 billion per day, demonstrating resilient trading activity despite the broader market downturn. However, trading became increasingly concentrated in leveraged and event-driven strategies. On-chain perpetual platforms such as Hyperliquid remained highly active amid geopolitical volatility, with short-lived surges in contracts linked to SpaceX and crude oil, highlighting that on-chain derivatives had become the primary venue for speculation and risk transfer during this correction.
Major cryptocurrencies broadly declined during June. BTC and ETH both lost more than 20%, while BNB and XRP fell 21.14% and 20.54%, respectively. SOL proved relatively resilient, declining only 8.81%, whereas more volatile large-cap assets such as DOGE (-26.85%), ADA (-38.06%), BCH (-33.65%), and XLM (-32.70%) experienced substantially deeper losses, illustrating that higher-beta assets were hit harder as market risk appetite deteriorated.
Unlike May's broad-based recovery, June was characterized by widespread declines accompanied by isolated speculative rallies. Stablecoins and a limited number of RWA and yield-oriented assets remained comparatively resilient, while select mid- and small-cap tokens—including CYDX, ANSEM, and VELVET—generated extraordinary returns. Although short-term trading opportunities persisted, they were concentrated in low-liquidity, event-driven tokens rather than broad beta exposure.
Overall, the June market exhibited three defining characteristics: broad declines, significant performance dispersion, and distorted averages. Among the 493 valid tokens, 126 gained, 350 declined, and 17 were largely unchanged, meaning only 25.56% of tokens posted positive returns while 70.99% finished lower.
Market Cap Tier Analysis
-
Top 1–100: Despite representing the most liquid segment of the market, large-cap tokens failed to provide meaningful downside protection in June. Structural outperformers included BEAT (+133.5%), ADI (+50.9%), LIT (+35.8%), DEXE (+22.1%), and WLD (+20.9%), while major underperformers included M (-80.2%), ADA (-38.1%), MNT (-35.6%), BCH (-33.7%), and XLM (-32.7%), highlighting considerable divergence even among blue-chip assets.
-
Ranks 101–200: Although the median return was -11.10%, the average was artificially lifted to +5.80% by VELVET's (+1,548.4%) extraordinary rally. Excluding VELVET, positive contributors included GWEI (+63.3%), LAB (+54.0%), and JTO (+43.3%), while CHZ (-43.6%), KITE (-43.2%), and IOTA (-42.2%) suffered steep declines, suggesting that mid-cap projects without fresh catalysts remained under significant valuation pressure.
-
Ranks 201–300: The median return was -7.75%, but the average surged to +249.59%, driven by exceptional outliers including ANSEM (+23,901.6%), CX (+983.4%), BTW (+296.4%), and BP (+217.2%). This tier became one of the primary sources of average-return distortion, while severe losses in H (-84.4%), EDGE (-78.0%), and NEX (-45.9%) underscored persistent downside risks.
-
Ranks 301–400: Despite a median return of -11.90%, extraordinary gains by CYDX (+35,729.1%), SYN (+1,039.8%), BAS (+110.3%), MAGMA (+70.9%), and MWC (+55.1%) pushed the average to +369.65%. This segment displayed the greatest imbalance, where a handful of explosive rallies sharply distorted averages while significant losses in HOME (-51.7%), RIVER (-44.4%), and WAL (-43.1%) highlighted continued liquidity-driven downside risk.
-
Ranks 401–500: This tier recorded the weakest median performance across all market-cap segments. Although VIT (+110.6%), DEGEN (+68.7%), and NAT (+36.9%) delivered localized upside, substantial declines in AZTEC (-44.8%), DEEP (-42.0%), and PURR (-39.5%) reflected the vulnerability of lower-cap assets amid weakening liquidity.
Note: Market-cap groupings are based on CoinGecko rankings. The top 500 tokens were divided into groups of 100 by market-cap rank (e.g., 1–100, 101–200, etc.). Price performance was measured between May 1 and May 31, 2026, using daily closing prices. Results may differ from calculations based on intraday averages or price extremes. Extremely low-priced tokens that generated distorted returns due to pricing noise were excluded from average-return calculations.
2.1 Top Gainers and Losers
2.1.1 Top Gainers: Extreme Long-Tail Outliers Distorted the Average
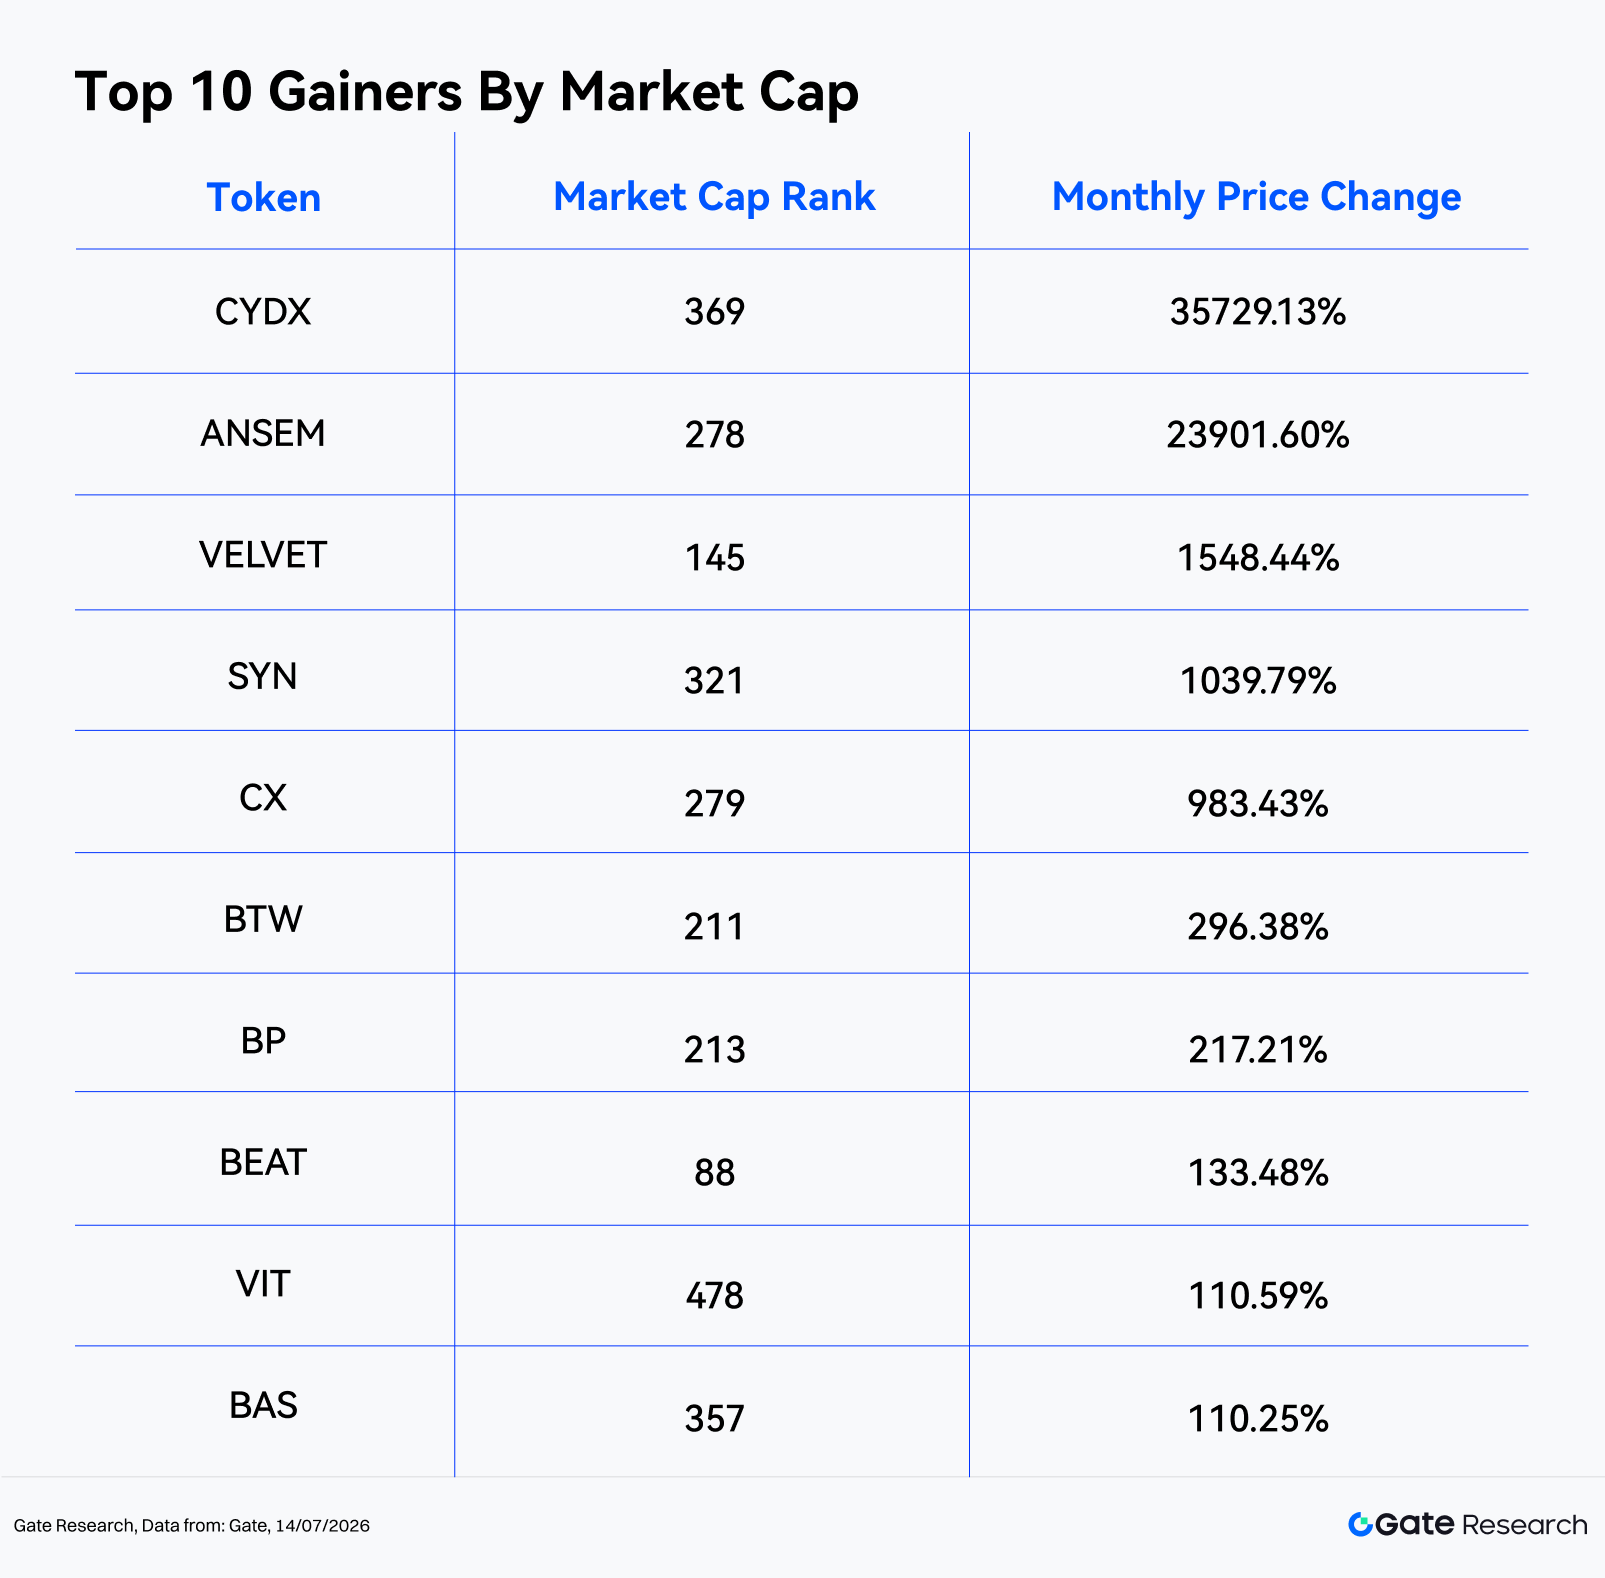
June's top gainers were overwhelmingly concentrated among lower-market-cap and lower-ranked tokens. CYDX ranked first with a gain of +35,729.13%, followed by ANSEM at +23,901.60%. Both represented exceptional event-driven rallies and had an outsized impact on the overall sample average. VELVET (+1,548.44%), SYN (+1,039.79%), and CX (+983.43%) also exhibited pronounced parabolic price surges.
SYN (+1,039.8%, Market Cap Rank #321) belongs to the cross-chain interoperability and bridging sector. Its strong performance in June was driven by renewed market interest in cross-chain infrastructure, representing a typical "low market cap + high turnover + narrative rotation" rally. As Synapse has a well-defined use case in cross-chain asset transfers, investors were more inclined to view it as an infrastructure play capable of outperforming during a weak market. However, given its substantial short-term appreciation, profit-taking pressure should be monitored closely.
BP (+217.2%, Market Cap Rank #213) is an asset within the Backpack ecosystem. It attracted significant capital during the month as narratives surrounding exchanges, crypto wallets, and consumer-facing crypto platforms gained momentum. Compared with pure meme tokens, BP offers a clearer platform ecosystem narrative. Nevertheless, its relatively low market-cap ranking implies higher liquidity elasticity, meaning that its price appreciation was primarily driven by concentrated capital inflows. Whether the rally can be sustained will depend on continued user growth within the Backpack ecosystem, trading activity, and further expansion of token utility.
Looking at the overall distribution, only BEAT ranked within the Top 100 market-cap assets, while nearly all other top gainers were ranked outside the Top 200. This suggests that June lacked a broad, blue-chip-led market rally, with capital instead concentrating on smaller-cap assets offering higher potential returns. Although these trades delivered exceptional short-term gains, they were also accompanied by limited market depth, wider slippage, and significantly higher downside risk.
2.1.2 Top Losers: Liquidity Withdrawal and Fading Narratives
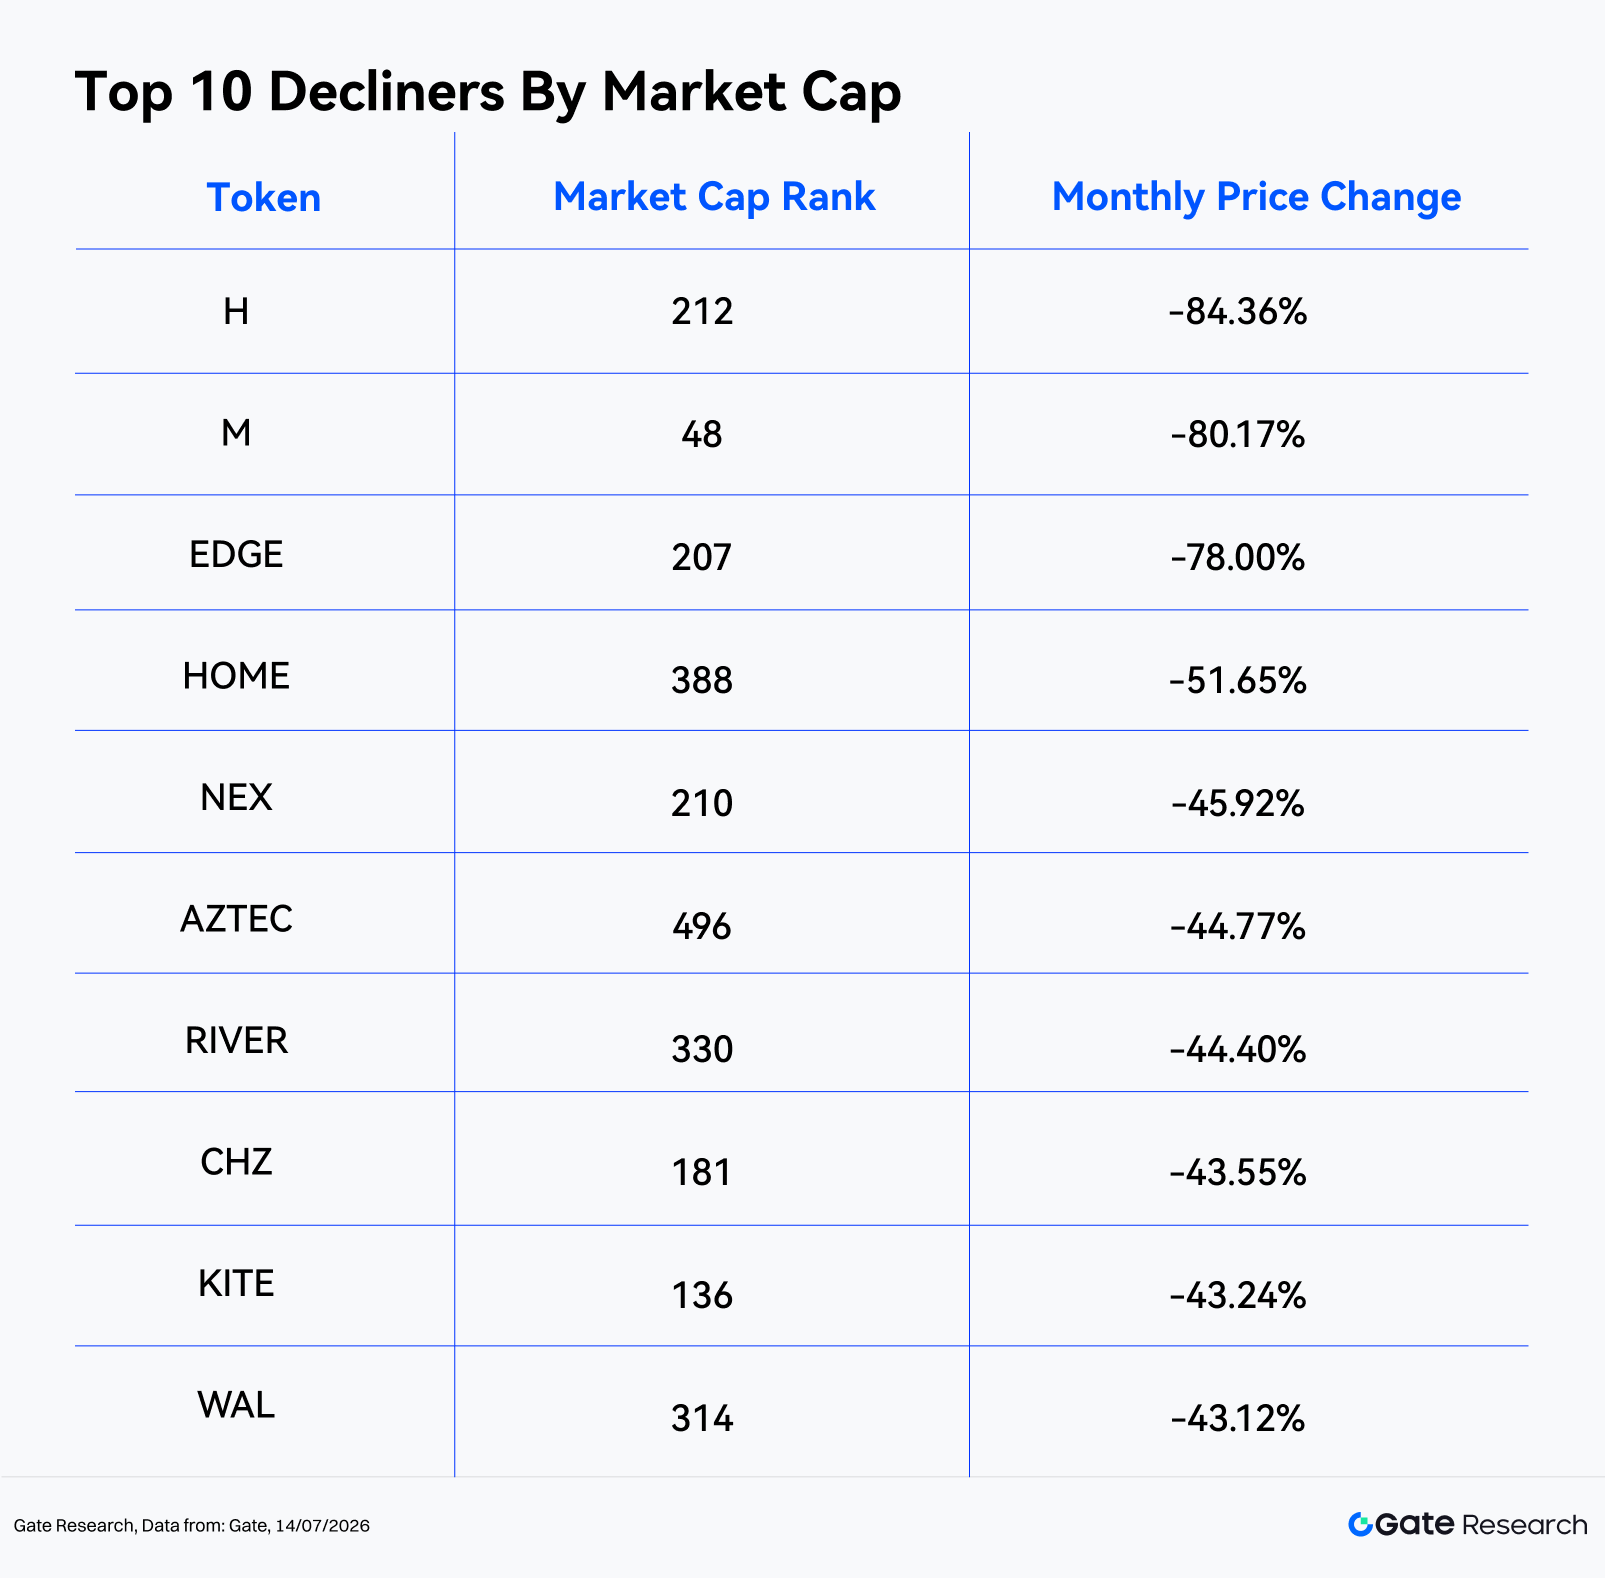
The worst-performing tokens also displayed clear long-tail characteristics. H (-84.36%), M (-80.17%), and EDGE (-78.00%) recorded the steepest declines, while HOME, NEX, AZTEC, RIVER, CHZ, KITE, and WAL all fell by more than 40%. Notably, M ranked within the Top 100 by market capitalization, indicating that the correction extended beyond small-cap assets and also affected larger-cap projects through concentrated selling pressure.
M (-80.2%, Market Cap Rank #48) is the native token of the MemeCore ecosystem and experienced one of the most event-driven declines of the month. The token suffered an intraday crash of approximately 70%, accompanied by widespread market concerns regarding insider manipulation, liquidity structure, and exchange due diligence. These factors rapidly eroded investor confidence. Having previously entered the Top 100 by market capitalization, M carried relatively elevated valuation expectations. Once its core narrative and price stability came under question, selling pressure intensified far more rapidly than for typical long-tail meme tokens, ultimately resulting in a sharp valuation reset driven by both deteriorating sentiment and declining confidence.
CHZ (-43.6%, Market Cap Rank #181) represents the sports fan token ecosystem centered on Chiliz and Socios.com. During June, CHZ lacked major sporting events or platform-level catalysts, while the overall decline in market risk appetite encouraged capital to rotate away from mid-cap assets with slower growth trajectories and relatively limited short-term trading opportunities.
Overall, the weakest performers shared several common characteristics: a lack of new catalysts, previously stretched valuations or exhausted narratives, and insufficient liquidity support during periods of capital outflows. In an environment where more than 70% of tokens declined, weaker assets were especially vulnerable to negative feedback loops, with initial losses often leading to continued selling pressure.
Within the Top 100 cryptocurrencies by market capitalization, relatively few assets delivered strong performance. BEAT (+133.48%) significantly outperformed the group, followed by ADI (+50.90%), LIT (+35.84%), DEXE (+22.07%), and WLD (+20.90%). AAVE, RAIN, JUP, and BDX also remained in positive territory, although their gains were far more modest than those of the extreme long-tail outperformers.
On the downside, M (-80.17%) was the largest drag among the Top 100 assets. ADA (-38.06%), MNT (-35.64%), BCH (-33.65%), XLM (-32.70%), ALGO (-32.65%), PEPE (-31.26%), and DOT (-30.36%) also posted significant losses. The widespread correction across high-beta large-cap assets was one of the clearest indicators of deteriorating market sentiment throughout June.
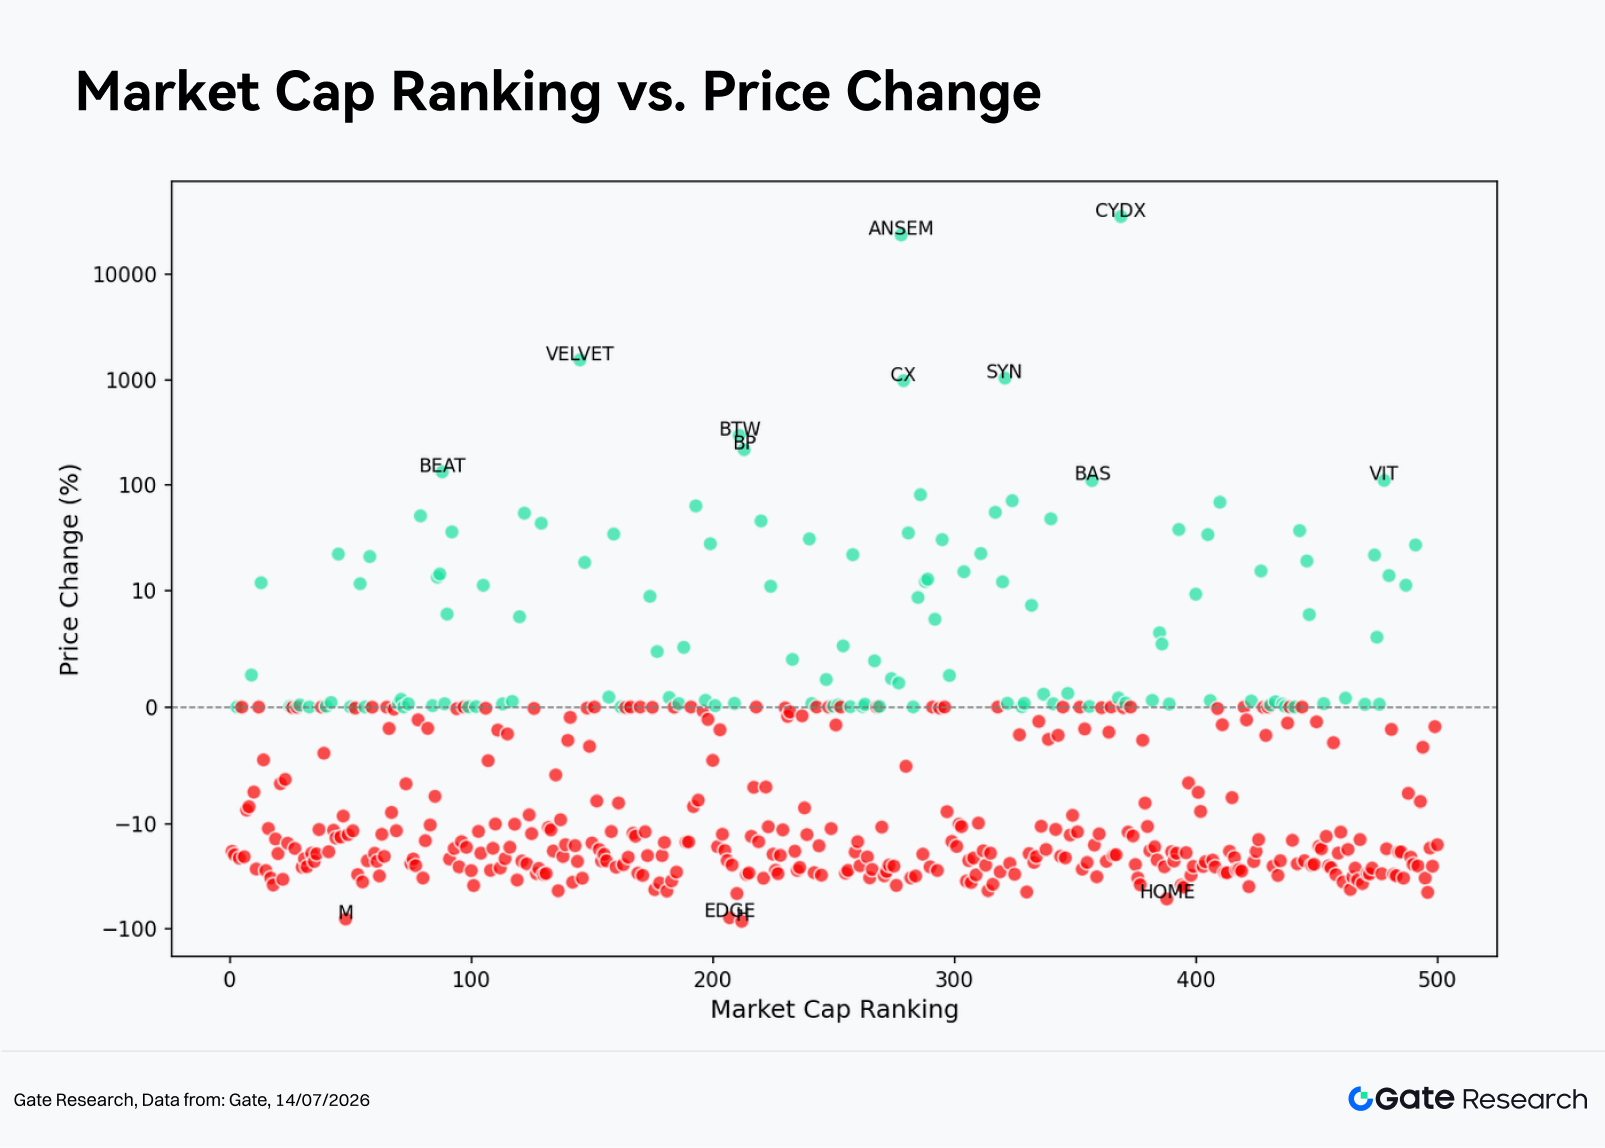
From the scatter plot of market capitalization rank (X-axis) versus monthly return (Y-axis), negative returns were broadly distributed across nearly every market-cap segment during June. Among the Top 100 tokens, 73 posted negative returns, indicating that large-cap assets failed to provide meaningful downside protection. Although a handful of extreme outliers appeared in the Rank 200–400 range and became the primary drivers behind the inflated monthly average return, the median return for this segment remained negative, suggesting that the vast majority of tokens did not participate in these exceptional long-tail rallies.
In other words, the defining characteristic of June was not that lower-cap tokens broadly outperformed, but rather that a small number of lower-cap tokens generated extraordinary gains while most continued to decline. Investors focusing solely on average returns would likely overestimate the market's overall profitability. By contrast, median returns and the percentage of advancing tokens provide a much clearer picture that market liquidity and risk appetite remained defensive.
Both the average and median returns for the Top 1–100 segment were negative, confirming that large-cap assets failed to serve as defensive holdings. Although the Top 101–400 segments appeared relatively stronger based on average returns, their median returns also remained negative. This discrepancy was largely driven by a handful of exceptional performers, including ANSEM, CYDX, SYN, and CX, which significantly distorted the averages. Meanwhile, the Top 401–500 segment exhibited both greater downside tail risk and a deeper median decline, highlighting that lower-cap tokens were more susceptible to sharp corrections in the absence of sustained capital inflows.
3. Analysis of Volume Expansion During This Market Cycle
3.1 Trading Volume Growth Analysis
Using the average daily trading volume in May as the baseline and comparing it with daily trading volume toward the end of June, we calculate each token's Volume Spike. A higher Volume Spike indicates that trading activity increased substantially relative to the calmer conditions at the beginning of the period, reflecting a rapid rise in both market participation and investor attention.
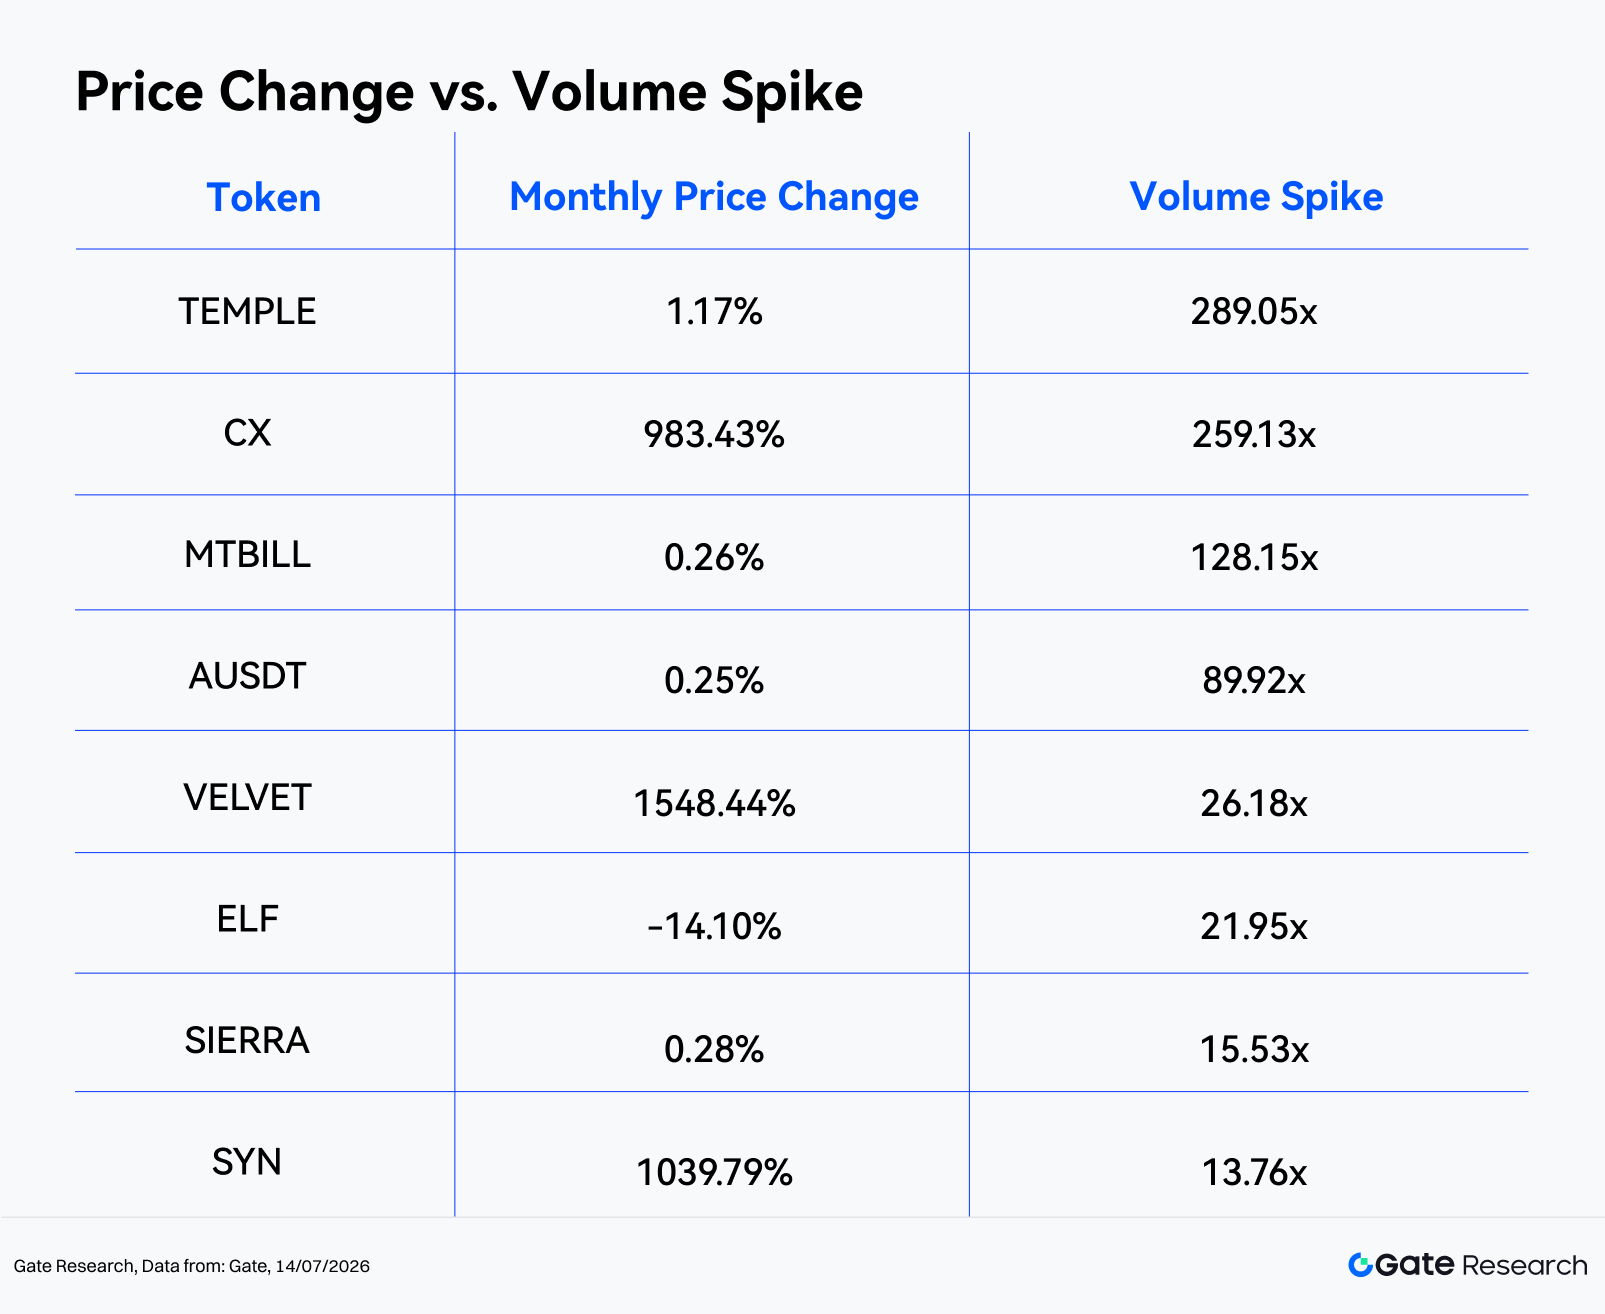
A total of 450 tokens had valid trading volume data during June. The sample recorded an average Volume Spike of 2.54x, while the median was only 0.49x, indicating that trading activity did not expand for most tokens and that the average was once again skewed upward by a small number of exceptional outliers. Throughout the month, only 17 tokens recorded volume increases exceeding 3x, 11 tokens exceeded 5x, and just 8 tokens surpassed 10x.
Among the largest volume surges, TEMPLE (289.05x), CX (259.13x), MTBILL (128.15x), AUSDT (89.92x), and VELVET (26.18x) stood out. However, not every surge in trading volume represented a directional trading opportunity. Tokens such as MTBILL and AUSDT experienced little price movement despite significant volume increases, suggesting that their activity was primarily driven by on-chain portfolio rebalancing, stable asset allocation, or short-term arbitrage. In contrast, CX, VELVET, and SYN exhibited both substantial volume expansion and strong price appreciation, making them more representative of genuine breakout trades.
Overall, the tokens with the largest volume spikes can be divided into two broad categories. The first consists of stablecoins, RWA-related assets, and yield-bearing tokens, where higher trading volumes primarily reflected on-chain rebalancing, arbitrage, and capital migration rather than directional price moves. The second includes DeFi, cross-chain infrastructure, and mid-to-small-cap risk assets, where strong volume expansion accompanied by significant price gains is more indicative of aggressive buying interest. Among these, CX, VELVET, and SYN deserve particular attention, as they combined more than 10x volume growth with decisive price breakouts, typically reflecting narrative rotation, improving trading activity, or concentrated short-term capital inflows.
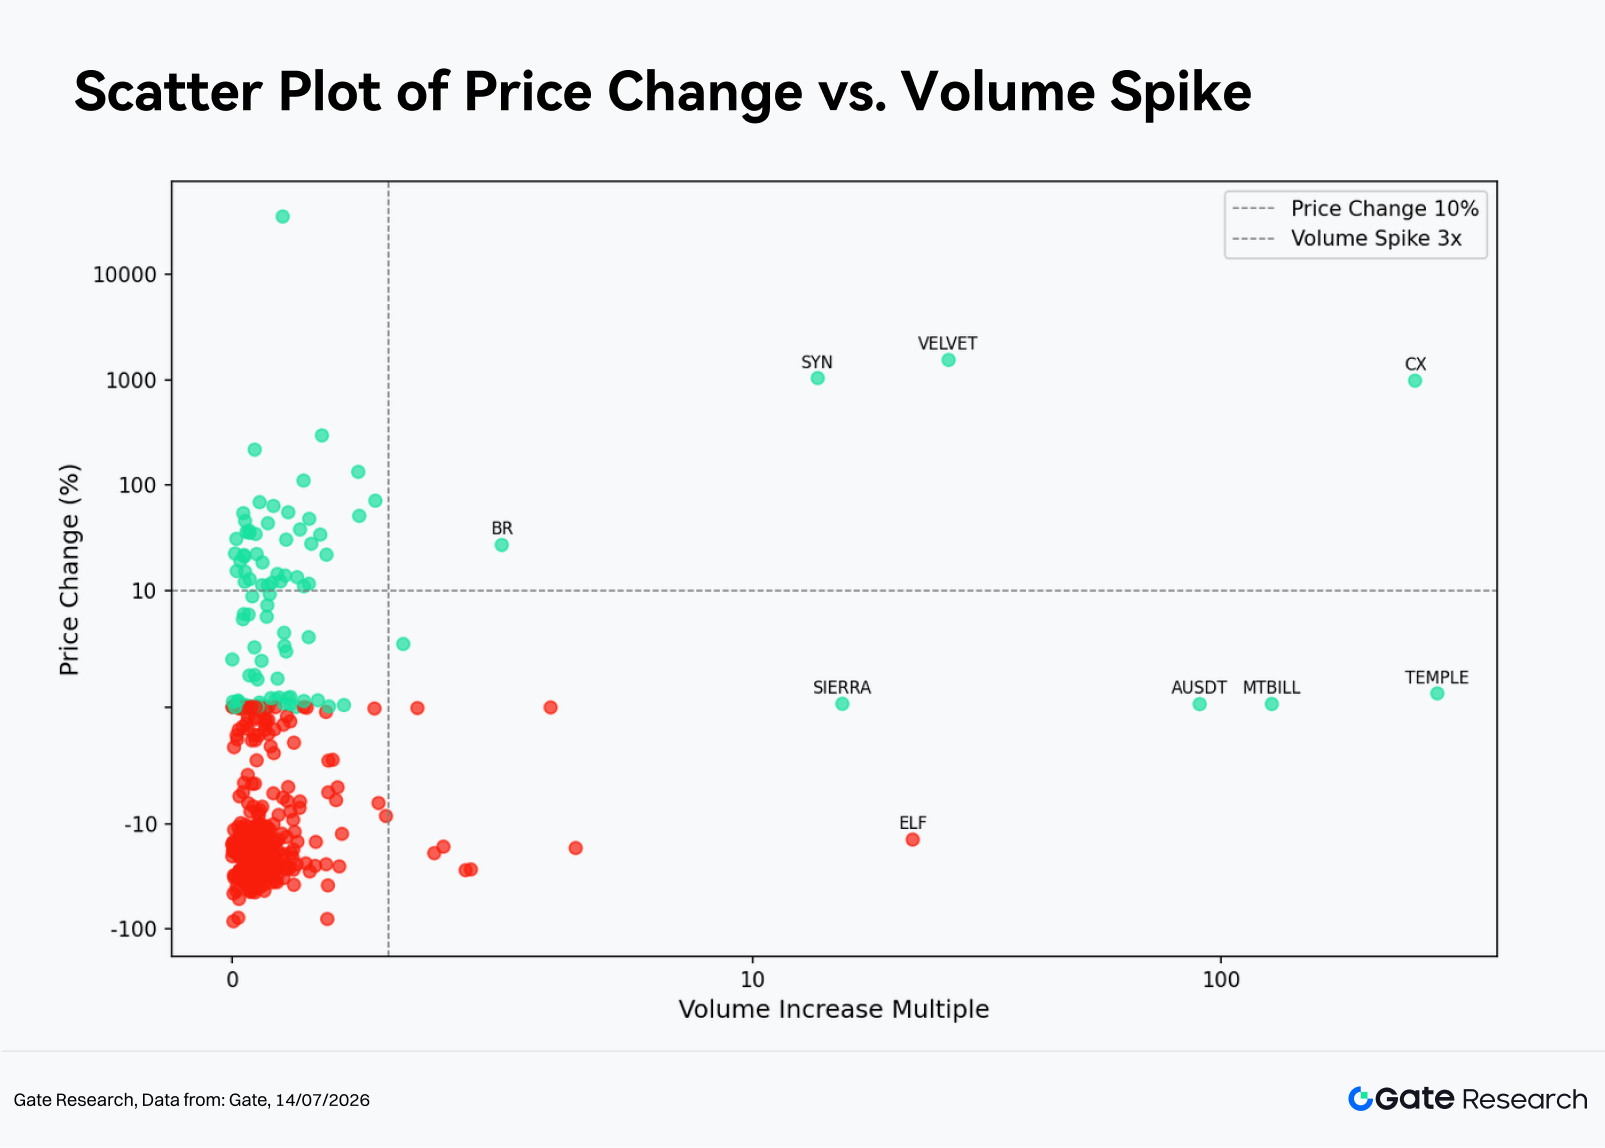
From the scatter plot, June exhibited a clear pattern of high concentration on the left side and extreme dispersion on the right. Most tokens clustered within the 0–3x Volume Spike range, indicating that trading activity did not expand broadly across the market. The truly meaningful directional signals were concentrated in the 10x+ ultra-high-volume segment. Even within this group, however, it is important to distinguish between genuine price-and-volume breakouts and high-volume moves without price appreciation, which often represent false signals.
-
Within the 0–3x low-volume range, 433 tokens fell into this category, including 98 gainers and 334 losers, with a median return of -13.09%. For the vast majority of these tokens, trading volume remained relatively subdued, and price movements were driven primarily by the broader market correction and competition among existing liquidity, resulting in a high level of market noise. Although individual tokens such as CYDX (+35,729.1%, 1.0x), BTW (+296.4%, 1.7x), BP (+217.2%, 0.4x), and BEAT (+133.5%, 2.4x) posted extraordinary gains, their trading volumes did not increase proportionally. These moves were more reflective of the price elasticity inherent in low-liquidity assets than evidence of broad capital inflows.
-
The 3–10x medium-volume range contained only nine valid samples, with two gainers and seven losers, producing a median return of -16.47%. Unlike May, when this volume range often signaled successful breakouts, June was instead characterized by high-volume declines. Tokens including CELO (-17.0%, 6.6x), GLM (-27.1%, 4.6x), SNX (-27.6%, 4.5x), XCN (-16.5%, 4.1x), and HASH (-19.0%, 3.9x) all experienced rising trading volume alongside falling prices, suggesting stronger selling pressure and position liquidation. The few positive examples, such as BR (+26.9%, 5.2x) and QFI (+5.4%, 3.3x), were too limited to indicate a broad bullish signal within this volume tier.
-
The 10x+ ultra-high-volume segment contained eight tokens, of which seven advanced and one declined, forming two distinct groups. The first consisted of genuine breakouts represented by VELVET (+1,548.4%, 26.2x), SYN (+1,039.8%, 13.8x), and CX (+983.4%, 259.1x), all of which exhibited strong gains accompanied by exceptional volume expansion, indicating aggressive buying interest. The second group included TEMPLE (+1.2%, 289.1x), MTBILL (+0.3%, 128.1x), AUSDT (+0.2%, 89.9x), and SIERRA (+0.3%, 15.5x), where trading volume surged while prices remained largely unchanged. In these cases, the activity was more likely driven by on-chain portfolio rebalancing, arbitrage, or capital migration, limiting their directional significance. In addition, ELF (-14.1%, 21.9x) represented a high-volume decline, warranting caution as it may reflect distribution during periods of improved liquidity.
3.3 Correlation Analysis
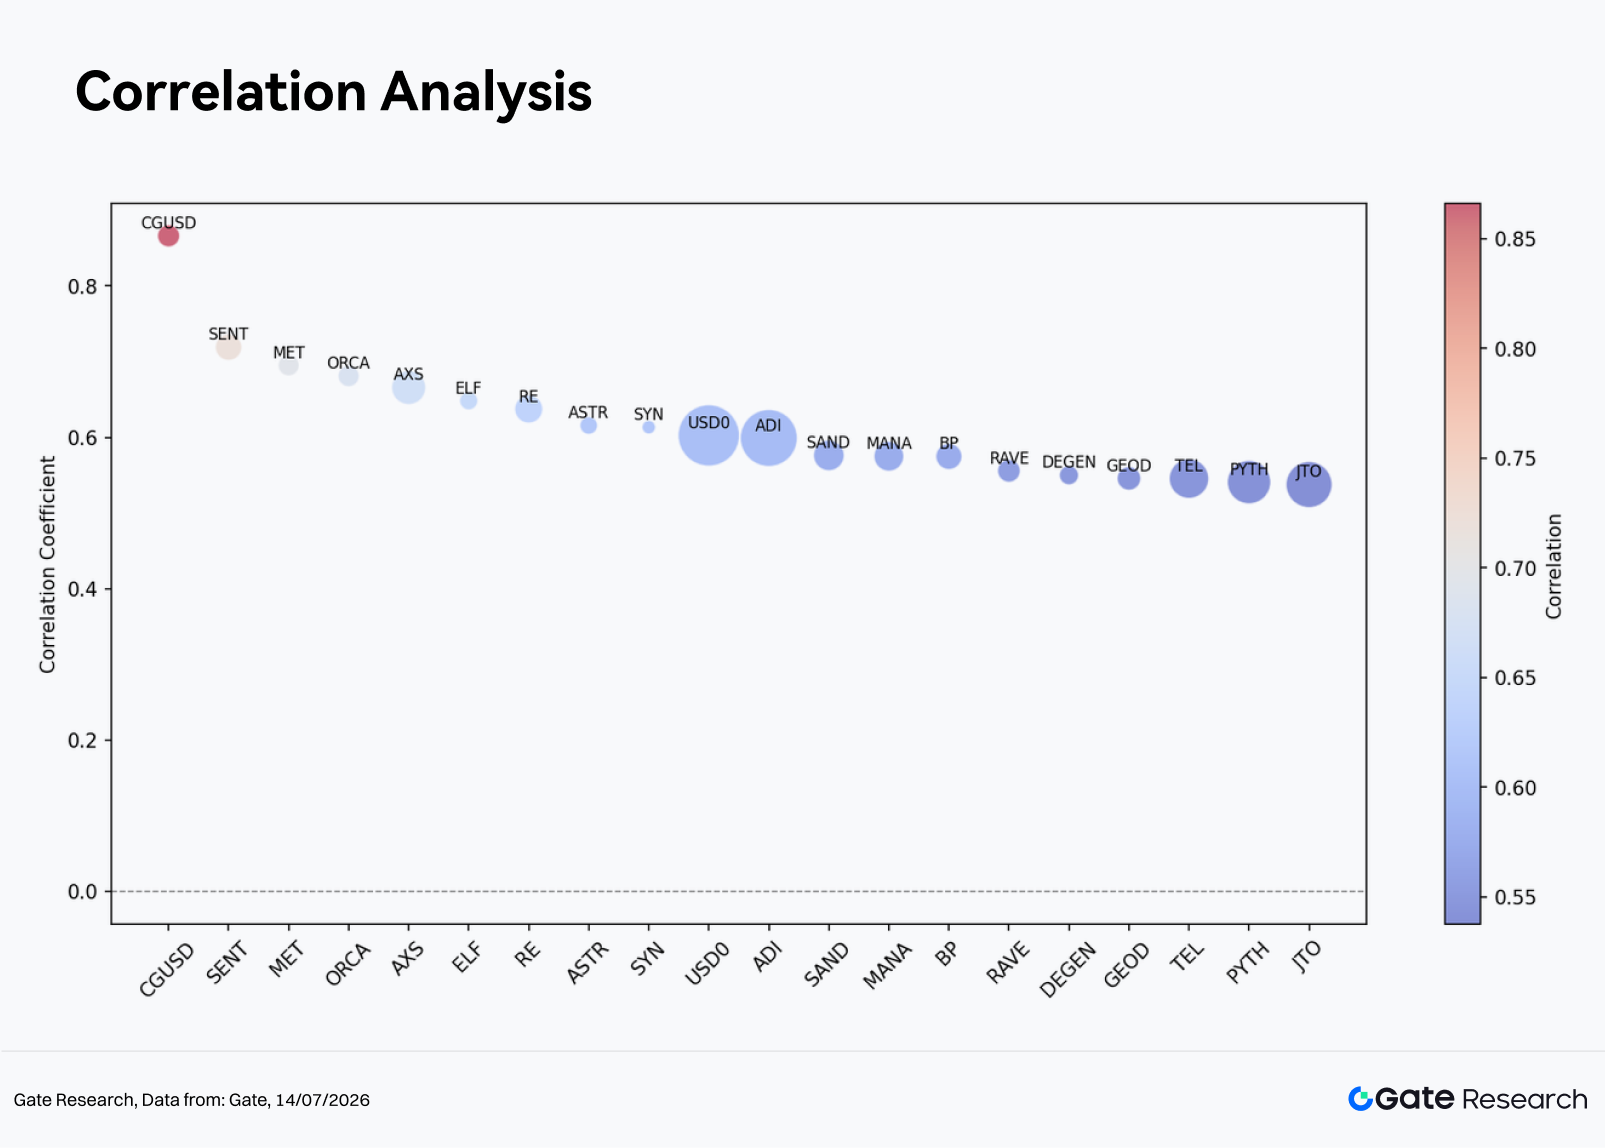
After examining the relationship between trading volume and price performance, this report further analyzes their statistical correlation. To measure the impact of trading activity on price movements, we use trading volume growth divided by market capitalization as a proxy for relative market activity and calculate its correlation with price returns to identify the categories of assets most sensitive to capital flows.
In terms of price-volume correlation, CGUSD (0.87), SENT (0.72), MET (0.70), ORCA (0.68), AXS (0.67), and ELF (0.65) ranked among the highest. A stronger correlation indicates that changes in trading activity explain a larger portion of price movements. However, the interpretation should also consider asset type, as the high correlation observed in certain stable or yield-bearing assets may simply reflect portfolio rebalancing rather than the emergence of a sustained market trend.
From a trading perspective, mid-cap assets with active communities and a noticeable increase in turnover during the month tended to exhibit stronger price-volume relationships. Conversely, when trading volume expands rapidly after a significant price decline, investors should remain alert to the possibility that short-term trading activity is masking underlying liquidity stress.
4. Conclusion
June's cryptocurrency market can be summarized by one dominant theme: broad-based correction accompanied by isolated long-tail rallies. BTC, ETH, and most major cryptocurrencies declined together, while more than 70% of the Top 500 tokens generated negative monthly returns, indicating that the market has yet to enter a broad recovery phase. Although the sample's average return remained positive, the median return of -11.28% demonstrates that investors should avoid being misled by averages inflated by a handful of exceptional outperformers.
The month's opportunities were concentrated in two areas. The first consisted of long-tail tokens benefiting from strong event catalysts and concentrated short-term capital flows, such as VELVET, SYN, and CX. The second included mid- and small-cap assets where both trading volume and price improved simultaneously. However, these opportunities required precise timing, sufficient liquidity, and disciplined risk management, and should not be interpreted as evidence of a broad market reversal.
Looking ahead to July, the key question is whether major assets such as BTC and ETH can halt their prolonged decline and drive a higher percentage of gains among the Top 100 cryptocurrencies. A meaningful improvement in market quality would require expanding trading activity to spread from a handful of long-tail tokens toward large-cap assets. Otherwise, if elevated volume continues to concentrate in declining or range-bound tokens, the structural weakness observed throughout June is likely to persist.
Reference:
- CoinGecko, https://www.coingecko.com/
- Gate, https://www.gate.com/trade/BTC_USDT
- DeFiLlama, https://defillama.com/
- MarketWatch: https://www.marketwatch.com/story/crypto-token-plunges-70-taking-market-cap-below-1-billion-53ff5fe1
Gate Research is a comprehensive blockchain and cryptocurrency research platform that provides deep content for readers, including technical analysis, market insights, industry research, trend forecasting, and macroeconomic policy analysis.
Disclaimer
Investing in cryptocurrency markets involves high risk. Users are advised to conduct their own research and fully understand the nature of the assets and products before making any investment decisions. Gate is not responsible for any losses or damages arising from such decisions.