Summary
-
In May 2026, the crypto market staged a rebound following the $900B correction in Q1, with total market capitalization recovering to $2.81T. BTC posted a monthly return of -3.47% and remained down approximately 14.6% year-to-date, while ETH continued to trade more than 51% below its all-time high, suggesting that the quality of the recovery remains uncertain.
-
On-chain activity also improved, with DeFi TVL rising from approximately $84B to $93B during the month. Total stablecoin market capitalization remained elevated within the $309B–$315B range, while monthly perpetual futures volume exceeded $600B, far surpassing spot trading activity and highlighting persistent demand for leveraged speculation.
-
Among the Top 500 tokens, 54.8% recorded negative monthly returns. However, the sharp divergence between the average return (+11.28%) and the median return (-0.07%) indicates that gains were highly concentrated in low-cap, long-tail assets.
-
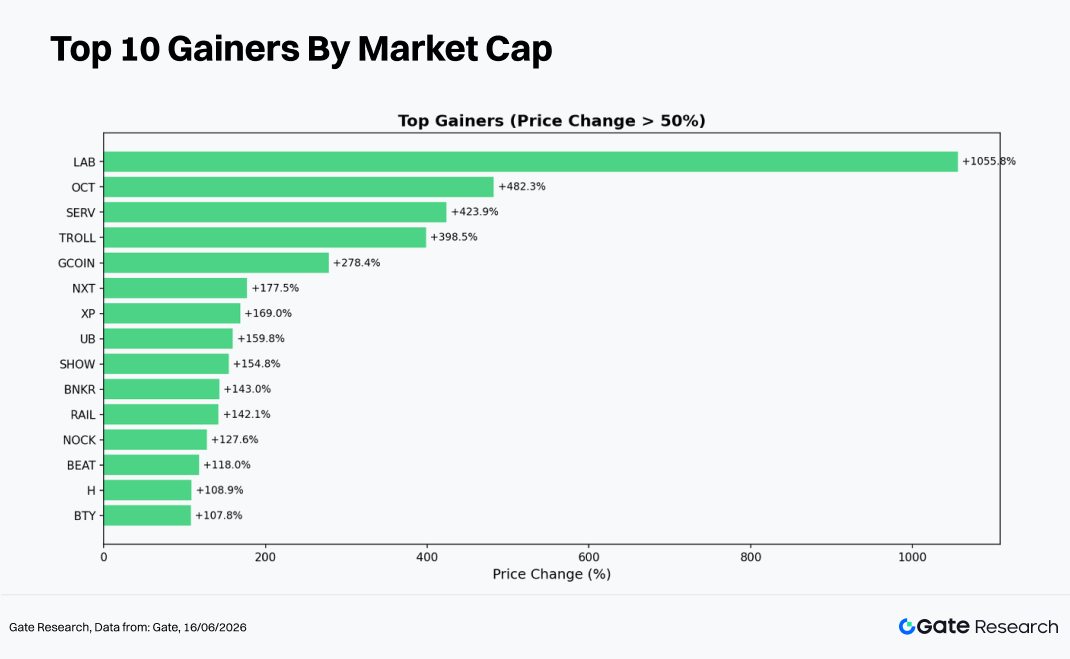
The best-performing narratives were concentrated in DeSci, AI, RWA, and Layer-1 ecosystems. Extreme outperformers such as LAB (+1,055.8%), OCT (+482.3%), and TROLL (+398.5%) were primarily concentrated in the Rank 300–500 segment, where two-way volatility risk was also the highest.
-
The win rate among the Top 100 tokens was close to 50/50, with blue-chip assets such as BTC (-3.4%) and ETH (-10.5%) weighing on overall market sentiment. BCH (-31.4%) and SKY (-19.6%) were among the largest decliners.
-
From a volume perspective, 454 tokens recorded higher trading activity with an average volume increase of 2.35x, while 76 tokens saw volume expand by more than 3x. Tokens exhibiting both price and volume expansion—such as ALLO (29.2x), XLM (25.4x), and SHOW (18.3x)—provided strong bullish signals, whereas tokens showing rising volume but declining prices, including EARNETH (16.7x) and DRV (12.0x), may indicate distribution and potential sell-side pressure.
-
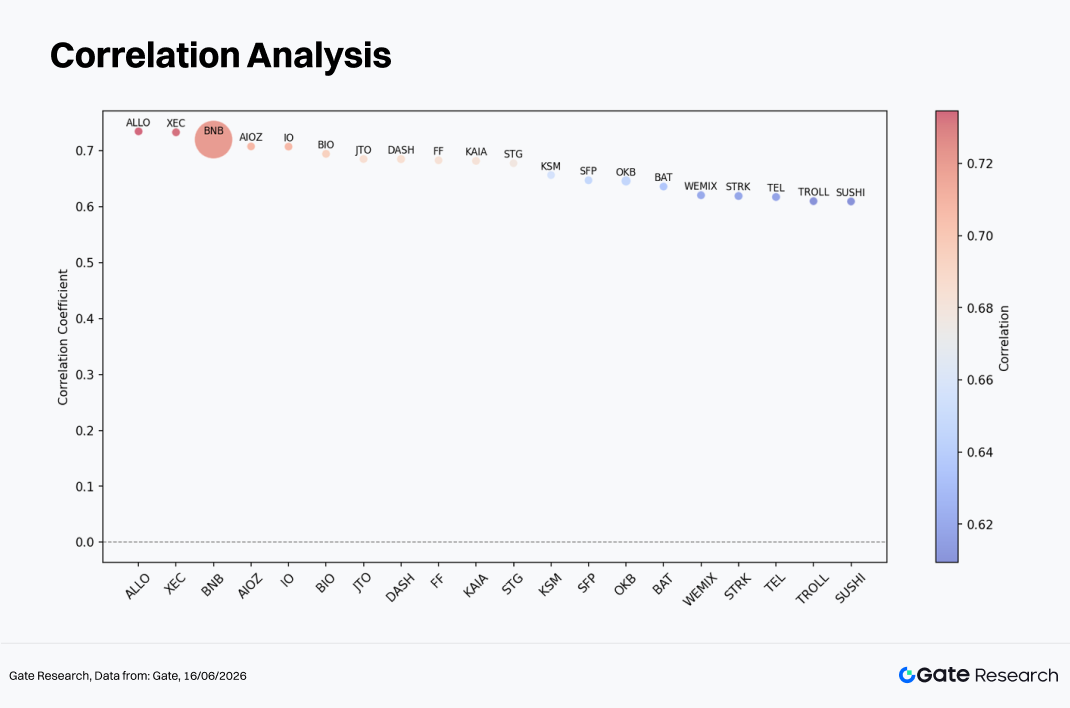
Correlation analysis shows that the relationship between trading activity and price performance generally ranged between 0.60 and 0.75 across the sample. BNB, ALLO, and XEC exhibited the strongest correlations, suggesting that volume changes have the greatest predictive value for price movements among mid-cap tokens.
1. Crypto Market Overview
In May 2026, the global crypto market entered a phase of recovery after experiencing a deep correction during Q1, when total market capitalization fell from $3.01T to a low of approximately $2.5T, erasing nearly $900B in value. By month-end, total market capitalization had recovered to around $2.81T. BTC rebounded as much as 17.3% from its April low, reaching an intramonth high of $82,305, before renewed risk-off sentiment pushed its monthly return back to -3.47%.
Spot Bitcoin ETFs recorded approximately $2.30B in net outflows during the month, marking the largest monthly outflow of the year. However, cumulative net inflows of nearly $977M during the five weeks spanning late April to early May provided substantial support in the first half of the month. Overall, institutional flows displayed a clear "risk-on early, risk-off later" pattern.
On the macro front, the Trump administration's decision to suspend the "Freedom Plan" and progress in negotiations with Iran weakened the U.S. dollar, while continued strength in AI-related equities improved broader risk sentiment. The crypto market benefited from this cross-asset risk-on environment. From a regulatory perspective, progress on the CLARITY Act helped establish a framework for classifying digital assets as commodities at the federal level.
On-chain data from DeFiLlama shows that total DeFi TVL stood at approximately $84B at the beginning of May, with Ethereum accounting for roughly 54% (about $45.4B). As market conditions improved, TVL gradually recovered, reaching approximately $93B by early June, representing a monthly increase of about 10.7%. This suggests that existing liquidity expanded alongside the appreciation of major crypto assets.
Meanwhile, total stablecoin market capitalization remained elevated within a range of $309B–$315B throughout the month. USDT continued to dominate with approximately $185B in supply and a market share of around 59%, while USDC maintained a market capitalization of roughly $75B. The stability of overall stablecoin supply indicates that on-chain liquidity remained broadly intact.
DEX spot trading volume is estimated at approximately $200B–$230B for the month, with average daily volume reaching around $876M on Ethereum and $740M on BNB Chain. In contrast, on-chain perpetual futures activity expanded rapidly. Hyperliquid averaged approximately $432B in monthly volume and accounted for an estimated 60–70% of total on-chain perpetual futures trading. Aggregate perpetual futures volume across all chains exceeded $600B during the month, with weekly growth rates consistently above 9%, underscoring the significantly stronger momentum in leveraged derivatives relative to spot markets.
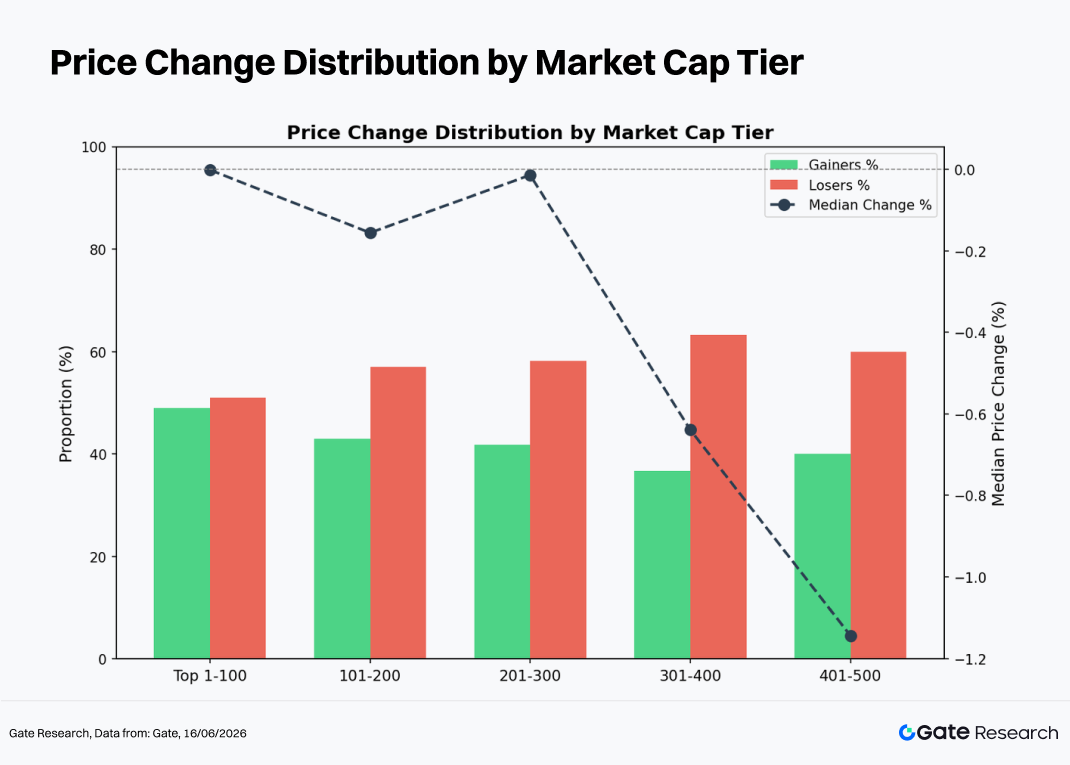
The current market cycle has been characterized by high dispersion and elevated volatility. As of May 2026, among the top 500 cryptocurrencies by market capitalization, 209 tokens posted gains, 272 declined, and 15 remained unchanged, meaning that 54.8% of the universe recorded losses. This suggests that the market remains in a phase of structural adjustment. However, a small number of extreme outperformers pushed the average return to +11.28%, while the median return stood at -0.07%, highlighting a significant divergence. The data suggests that gains were highly concentrated among low-cap, high-beta long-tail assets rather than being broadly distributed across the market.
From a market-cap segmentation perspective, performance varied significantly across different tiers, revealing a pattern of "strong volatility at both ends and heavier drag in the middle."
-
Top 1–100 by Market Cap: 49 tokens gained while 50 declined, resulting in a nearly balanced distribution. The median return was approximately 0%, while the average return reached +19.3%, boosted by extreme outliers such as LAB (+1,055.8%). As the most liquid segment of the market, it was weighed down by weakness in blue-chip assets such as BTC and ETH, although leading DeSci, AI, and select Layer-1 projects experienced notable catch-up rallies.
-
Ranks 101–200: 43 tokens gained and 55 declined, with the gain ratio falling to 43.9%. The median return was -0.16%, while the average return reached +4.7%. Explosive performances from tokens such as UB (+159.8%), RAIL (+142.1%), and H (+108.9%) contrasted sharply with steep declines in SKYAI (-47.0%) and NEX (-36.7%), reflecting substantial dispersion within the segment.
-
Ranks 201–300: 41 tokens gained and 51 declined. The median return was close to 0%, while the average return stood at +5.8%. The segment continued to exhibit a pattern in which a small number of strong performers—such as NOCK (+127.6%), ALLO (+92.1%), and TAG (+91.0%)—lifted overall averages while the majority of tokens traded sideways or slightly lower.
-
Ranks 301–400: 36 tokens gained and 58 declined, reducing the gain ratio to 38.3%. The median return was -0.64%, yet the average return surged to +12.0% due to extraordinary gains from TROLL (+398.5%), NXT (+177.5%), and XP (+169.0%). This tier displayed the most imbalanced return distribution.
-
Ranks 401–500: 40 tokens gained and 58 declined. The median return was -1.14%, while the average return reached +14.5%, reflecting the highest concentration of extreme outcomes. OCT (+482.3%), SERV (+423.9%), and GCOIN (+278.4%) delivered exceptional gains, while MEGA (-62.6%) and ASTEROID (-55.1%) suffered dramatic losses. This highlights the exceptionally high two-way risk present in low-cap assets.
Note: Market-cap groupings are based on CoinGecko rankings. The top 500 tokens were divided into groups of 100 by market-cap rank (e.g., 1–100, 101–200, etc.). Price performance was measured between May 1 and May 31, 2026, using daily closing prices. Results may differ from calculations based on intraday averages or price extremes. Extremely low-priced tokens that generated distorted returns due to pricing noise were excluded from average-return calculations.
2.1 Top Gainers and Losers
2.1.1 Top Gainers: Low-Cap Narrative Beta
The top gainers of this cycle were primarily driven by four themes: DeSci/AI, GameFi, Meme coins, and Layer-1 ecosystem recovery.
LAB (+1,055.8%, Rank 41) emerged as the biggest surprise performer. Positioned at the intersection of DeSci and AI, the token benefited from extremely limited liquidity and strong promotion by influential on-chain opinion leaders, producing a classic low-float momentum rally. However, the sustainability of such gains remains uncertain.
BEAT (+118.0%, Rank 38) combined Meme and RWA narratives, attracting speculative capital through rapid community-driven adoption.
VVV (+95.3%, Rank 87) is a DeFi yield protocol whose token appreciation was supported by both TVL growth and rising perpetual futures funding rates, providing a stronger fundamental foundation than many speculative rallies.
INJ (+91.9%, Rank 97) represented the Layer-1 category. Growth in both DApp activity and trading volume within the Injective ecosystem, combined with EVM compatibility upgrades, attracted institutional interest.
RAIN (+83.0%, Rank 14) benefited from a combination of exchange listings and lending-market expansion, resulting in a notable valuation re-rating.
Beyond these names, established assets such as NEAR (+72.4%), ZEC (+50.4%), and XLM (+44.0%) also delivered meaningful gains, largely driven by exchange-related catalysts and protocol upgrades.
Overall, the gainers list reflected a dual-track market structure in which high-beta, low-cap narrative trades coexisted with fundamentally supported DeFi and Layer-1 projects.
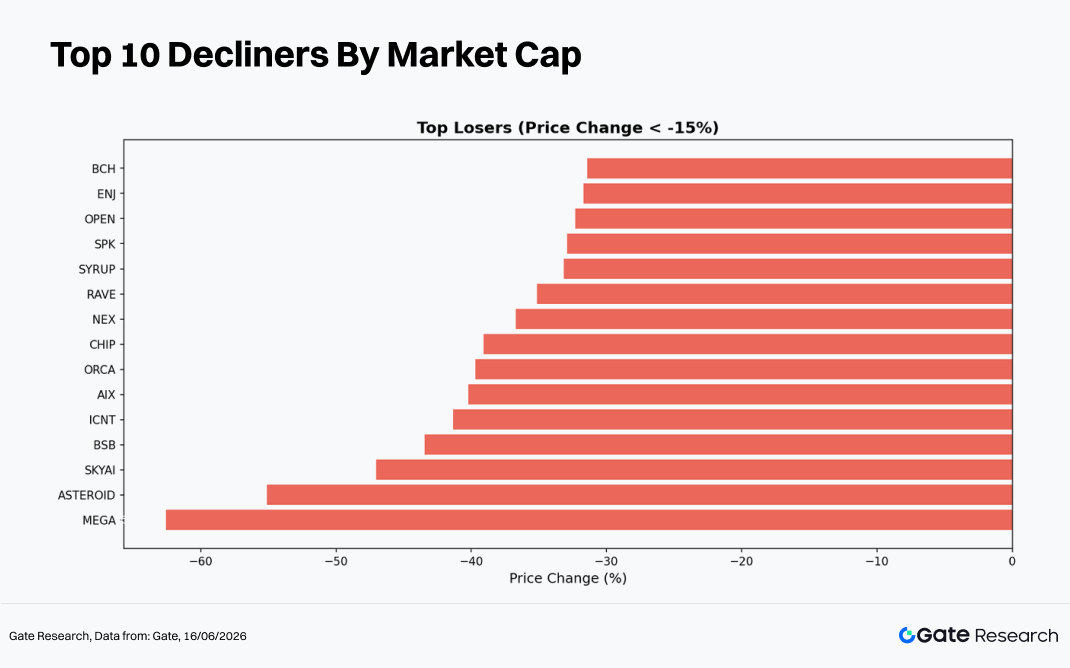
2.1.2 Top Losers: Assets Lacking Near-Term Catalysts
The worst-performing assets generally fell into three categories: tokens facing regulatory pressure, projects suffering from narrative fatigue, and small-cap assets experiencing liquidity deterioration.
BCH (-31.4%, Rank 26) recorded the largest decline among major assets, primarily due to accelerating hash-rate weakness following reduced mining activity and increasing selling pressure from holders.
SKY (-19.6%, Rank 60), a MakerDAO-related asset, suffered from governance disputes and uncertainty surrounding stablecoin strategy adjustments.
PI (-18.8%, Rank 56) continued to face pressure following delays to its mainnet roadmap, contributing to declining user engagement.
ENA (-14.2%, Rank 83) was negatively affected by lower yields within the synthetic stablecoin sector, compounded by retail profit-taking.
PEPE (-12.2%, Rank 63) declined alongside broader weakness across the Meme sector, with the unwinding of leveraged positions amplifying downside pressure.
Further down the market-cap spectrum, tokens such as SKYAI (-47.0%), NEX (-36.7%), and SYRUP (-33.2%) were impacted by liquidity crises, token sales by project teams, or other forms of fundamental deterioration.
The common characteristics among the biggest losers were a lack of near-term catalysts, exhausted narratives, and tightening liquidity conditions, making them particularly vulnerable as capital rotated toward emerging themes.
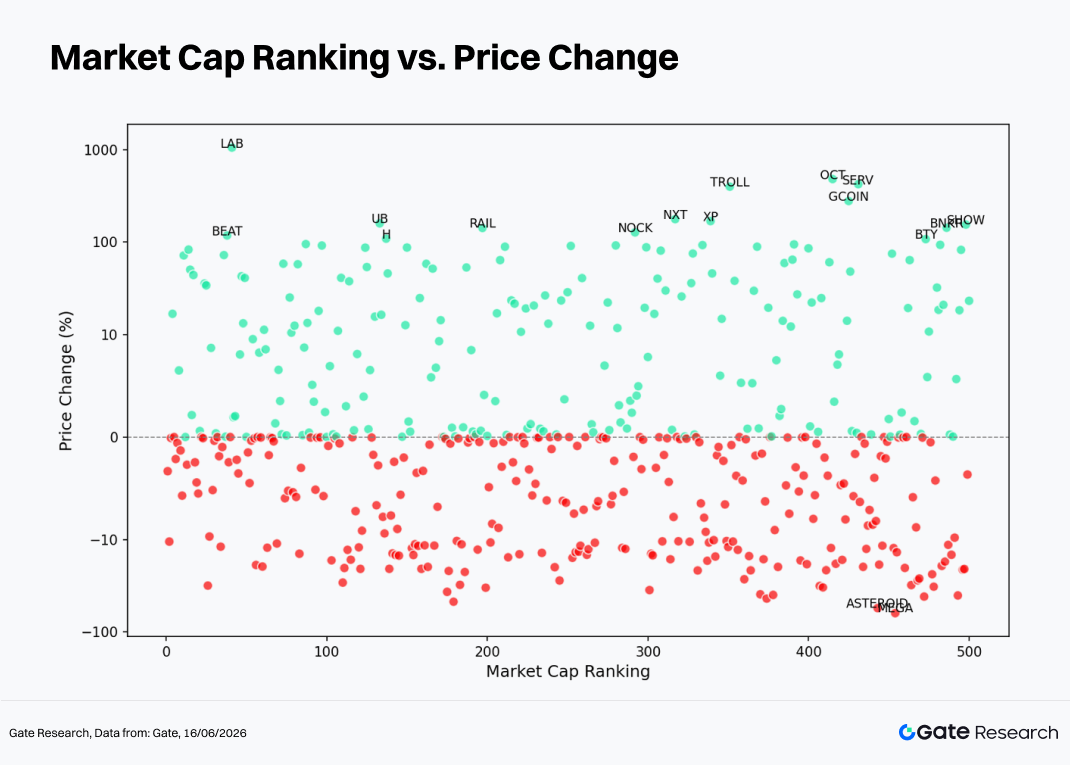
A scatter plot comparing market-cap ranking (X-axis) and monthly returns (Y-axis) reveals a clear pattern: positive-return dispersion increases as market capitalization declines, while downside performance remains comparatively more concentrated.
For the top 50 tokens, returns were generally confined within a ±20% range, reflecting the stabilizing effect of deep liquidity. Even when negative catalysts emerged, broader buying interest helped absorb selling pressure. However, exceptional cases such as LAB and BEAT demonstrate that abnormal volatility can still occur within relatively well-known assets.
Within the Rank 100–300 range, positive outliers such as NOCK, ALLO, and RAIL remained present, but losing positions became increasingly common, indicating a declining win rate and rising tail risk.
The Rank 300–500 segment exhibited the highest dispersion. Extreme gainers such as OCT (+482%), SERV (+424%), and TROLL (+398%) coexisted with severe losers including MEGA (-62%) and ASTEROID (-55%), forming a classic fat-tail distribution. This reinforces the observation that low-cap assets carry the highest two-sided volatility risk.
Looking at the overall trend, both the number and proportion of negative-return assets increased as market capitalization declined. Median returns gradually shifted from around 0% toward below -1%, suggesting that smaller assets faced greater valuation pressure and were more sensitive to liquidity withdrawals in an overall risk-off environment.
For investors, pursuing low-cap opportunities may offer substantial upside potential, but it also requires careful consideration of liquidity constraints and downside tail risks.
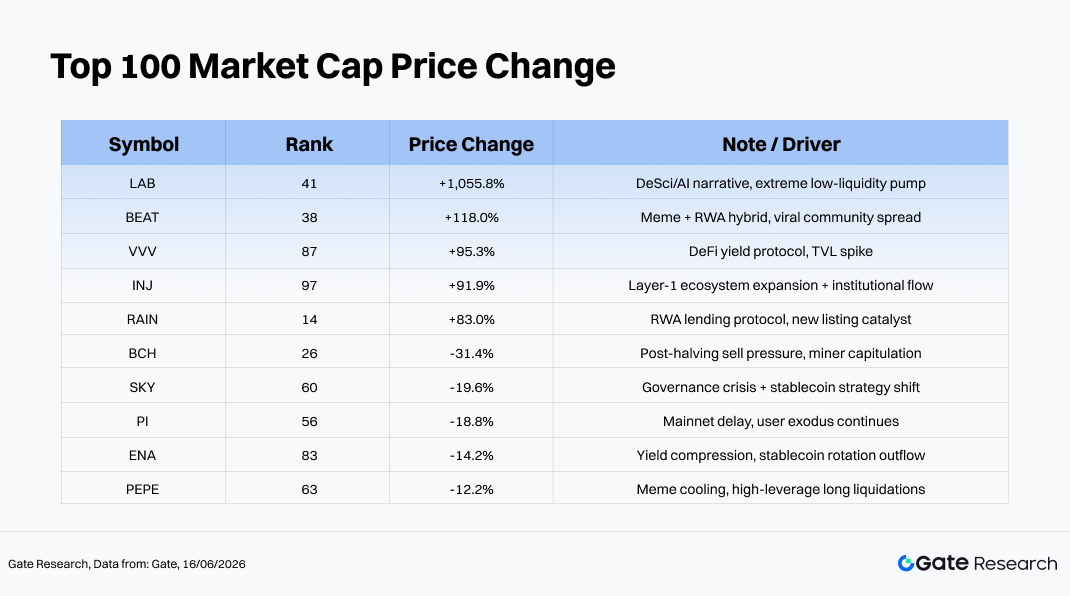
2.3 Top 100 Market-Cap Leaderboard
Performance among the top 100 cryptocurrencies was highly polarized. The five best-performing assets all gained more than 83%, while the five worst performers each declined by more than 12%, highlighting strong divergence within the blue-chip segment.
On the upside, LAB (+1,055.8%) was an exceptional case driven by the convergence of DeSci and AI narratives combined with extremely limited liquidity. BEAT (+118.0%) and RAIN (+83.0%) demonstrated the explosive potential of Meme and RWA-related themes.
On the downside, BCH suffered from miner-driven selling pressure, while SKY and PI reflected broader ecosystem challenges and deteriorating confidence. The declines in ENA and PEPE were more indicative of capital rotation away from previously popular sectors, with the strength of their support levels yet to be tested.
3. Analysis of Volume Expansion During This Market Cycle
3.1 Trading Volume Growth Analysis
Using the average daily trading volume in May as a baseline and comparing it with daily trading volume near month-end, a Volume Spike metric can be calculated. The higher the value, the more significant the surge in trading activity relative to the market's earlier "quiet period," indicating a rapid increase in capital participation and market attention.
Among the 454 tokens with available volume data during this cycle, the average volume expansion was 2.35x, while the median stood at 1.41x. A total of 76 tokens recorded volume growth exceeding 3x, and 12 tokens posted increases of more than 10x.
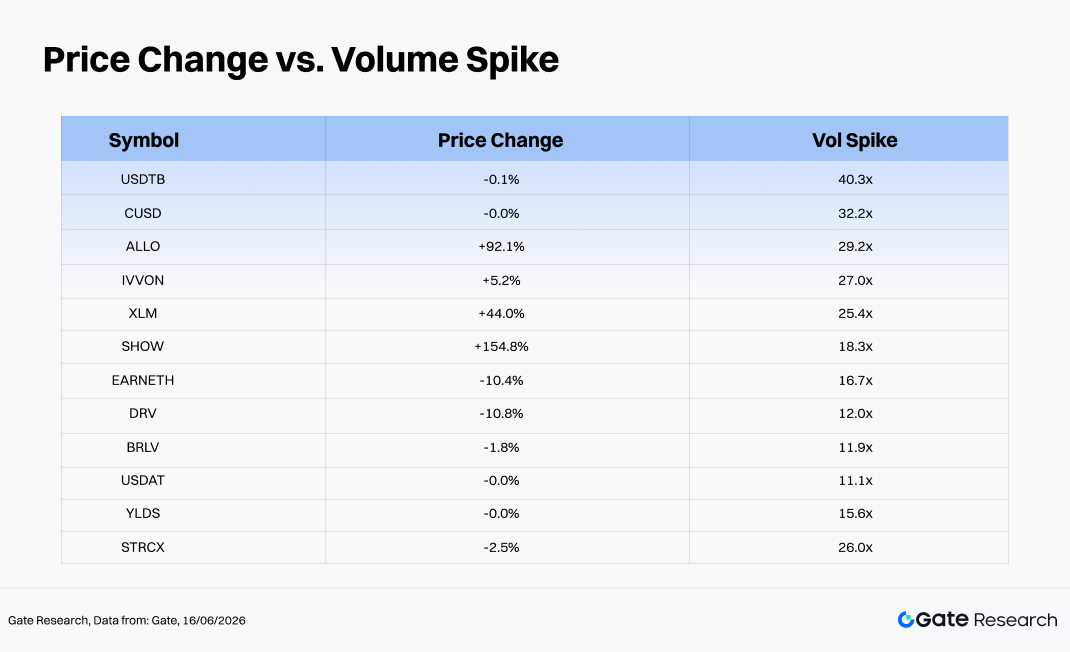
Among the assets with the largest volume spikes, stablecoins such as USDTB, CUSD, YLDS, and USDAT were primarily driven by on-chain arbitrage or portfolio rebalancing activities, making their volume increases less meaningful from a directional price perspective. By contrast, the most informative cases were ALLO (+92.1%, 29.2x), XLM (+44.0%, 25.4x), and SHOW (+154.8%, 18.3x), all of which exhibited the classic pattern of simultaneous price appreciation and volume expansion, a traditionally bullish signal.
Conversely, EARNETH (-10.4%, 16.7x) and DRV (-10.8%, 12.0x) experienced substantial volume growth while their prices declined, representing a typical "high volume, falling price" distribution pattern that may indicate selling pressure and warrants caution.
Overall, assets recording volume increases of more than 5x alongside positive price performance were primarily concentrated in DeFi protocol tokens and cross-chain assets. Many of these moves were supported by genuine on-chain activity, exchange listings, or other fundamental catalysts, making them important areas to monitor in the current rotational market environment.
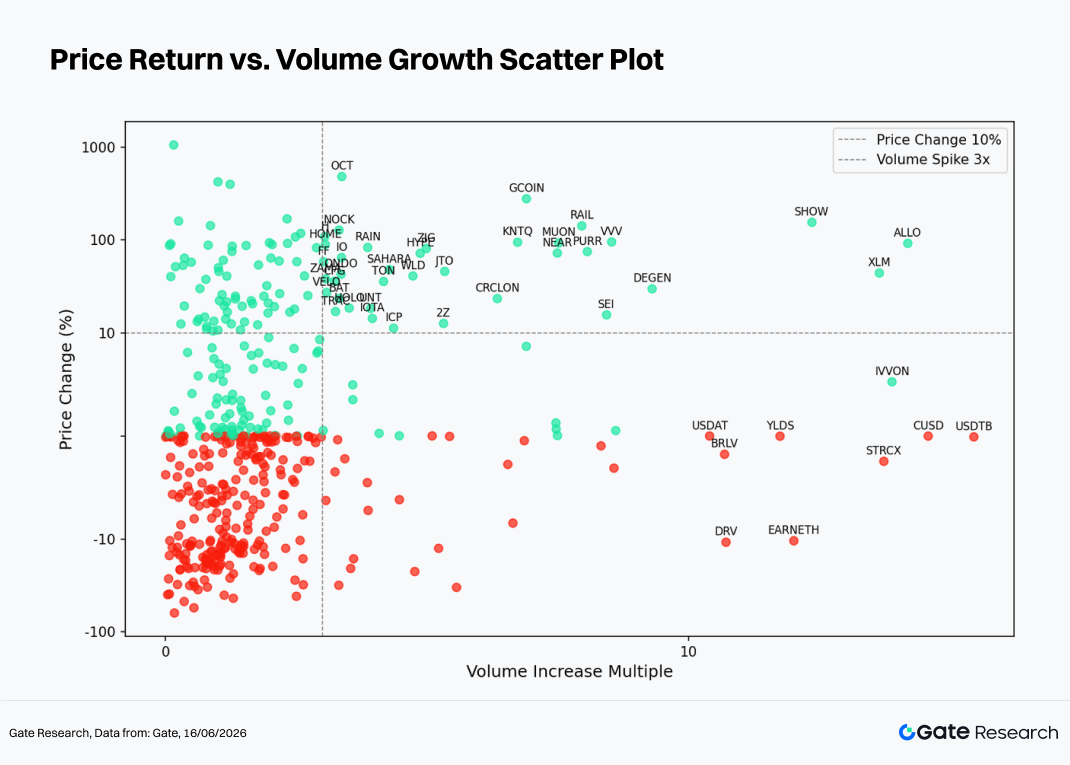
Building upon the observation of abnormal trading volume activity, this section further examines the relationship between volume and price performance through a scatter plot of volume growth multiples versus price returns. The horizontal axis represents the increase in trading volume relative to a baseline period over the past two weeks, while the vertical axis represents the corresponding percentage price change. A symmetric logarithmic scale is applied to better illustrate the structural relationship between volume expansion and price movement.
The scatter plot reveals a pattern characterized by "dense on the left, sparse on the right, with stronger signals in the upper region," indicating a strong positive correlation between volume expansion and upward price performance.
-
In the low-volume zone (0–3x volume growth, left of the vertical dashed line), the vast majority of tokens are concentrated. Price movements are relatively random, with similar densities of positive and negative returns, suggesting weak directional signals when volume remains subdued. This region contains a large number of small- and mid-cap tokens, many of which traded sideways, resulting in a high level of signal noise.
-
In the medium-volume zone (3–10x volume growth), the proportion of gaining tokens increases significantly. Most price gains range between +10% and +150%, including RAIL (+142.1%, 8.0x), MUON (+93.0%, 7.5x), NEAR (+72.4%, 7.5x), SEI (+15.6%, 8.4x), and PURR (+75.0%, 8.1x). These assets exhibited healthy volume-price confirmation and can be regarded as valid breakout signals. Meanwhile, the number of declining tokens within this range decreases noticeably, suggesting that 3–10x volume expansion is more commonly associated with active buying pressure.
-
In the ultra-high-volume zone (above 10x), two distinct patterns emerge. The first consists of strong bullish breakouts represented by ALLO (29.2x), XLM (25.4x), and SHOW (18.3x), where both price and volume surged simultaneously, indicating strong investor demand. The second includes stablecoins such as USDTB (40.3x) and CUSD (32.2x), whose trading volumes spiked while prices remained largely unchanged. These moves were primarily driven by large-scale on-chain rebalancing or arbitrage activities and therefore constitute false directional signals. Additionally, EARNETH (16.7x, -10.4%) and DRV (12.0x, -10.8%) experienced heavy volume alongside declining prices, a pattern commonly associated with distribution by large holders taking advantage of increased liquidity.
Overall, volume expansion exceeding 3x accompanied by positive price breakouts proved to be one of the most effective quantitative signals for identifying short-term outperformers during this market cycle. In contrast, exceptionally high trading volume combined with stagnant or declining prices often serves as a warning sign of distribution activity or liquidity stress. Investors should interpret volume signals in the context of token type (stablecoins versus risk assets) to avoid mistaking stablecoin-related flows for genuine directional market signals.
3.3 Correlation Analysis
Following the examination of the relationship between trading volume and price performance, this section further evaluates their statistical correlation. To measure the impact of capital activity on price fluctuations, the ratio of volume growth to market capitalization is used as a relative activity indicator, and its correlation with price returns is calculated to identify the token categories most sensitive to capital flows in the current market environment.
ALLO (approximately 0.74) and XEC (approximately 0.73) recorded the highest correlation coefficients. Both assets feature relatively concentrated circulating supplies and highly active communities, resulting in a strong alignment between capital inflows and price direction.
BNB has the largest bubble size in the chart, representing the highest market capitalization or trading volume weight among the sample. Although its correlation coefficient is comparable to that of ALLO and XEC, its influence on overall market pricing is substantially greater, making it a key indicator of capital activity across the broader market.
AI and infrastructure-related tokens such as AIOZ and IO, as well as ecosystem tokens including JTO and KAIA, also exhibit correlation coefficients above 0.70. This suggests that growing institutional attention has strengthened the relationship between trading activity and price performance for these assets.
By comparison, tokens such as STRK, TEL, TROLL, and SUSHI display somewhat lower correlation coefficients, ranging from approximately 0.61 to 0.62. This indicates that their price movements are more heavily influenced by external factors and market noise, reducing the explanatory power of capital activity alone and requiring a broader analytical framework.
4. Conclusion
In the short term, whether BTC can successfully hold above the $60,000 level and eventually break through $70,000 during June will serve as a critical test of whether the current recovery can evolve into a sustainable trend reversal. At the same time, progress on the CLARITY Act and the future path of Federal Reserve policy will jointly determine the pace of institutional capital inflows. If the legislation advances successfully, regulatory-sensitive assets such as XRP and SOL could undergo a meaningful re-rating. Conversely, if inflation remains persistent and delays expectations for monetary easing, a stronger U.S. dollar may continue to weigh on the broader crypto market.
From a structural perspective, DeSci and AI narratives, RWA protocols, and the on-chain perpetual futures ecosystem have already demonstrated stronger resilience and capital attraction than the broader market during this cycle. Combining these themes with quantitative signals such as simultaneous increases in price and volume may provide one of the most effective approaches for identifying excess-return opportunities in an increasingly polarized market environment.
Reference:
- CoinGecko, https://www.coingecko.com/
- Gate, https://www.gate.com/trade/BTC_USDT
Gate Research is a comprehensive blockchain and cryptocurrency research platform that provides deep content for readers, including technical analysis, market insights, industry research, trend forecasting, and macroeconomic policy analysis.
Disclaimer
Investing in cryptocurrency markets involves high risk. Users are advised to conduct their own research and fully understand the nature of the assets and products before making any investment decisions. Gate is not responsible for any losses or damages arising from such decisions.