This comprehensive analysis examines Aura Network (AURA), a Layer 1 blockchain focused on NFT adoption, providing price analysis from 2026 through 2031. As of February 2026, AURA trades at $0.00159 with a market cap of $661,024, having experienced significant volatility and an 81.28% yearly decline. The article evaluates market sentiment, trading dynamics, macroeconomic factors, and technical developments influencing AURA's price trajectory. Projections range from conservative ($0.00119-$0.00152 in 2026) to optimistic scenarios, with long-term potential reaching $0.00235 by 2031 under favorable conditions. Investment strategies include dollar-cost averaging for long-term holders and active trading approaches with strict risk management. The analysis addresses critical risks including low liquidity, regulatory uncertainty in NFT markets, and technical execution challenges. Available for trading on Gate, AURA requires careful due diligence and conservative position sizing given its early-stage status and market
Introduction: AURA's Market Position and Investment Value
Aura Network (AURA), as a Layer 1 blockchain designed to accelerate global NFT adoption, has been developing its ecosystem since its inception. As of 2026, AURA maintains a market capitalization of approximately $661,024, with a circulating supply of around 415.74 million tokens, and the price hovering around $0.00159. This asset, positioned as a scalable and agile blockchain infrastructure, is playing an increasingly important role in the NFT and blockchain ecosystem development space.
This article will comprehensively analyze AURA's price trends from 2026 to 2031, combining historical patterns, market supply and demand dynamics, ecosystem development, and macroeconomic environment factors to provide investors with professional price predictions and practical investment strategies.
I. AURA Price History Review and Current Market Status
AURA Historical Price Evolution Trajectory
- 2024: Network launched and reached all-time high, price peaked at $0.06798 in January
- 2024-2025: Market correction phase, price experienced significant decline
- 2026: Price reached historical low of $0.001225 in February, reflecting continued downward pressure
AURA Current Market Situation
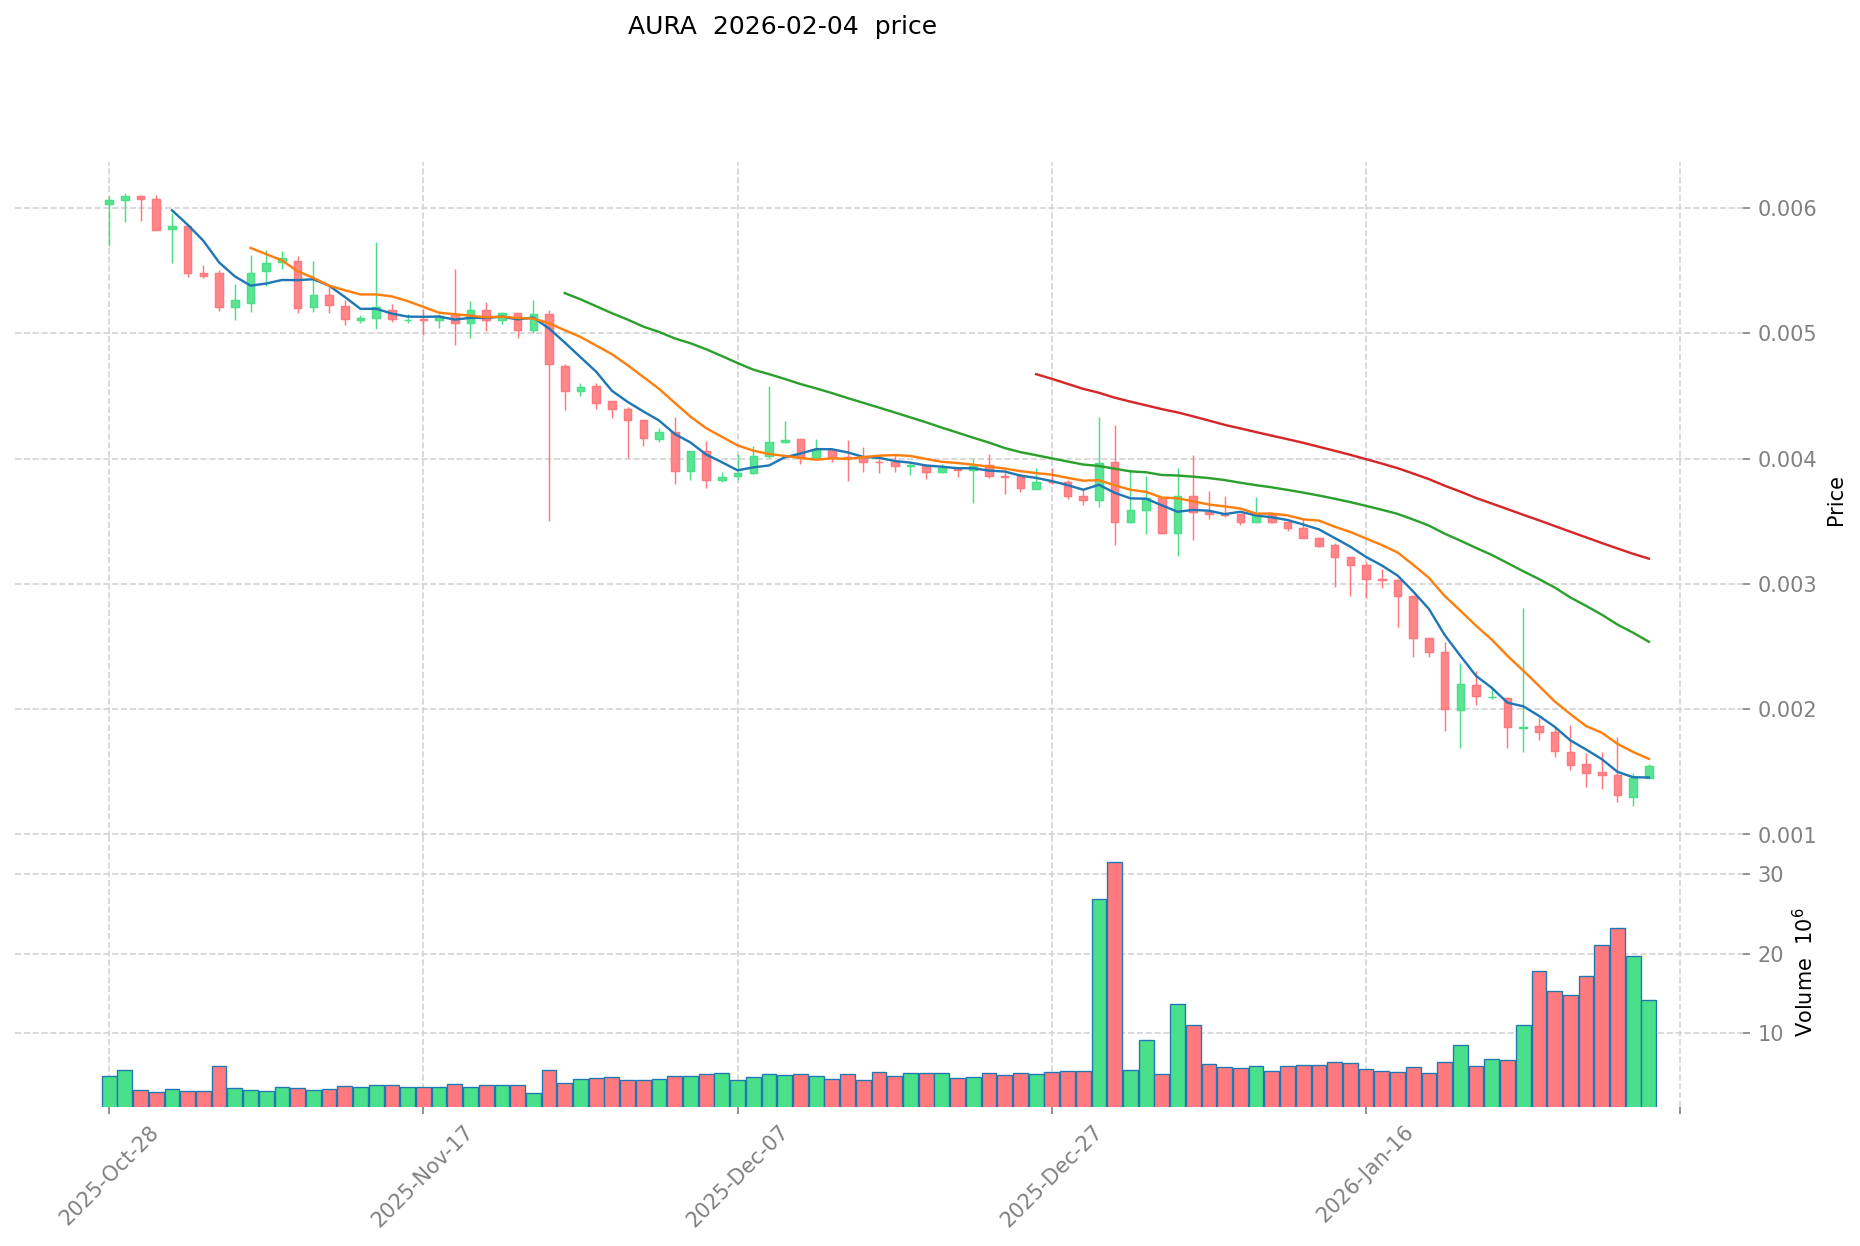
As of February 4, 2026, AURA is trading at $0.00159, representing a 0.51% decrease over the past 24 hours. The token has experienced notable volatility across different timeframes, with a 10.74% decline over the past 7 days and a substantial 59.31% decrease over the past 30 days. The yearly performance shows an 81.28% decline, indicating prolonged market pressure.
The 24-hour trading range spans from $0.001489 to $0.001601, with a trading volume of $35,245.12. The current market capitalization stands at approximately $661,024, with a circulating supply of 415,738,487 AURA tokens, representing 41.57% of the total supply of 1 billion tokens. The fully diluted market cap is valued at $1,590,000.
AURA maintains a market dominance of 0.000059% and is currently ranked #2,818 among cryptocurrencies. The token recently established a new all-time low at $0.001225 on February 2, 2026, which is significantly below its all-time high of $0.06798 recorded in January 2024. The market sentiment indicator reflects an extreme fear reading of 14, suggesting heightened caution among market participants.
The token is held by approximately 2,847 addresses and is available for trading on Gate.com. AURA Network continues to operate as a Layer 1 blockchain focused on NFT adoption, despite facing challenging market conditions.
Click to view current AURA market price
AURA Market Sentiment Index
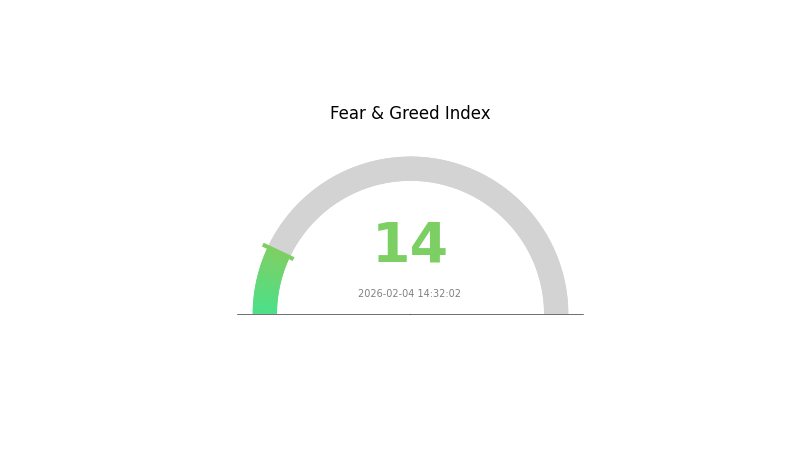
2026-02-04 Fear and Greed Index: 14 (Extreme Fear)
Click to view current Fear & Greed Index
The cryptocurrency market is currently experiencing extreme fear, with the Fear and Greed Index standing at 14. This indicates that market participants are highly pessimistic about near-term price movements. Such extreme fear often represents capitulation in the market, where panic selling reaches peak levels. Historically, these conditions have preceded significant market reversals and buying opportunities for long-term investors. However, traders should exercise caution and conduct thorough risk assessment before entering positions during periods of extreme fear volatility.
AURA Holding Distribution
The holding distribution chart illustrates how AURA tokens are allocated across different wallet addresses, providing crucial insights into the token's decentralization level and potential concentration risks. By analyzing the percentage of total supply held by top addresses, investors can assess whether the token exhibits healthy distribution or faces centralization concerns that might impact price stability.
Based on the current on-chain data, AURA demonstrates a relatively concentrated holding structure. The top addresses collectively control a significant portion of the total circulating supply, indicating that a small number of wallets possess substantial influence over the token's market dynamics. This concentration pattern suggests that the token is still in an early distribution phase or that strategic holders—potentially including project teams, early investors, or institutional participants—maintain considerable positions.
Such concentration levels carry dual implications for market structure. On one hand, concentrated holdings may lead to reduced liquidity and increased price volatility, as large-scale transactions from top holders could trigger significant market movements. On the other hand, if these major holders represent committed long-term investors or project stakeholders, their positions might provide price stability during market downturns. Current holding patterns reflect a market structure where token distribution remains centralized, requiring careful monitoring as the project matures and potentially expands its holder base through broader market participation.
Click to view current AURA Holding Distribution

| Top |
Address |
Holding Qty |
Holding (%) |
II. Core Factors Influencing AURA's Future Price
Market Sentiment and Trading Dynamics
- Overall Market Sentiment: AURA's price is significantly influenced by broader market sentiment within the cryptocurrency space. When the overall crypto market experiences bullish trends, AURA tends to benefit from increased investor confidence and capital inflows.
- Trading Volume Patterns: Trading volume serves as a key indicator of market interest and liquidity. Higher trading volumes typically correlate with increased price volatility and can signal growing adoption or speculative interest in AURA.
- User Adoption Trends: The rate at which new users and projects adopt AURA within its ecosystem directly impacts demand dynamics. Growing adoption generally supports price appreciation through increased utility and network effects.
Macroeconomic Conditions
- Interest Rate Environment: Broader macroeconomic conditions, particularly interest rate policies set by major central banks, influence investor risk appetite for cryptocurrency assets like AURA. Lower interest rates tend to encourage investment in alternative assets, while rising rates may prompt capital rotation toward traditional fixed-income securities.
- Economic Uncertainty: During periods of economic instability or uncertainty, cryptocurrency markets can experience heightened volatility as investors reassess risk allocations across their portfolios.
- Global Financial Trends: Shifts in global financial markets, including equity market performance and currency fluctuations, create spillover effects that impact cryptocurrency valuations.
Technical Development and Innovation
- Technology Advancement: Ongoing technical development and innovation within AURA's ecosystem contribute to its long-term value proposition. Protocol improvements, security enhancements, and feature additions can attract developers and users, thereby supporting price growth.
- Ecosystem Evolution: The maturity and expansion of projects, applications, and services built around AURA enhance its utility and create additional use cases that may drive demand.
- Network Performance: Technical metrics such as transaction speed, network scalability, and system reliability influence user experience and confidence, which ultimately affect market valuation.
Investors considering AURA should monitor these multifaceted factors while maintaining awareness that cryptocurrency markets remain inherently volatile and subject to rapid changes in sentiment and conditions.
III. 2026-2031 AURA Price Prediction
2026 Outlook
- Conservative prediction: $0.00119 - $0.00152
- Neutral prediction: $0.00152 average price level
- Optimistic prediction: $0.00186 (requires favorable market conditions and increased adoption)
Based on current market analysis, AURA is projected to experience a 4% decline in 2026, with prices ranging between $0.00119 and $0.00186. The average trading price is expected to stabilize around $0.00152, reflecting potential market consolidation and adjustment period.
2027-2029 Mid-term Outlook
- Market stage expectation: Recovery and gradual growth phase with increasing market participation
- Price range predictions:
- 2027: $0.00127 - $0.00186, with 6% growth potential
- 2028: $0.00165 - $0.00183, showing 11% improvement
- 2029: $0.00117 - $0.00193, projecting 13% upward movement
- Key catalysts: Market sentiment improvement, potential ecosystem expansion, and broader cryptocurrency market recovery trends
During this period, AURA is anticipated to transition from stabilization to moderate growth, with average prices progressing from $0.00169 in 2027 to $0.00177 in 2028, and reaching $0.00180 by 2029.
2030-2031 Long-term Outlook
- Baseline scenario: $0.00171 - $0.00209 (assuming steady market development and maintained ecosystem growth)
- Optimistic scenario: $0.00186 - $0.00235 (driven by enhanced adoption, technological improvements, and favorable regulatory environment)
- Transformative scenario: Up to $0.00235 (contingent on breakthrough developments, significant partnerships, and sustained bullish market conditions)
The long-term forecast suggests progressive appreciation, with 2030 showing a 17% growth potential and average price of $0.00186, while 2031 could see a 24% increase with average price reaching $0.00198. The projected high of $0.00235 in 2031 represents substantial growth from current levels, though investors should remain aware of inherent market volatility and external factors that may influence actual performance.
- February 4, 2026: AURA price projections indicate an average of $0.00152 (entering consolidation phase with moderate trading activity expected)
| Year |
Predicted High Price |
Predicted Average Price |
Predicted Low Price |
Price Change |
| 2026 |
0.00186 |
0.00152 |
0.00119 |
-4 |
| 2027 |
0.00186 |
0.00169 |
0.00127 |
6 |
| 2028 |
0.00183 |
0.00177 |
0.00165 |
11 |
| 2029 |
0.00193 |
0.0018 |
0.00117 |
13 |
| 2030 |
0.00209 |
0.00186 |
0.00171 |
17 |
| 2031 |
0.00235 |
0.00198 |
0.00174 |
24 |
IV. AURA Professional Investment Strategy and Risk Management
AURA Investment Methodology
(I) Long-term Holding Strategy
- Suitable for: Investors seeking exposure to NFT infrastructure and Layer 1 blockchain ecosystems
- Operational Recommendations:
- Consider dollar-cost averaging to mitigate volatility risk, especially given AURA's 59.31% decline over the past 30 days
- Monitor the project's ecosystem development and NFT adoption metrics as key performance indicators
- Utilize secure storage solutions such as Gate Web3 Wallet for long-term holding
(II) Active Trading Strategy
- Technical Analysis Tools:
- Volume Analysis: Track the 24-hour trading volume ($35,245) relative to market cap to identify liquidity trends
- Support and Resistance Levels: Monitor the 24-hour low ($0.001489) and high ($0.001601) as short-term reference points
- Swing Trading Considerations:
- Exercise caution given the recent price volatility, with a 10.74% decline over 7 days
- Set strict stop-loss orders to manage downside risk in this volatile environment
AURA Risk Management Framework
(I) Asset Allocation Principles
- Conservative Investors: 1-3% of crypto portfolio
- Aggressive Investors: 5-8% of crypto portfolio
- Professional Investors: Up to 10% with active monitoring
(II) Risk Hedging Solutions
- Portfolio Diversification: Balance AURA exposure with established Layer 1 assets
- Position Sizing: Limit individual position size based on the token's low market cap ($661,024) and limited exchange availability
(III) Secure Storage Solutions
- Hot Wallet Recommendation: Gate Web3 Wallet for active trading and easy access
- Cold Storage Solution: Consider hardware wallet solutions for long-term holdings exceeding $1,000
- Security Precautions: Never share private keys, enable two-factor authentication, and verify all transaction addresses
V. AURA Potential Risks and Challenges
AURA Market Risks
- High Volatility: The token has declined 81.28% over the past year, indicating significant price instability
- Low Liquidity: With only $35,245 in 24-hour trading volume and listing on one exchange, liquidity risk is substantial
- Market Cap Concerns: The relatively small market cap of $661,024 makes AURA susceptible to large price swings
AURA Regulatory Risks
- NFT Regulatory Uncertainty: As an NFT-focused blockchain, AURA may face evolving regulatory frameworks for digital collectibles
- Global Compliance Requirements: Changes in cryptocurrency regulations across jurisdictions could impact project operations
- Token Classification Risk: Potential regulatory changes regarding token classification may affect trading and custody
AURA Technical Risks
- Network Scalability: As a Layer 1 blockchain, the project must demonstrate consistent performance under increasing usage
- Competition Risk: The NFT infrastructure space faces competition from established Layer 1 and Layer 2 solutions
- Development Execution: With 41.57% of tokens in circulation, the project's ability to deliver on its roadmap is critical
VI. Conclusion and Action Recommendations
AURA Investment Value Assessment
Aura Network presents itself as a specialized Layer 1 blockchain targeting NFT adoption globally. However, the token faces significant headwinds, including an 81.28% decline over the past year and limited liquidity with only one exchange listing. While the project's focus on NFT infrastructure may offer long-term potential, the current market conditions suggest considerable risk. The low circulation ratio of 41.57% and small market cap indicate both early-stage opportunity and high volatility risk.
AURA Investment Recommendations
✅ Beginners: Approach with extreme caution; if interested, allocate no more than 1-2% of crypto portfolio and prioritize learning about NFT ecosystems before investing
✅ Experienced Investors: Consider small speculative positions with strict risk management, monitoring ecosystem development and partnership announcements
✅ Institutional Investors: Conduct thorough due diligence on the project's technical infrastructure, team credentials, and competitive positioning before any allocation
AURA Trading Participation Methods
- Spot Trading: Available on Gate.com with USDT trading pairs
- DCA Strategy: Implement systematic purchasing to average entry price over time
- Risk-Managed Approach: Use limit orders and stop-loss mechanisms to control downside exposure
Cryptocurrency investment carries extremely high risk, and this article does not constitute investment advice. Investors should make cautious decisions based on their own risk tolerance and are advised to consult professional financial advisors. Never invest more than you can afford to lose.
FAQ
What is AURA token and what is its purpose?
AURA token serves as governance and incentive tool within the ecosystem. Locked AURA tokens grant governance rights and voting power using protocol-owned veBAL, plus participation in internal proposals.
What is the current price of AURA? How has its historical price trend been?
AURA's current price fluctuates between its all-time high of US$0.003277 and all-time low of US$0.002314. As of February 4, 2026, AURA is trading 26.97% below its peak and 3.40% above its lowest point, showing steady consolidation in mid-range levels.
What is the price prediction for AURA in 2024? How do experts view it?
In 2024, AURA reached a peak of $0.06798, marking its historical high. Expert analysis suggests continued volatility in the cryptocurrency market, with sentiment tied to network adoption and broader market trends.
What are the main factors affecting AURA price?
AURA price is primarily influenced by supply and demand dynamics, market sentiment driven by news and social media, regulatory developments such as ETF approvals, institutional adoption, and overall cryptocurrency market trends.
What advantages does AURA have compared to similar projects?
AURA features a lightweight modular design reducing weight to less than one-sixth of competitors, enhanced comfort for extended use, superior transaction volume efficiency, and innovative tokenomics delivering stronger value proposition than comparable projects.
What risks should I be aware of when investing in AURA?
AURA investment carries potential capital loss risks due to market volatility and trading system uncertainties. All cryptocurrency investments involve unpredictable risks. Monitor market conditions and system performance carefully before trading.
What are the circulating supply and total supply of AURA?
AURA has a circulating supply of 78.89B and a total supply of 100.00B. These figures are crucial indicators of asset scarcity and directly impact its long-term market valuation potential.
What is AURA's future development roadmap?
Project Aura will achieve full commercialization in 2026, shifting XR technology from screen-based to spatial intelligence. This transformation will revolutionize physical world interactions, with China's hardware sector playing a crucial role in this evolution.
* The information is not intended to be and does not constitute financial advice or any other recommendation of any sort offered or endorsed by Gate.