This article provides comprehensive CAPS price analysis and market forecasts from 2026 to 2031, combining historical patterns with fundamental market dynamics. Currently trading at $0.000615 on Gate with a $1.13 million market cap, CAPS faces significant headwinds after a 99.73% decline from its all-time high. The analysis examines key factors driving CAPS valuation including token supply mechanisms, institutional holder concentration, macroeconomic conditions, and ecosystem development. Expert price predictions range from $0.00042-$0.00066 in 2026, with potential growth to $0.00169 by 2031 under favorable conditions. The article outlines professional investment strategies for different investor types, comprehensive risk management frameworks, regulatory and technical challenges, and secure custody solutions via Gate Web3 Wallet. Investors should carefully assess their risk tolerance before participating in this early-stage NFT data transmission project.
Introduction: CAPS Market Position and Investment Value
Ternoa (CAPS), positioned as a blockchain specifically designed for data transmission through NFTs using Polkadot's Substrate technology, has been developing since its launch in 2021. As of 2026, CAPS maintains a market capitalization of approximately $1.13 million, with a circulating supply of around 1.83 billion tokens, and the price hovering around $0.000615. This asset, characterized as a data preservation and NFT-focused blockchain solution, is playing an increasingly important role in decentralized data storage and NFT transmission applications.
This article will comprehensively analyze CAPS price trends from 2026 to 2031, combining historical patterns, market supply and demand dynamics, ecosystem development, and macroeconomic environment factors to provide investors with professional price forecasts and practical investment strategies.
I. CAPS Price History Review and Market Status
CAPS Historical Price Evolution Trajectory
- 2021: Launched on May 28, 2021 with an initial offering price of $0.0555, reaching an all-time high of $0.227823 on June 8, 2021, representing a peak appreciation of approximately 310% from its launch price
- 2022-2024: Experienced a prolonged market correction phase aligned with broader crypto market cycles, with price gradually declining from previous highs
- 2025: Continued downward pressure, reaching an all-time low of $0.00054725 on December 16, 2025, marking a significant decline of approximately 99.8% from its historical peak
CAPS Current Market Situation
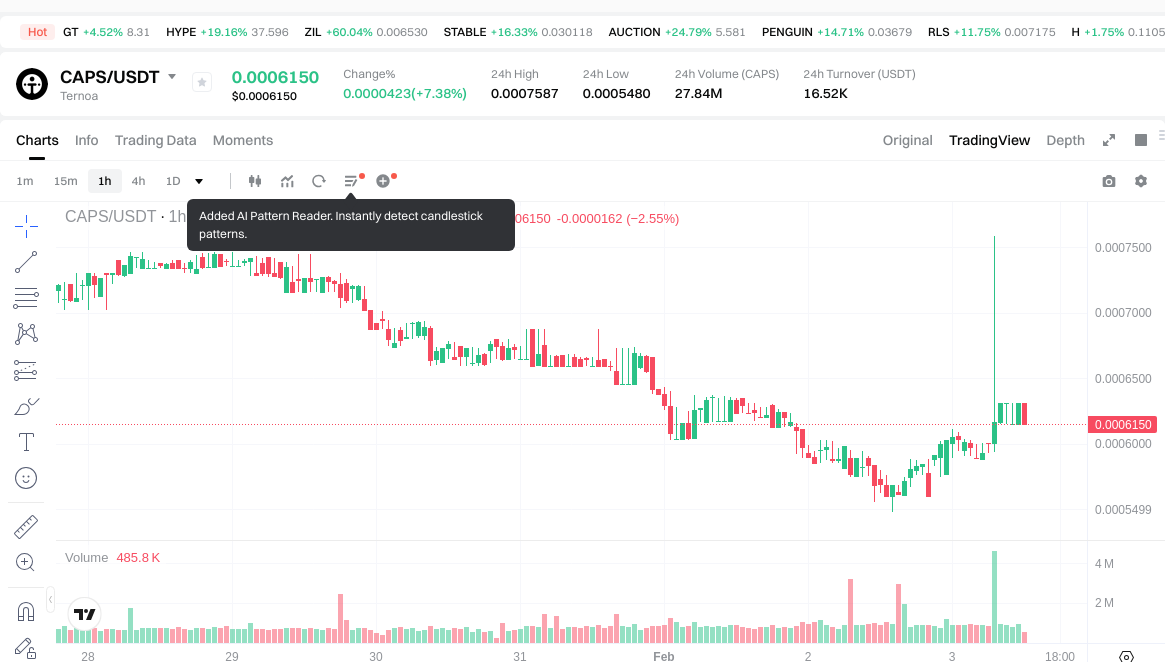
As of February 3, 2026, CAPS is trading at $0.000615, demonstrating a notable recovery of 9.87% over the past 24 hours. The token's 24-hour trading range spans from $0.000548 to $0.0007587, with a total trading volume of $16,502.75.
The current market capitalization stands at approximately $1.13 million, with a circulating supply of 1.83 billion CAPS tokens, representing 73.18% of the maximum supply of 2.5 billion tokens. The fully diluted market cap reaches $1.54 million. CAPS maintains a market dominance of 0.000055% within the broader cryptocurrency ecosystem.
Despite recent short-term gains, the token shows negative performance across extended timeframes, declining 13.17% over the past week, 18.82% over the past month, and 86.82% over the past year. The token currently trades approximately 99.73% below its all-time high, though it has rebounded 12.38% from its all-time low recorded in December 2025.
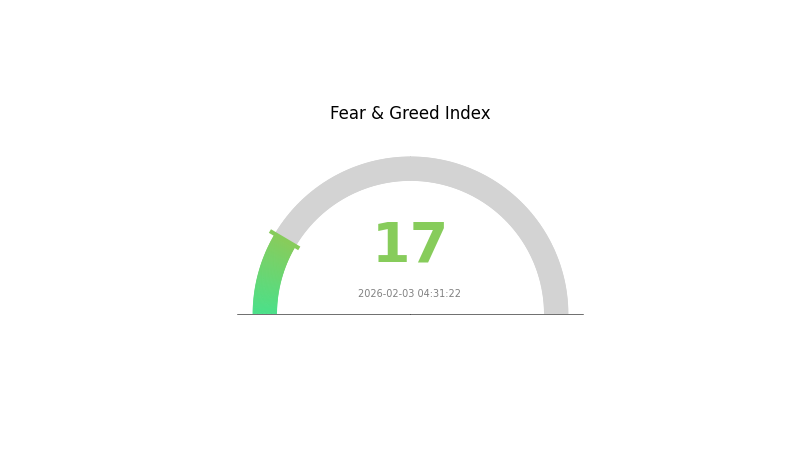
The Gate.com Crypto Fear & Greed Index currently registers at 17, indicating an "Extreme Fear" sentiment in the broader market, which may influence trading behavior across various digital assets including CAPS.
Click to view the current CAPS market price
CAPS Market Sentiment Index
2026-02-03 Fear & Greed Index: 17 (Extreme Fear)
Click to view current Fear & Greed Index
The crypto market is currently in an extreme fear state with a CAPS index of 17. This exceptionally low reading suggests significant market pessimism and capitulation among investors. When fear reaches such extreme levels, it historically signals potential oversold conditions and may present buying opportunities for contrarian traders. However, caution remains warranted as further downside pressure could continue. Market participants should monitor key support levels and macroeconomic indicators closely during this period of heightened uncertainty.
CAPS Holding Distribution
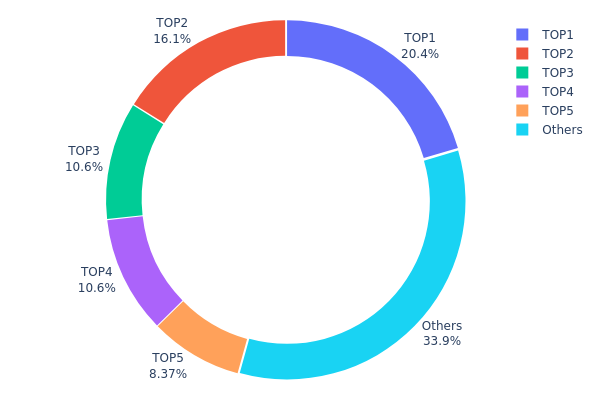
The holding distribution chart visualizes how CAPS tokens are allocated across different wallet addresses, serving as a key indicator to assess the degree of decentralization and potential market manipulation risks. By analyzing the concentration of tokens held by top addresses, investors can better understand the project's governance structure and the stability of its on-chain ecosystem.
According to the current data, the top 5 addresses collectively hold approximately 66.09% of the total CAPS supply, indicating a relatively high concentration level. The largest holder controls 20.40% of tokens, while the second and third addresses hold 16.12% and 10.61% respectively. Notably, the third-ranked address (0x0000...00dead) represents a burn address, suggesting the project has implemented token destruction mechanisms. Excluding the burn address, the actual circulating supply concentration remains significant, with the top two addresses alone accounting for over 36% of holdings.
This concentration pattern presents a dual-edged scenario for market dynamics. On one hand, substantial holdings by major addresses may indicate strong confidence from early investors or project team members, potentially providing price stability during market volatility. On the other hand, excessive concentration creates heightened risks of price manipulation, as large holders possess the capability to significantly impact market prices through coordinated selling or accumulation activities. The remaining 33.91% held by "Others" suggests a moderate level of retail participation, though the overall distribution still leans toward centralization compared to more mature cryptocurrencies.
Click to view current CAPS Holding Distribution
| Top |
Address |
Holding Qty |
Holding (%) |
| 1 |
0x2a3d...ca2ede |
510238.04K |
20.40% |
| 2 |
0x5fc0...a462ab |
403159.18K |
16.12% |
| 3 |
0x0000...00dead |
265316.09K |
10.61% |
| 4 |
0xb6d7...936e31 |
264794.00K |
10.59% |
| 5 |
0xcbb5...d7971c |
209350.00K |
8.37% |
| - |
Others |
847142.69K |
33.91% |
II. Core Factors Influencing CAPS Future Price
Supply Mechanism
- Minting and Burning Mechanism: The minting and burning mechanism of CAPS tokens has a substantial impact on long-term price dynamics. This mechanism directly affects token circulation supply and market equilibrium.
- Historical Pattern: Different CAPS token minting and burning mechanisms have demonstrated material effects on long-term price performance. The balance between token creation and destruction serves as a key determinant of supply-side pressure.
- Current Impact: Market demand and supply balance remain the key factors in price determination. The interplay between minting rates and burning activities continues to shape price expectations.
Institutional and Major Holder Dynamics
- Holder Concentration: Investors should pay attention to holder concentration levels to assess potential investment risks. High concentration may indicate increased volatility risk.
- Liquidity Depth: Market liquidity depth serves as an important indicator for investment risk management. Deeper liquidity typically corresponds to lower execution risk and price slippage.
Macroeconomic Environment
- Monetary Policy Impact: Long-term low interest rates and monetary easing policies have influenced asset pricing across markets. Changes in monetary policy stance may affect investor risk appetite and capital flows.
- Inflation Hedging Attribute: Core inflation metrics have shown varied patterns across different economies. The relationship between inflation dynamics and digital asset performance remains a subject of ongoing market observation.
- Geopolitical Factors: Geopolitical risk changes represent a potential factor affecting market sentiment. International developments may influence investor behavior and market dynamics.
Technical Development and Ecosystem Building
- Market Dynamics Monitoring: Investors continue to focus on market dynamics and policy changes. The evolution of technical infrastructure and ecosystem development may influence long-term value proposition.
- Liquidity Considerations: The depth and breadth of market liquidity serve as important metrics for assessing investment conditions. Adequate liquidity supports price discovery and reduces transaction costs.
III. 2026-2031 CAPS Price Prediction
2026 Outlook
- Conservative prediction: $0.00042 - $0.00062
- Neutral prediction: approximately $0.00062
- Optimistic prediction: up to $0.00066 (requires favorable market conditions)
2027-2029 Outlook
- Market stage expectation: The token is anticipated to enter a gradual growth phase, with price volatility potentially reflecting broader market sentiment and ecosystem development progress.
- Price range predictions:
- 2027: $0.00051 - $0.00089
- 2028: $0.00059 - $0.00095
- 2029: $0.00063 - $0.00126
- Key catalysts: Sustained ecosystem expansion, potential increase in adoption rates, and favorable macroeconomic conditions for digital assets could serve as primary drivers for price appreciation during this period.
2030-2031 Long-term Outlook
- Baseline scenario: $0.00087 - $0.00106 (assuming steady market conditions and consistent project development)
- Optimistic scenario: $0.00124 - $0.00142 (contingent upon accelerated adoption and positive regulatory developments)
- Transformative scenario: approaching $0.00169 (under exceptionally favorable conditions including widespread integration and significant market expansion)
- February 3, 2026: CAPS trading within the early-stage range of $0.00042 - $0.00066 (initial prediction period)
| Year |
Predicted High Price |
Predicted Average Price |
Predicted Low Price |
Price Change |
| 2026 |
0.00066 |
0.00062 |
0.00042 |
0 |
| 2027 |
0.00089 |
0.00064 |
0.00051 |
3 |
| 2028 |
0.00095 |
0.00076 |
0.00059 |
24 |
| 2029 |
0.00126 |
0.00086 |
0.00063 |
39 |
| 2030 |
0.00142 |
0.00106 |
0.00087 |
72 |
| 2031 |
0.00169 |
0.00124 |
0.0007 |
101 |
IV. CAPS Professional Investment Strategy and Risk Management
CAPS Investment Methodology
(1) Long-term Holding Strategy
- Target investors: Investors with high risk tolerance who believe in the NFT data transmission sector and Polkadot ecosystem development
- Operational recommendations:
- Consider establishing positions during market corrections when price approaches recent lows
- Maintain diversified portfolio allocation, avoiding over-concentration in single assets
- Storage solution: Use Gate Web3 Wallet for secure custody with multi-signature protection and regular backup of private keys
(2) Active Trading Strategy
- Technical analysis tools:
- Moving averages: Monitor 7-day and 30-day moving averages to identify trend reversals; current downtrend suggests cautious approach
- Volume analysis: Track 24-hour trading volume patterns to confirm price movements and potential breakout signals
- Swing trading considerations:
- Given recent volatility (24H high: $0.0007587, low: $0.000548), set clear stop-loss levels at 10-15% below entry points
- Monitor market sentiment indicators and NFT sector trends for optimal entry and exit timing
CAPS Risk Management Framework
(1) Asset Allocation Principles
- Conservative investors: 1-2% of crypto portfolio
- Aggressive investors: 3-5% of crypto portfolio
- Professional investors: Up to 10% with active hedging strategies
(2) Risk Hedging Solutions
- Portfolio diversification: Combine CAPS with established Layer-1 tokens and stablecoins to reduce volatility exposure
- Position sizing: Use dollar-cost averaging to mitigate timing risk, especially given current 86.82% decline from all-time high
(3) Secure Storage Solutions
- Hot wallet recommendation: Gate Web3 Wallet for active trading with enhanced security features
- Cold storage solution: For long-term holdings exceeding $1,000, consider hardware wallet integration with Gate Web3
- Security precautions: Never share private keys, enable two-factor authentication, verify contract addresses (ETH: 0x03be5c903c727ee2c8c4e9bc0acc860cca4715e2) before transactions
V. CAPS Potential Risks and Challenges
CAPS Market Risks
- High volatility: 24-hour price fluctuation of 38.41% (high-low differential) indicates significant short-term risk
- Liquidity concerns: Limited exchange listings (2 exchanges) and moderate 24-hour volume ($16,502) may result in slippage during large transactions
- Market sentiment: Current downward trend across multiple timeframes (7D: -13.17%, 30D: -18.82%, 1Y: -86.82%) reflects bearish market conditions
CAPS Regulatory Risks
- NFT regulatory uncertainty: Evolving global regulations on NFT assets may impact Ternoa's data transmission use cases
- Compliance requirements: Potential classification changes for utility tokens could affect accessibility in certain jurisdictions
- Cross-border data regulations: Privacy laws regarding blockchain-based data storage may create operational challenges
CAPS Technical Risks
- Smart contract vulnerabilities: ETH-based contract requires ongoing security audits to prevent exploits
- Network dependency: Reliance on Polkadot Substrate technology means systemic risks from underlying infrastructure
- Development execution: Success depends on team's ability to deliver on NFT data transmission roadmap and achieve mainstream adoption
VI. Conclusion and Action Recommendations
CAPS Investment Value Assessment
CAPS presents a specialized value proposition in the NFT data transmission sector, leveraging Polkadot's Substrate technology to enable generational data transfer. However, current market conditions reveal significant challenges: the token trades 99.73% below its all-time high of $0.227823, with consistent downward pressure across all major timeframes. The relatively modest market capitalization of approximately $1.13 million and limited exchange availability suggest early-stage risk. While the project's focus on democratizing blockchain through NFT-based memory preservation offers unique utility, investors should carefully weigh the long-term vision against substantial short-term volatility and execution risks.
CAPS Investment Recommendations
✅ Beginners: Limit exposure to less than 1% of total crypto portfolio; focus on education about NFT infrastructure before investing; use only funds you can afford to lose entirely
✅ Experienced investors: Consider small speculative positions during accumulation phases; monitor development milestones and Polkadot ecosystem growth; implement strict stop-loss protocols
✅ Institutional investors: Conduct thorough due diligence on team, technology stack, and competitive positioning; evaluate liquidity constraints for position sizing; consider strategic allocation as part of broader NFT infrastructure thesis
CAPS Trading Participation Methods
- Spot trading: Purchase CAPS directly on Gate.com with USDT or other major cryptocurrency pairs for immediate ownership
- Dollar-cost averaging: Establish systematic purchase schedules to reduce timing risk and build positions gradually over time
- Portfolio integration: Combine CAPS with complementary Polkadot ecosystem projects and established NFT platforms for diversified exposure
Cryptocurrency investment carries extremely high risk, and this article does not constitute investment advice. Investors should make prudent decisions based on their own risk tolerance and are advised to consult professional financial advisors. Never invest more than you can afford to lose.
FAQ
What is CAPS token? What are its main uses?
CAPS is the governance token of Capverse, enabling community voting and platform decision-making. It serves as the foundation of the Capverse ecosystem, allowing holders to participate in protocol governance and shape the platform's development direction.
What are the main factors influencing CAPS price prediction?
CAPS price is primarily influenced by supply and demand dynamics, market sentiment, trading volume, news events, and overall market trends. Investor confidence and adoption rate also play significant roles in price movements.
How to analyze CAPS historical price trends and technical indicators?
Analyze CAPS price trends using technical signals including strong buy, buy, sell, and strong sell. Apply pivot point analysis such as Fibonacci, Camarilla, Woody, and DeMark levels. Monitor trading volume and support/resistance levels to identify potential price movements and market trends.
What are expert views on CAPS price predictions for 2024?
Experts predict CAPS will experience moderate growth in 2024 driven by increasing market adoption and utility expansion. Price movements depend on overall crypto market conditions and technological developments within the CAPS ecosystem.
What risks should I consider when investing in CAPS?
When investing in CAPS, pay attention to code vulnerabilities, protocol mechanism risks, counterparty risks, and cUSD decoupling risks. Conduct thorough research before participating.
What are the differences and advantages of CAPS compared to other cryptocurrencies?
CAPS offers superior transaction speed and lower fees than competitors, making it ideal for frequent trading. Its optimized blockchain technology enhances network scalability, ensuring excellent performance during high-traffic periods.
* The information is not intended to be and does not constitute financial advice or any other recommendation of any sort offered or endorsed by Gate.