2026 ISP Price Prediction: How Internet Service Provider Rates Will Change in the Coming Year


Introduction: ISP's Market Position and Investment Value
Ispolink (ISP), as a decentralized recruitment platform powered by Binance Smart Chain and AI technology, has been bridging blockchain companies with top technical talent since its launch in 2021. As of February 2026, ISP maintains a market capitalization of approximately $985,889, with a circulating supply of around 9.46 billion tokens, and the price stabilizes at roughly $0.00010426. This asset, recognized as a "Web3 talent ecosystem facilitator," is playing an increasingly significant role in decentralized recruitment and blockchain workforce solutions.
This article will comprehensively analyze ISP's price trends from 2026 to 2031, combining historical patterns, market supply and demand dynamics, ecosystem development, and macroeconomic environments to provide investors with professional price forecasts and practical investment strategies.
I. ISP Price History Review and Market Status
ISP Historical Price Evolution Trajectory
- May 2021: Token launched with an initial price of $0.001598, marking the beginning of market trading
- November 2021: Reached all-time high of $0.01830029 on November 8, representing significant early growth momentum
- 2022-2024: Extended bear market cycle, price gradually declined from peak levels
- December 2025: Hit all-time low of $0.00008478 on December 26, reflecting intense market pressure
- 2025-2026: Price experienced approximately 82.42% decline over the past year, indicating sustained downward trend
ISP Current Market Situation
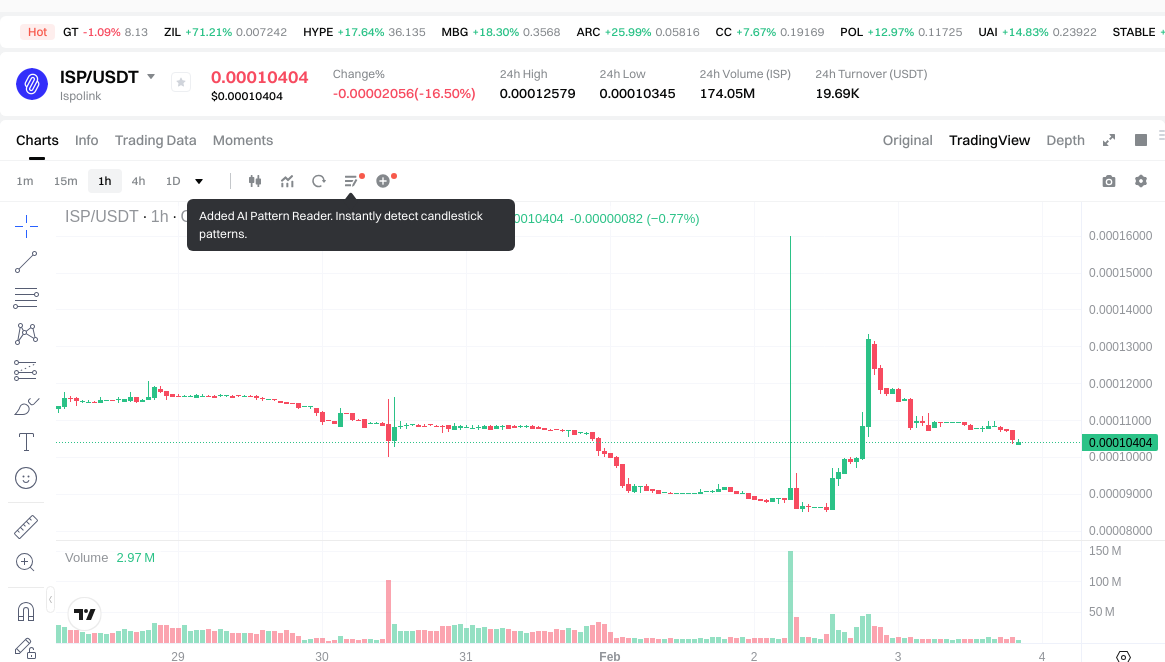
As of February 3, 2026, ISP is trading at $0.00010426, with a 24-hour trading volume of $19,974.26. The token has shown notable volatility in recent periods, declining 17.28% over the past 24 hours and 8.95% over the past 7 days. The 30-day performance indicates a 17.61% decrease.
The market capitalization stands at approximately $985,889, with a circulating supply of 9.46 billion ISP tokens, representing 94.56% of the total supply of 9.79 billion tokens. The maximum supply is capped at 10 billion tokens. The fully diluted market cap is calculated at $1.02 million, with ISP holding a 0.000037% market share in the broader cryptocurrency market.
The token's 24-hour price range fluctuated between $0.00010345 and $0.00012579. Current market sentiment indicators reflect an "Extreme Fear" reading with a volatility index of 17, suggesting cautious investor sentiment. The token holder count stands at 5,405 addresses.
Click to view current ISP market price
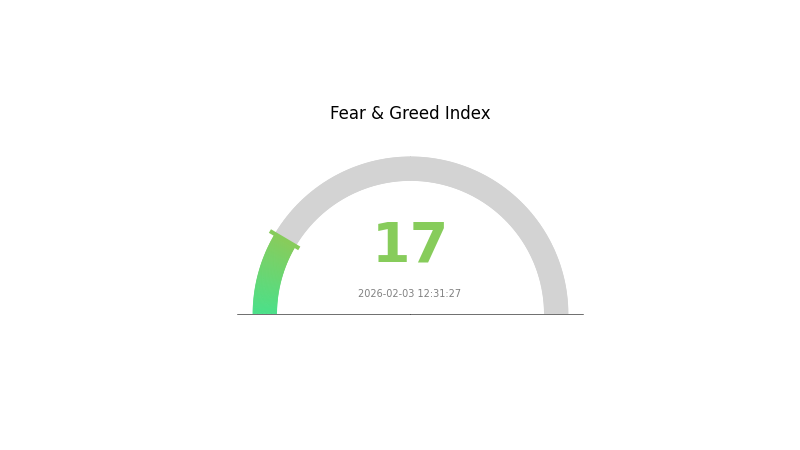
ISP Market Sentiment Index
2026-02-03 Fear and Greed Index: 17 (Extreme Fear)
Click to view current Fear & Greed Index
The cryptocurrency market is experiencing extreme fear, with the Fear and Greed Index plummeting to 17. This indicates severe market pessimism and heightened risk aversion among investors. Such extreme fear levels typically present contrarian opportunities for long-term investors, as panic selling often creates attractive entry points. However, caution is warranted in the short term, as negative sentiment can persist and drive prices lower. Monitor market developments closely before making investment decisions. Consider dollar-cost averaging strategies to mitigate timing risks during this volatile period.
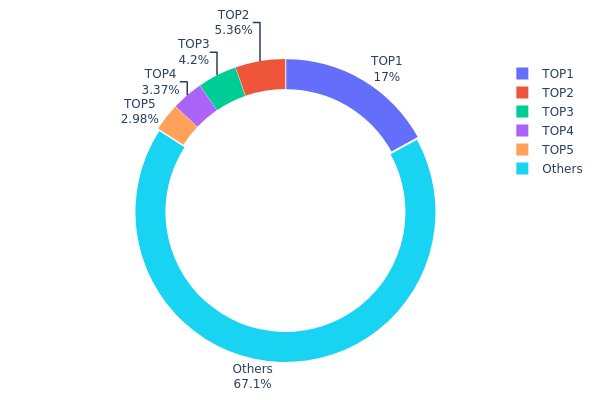
ISP Holding Distribution
The holding distribution chart reveals the concentration of token supply across different wallet addresses, serving as a key indicator of decentralization and market structure health. By analyzing the proportion of tokens held by top addresses versus the broader holder base, investors can assess potential concentration risks and the likelihood of significant price impacts from large holder actions.
According to current on-chain data, ISP exhibits a moderate concentration pattern with the top 5 addresses collectively holding approximately 32.9% of the total supply. The largest holder controls 1,428,103.16K tokens (17.01%), while the remaining four top addresses each hold between 2.97% and 5.36%. Notably, address 0x0000...00dead represents a burn address holding 4.19% of supply, effectively removing these tokens from circulation. The distribution demonstrates that roughly 67.1% of tokens remain dispersed among other holders, suggesting a relatively balanced ownership structure compared to projects with extreme whale dominance.
This distribution pattern indicates a reasonably healthy decentralization level that mitigates single-entity manipulation risks while maintaining sufficient liquidity concentration for market stability. The presence of a significant burn address positively impacts the circulating supply dynamics, potentially supporting long-term value preservation. However, the top holder's 17.01% stake warrants monitoring, as movements from this address could trigger notable price volatility. Overall, the current structure reflects a maturing token economy with adequate distribution across multiple stakeholders, reducing systemic risks associated with excessive centralization.
Click to view current ISP Holding Distribution
| Top | Address | Holding Qty | Holding (%) |
|---|---|---|---|
| 1 | 0x2677...ccb975 | 1428103.16K | 17.01% |
| 2 | 0x9642...2f5d4e | 450014.20K | 5.36% |
| 3 | 0x0000...00dead | 352500.00K | 4.19% |
| 4 | 0x1c4b...bb558c | 283048.63K | 3.37% |
| 5 | 0x446b...d027ba | 250093.01K | 2.97% |
| - | Others | 5631134.45K | 67.1% |
II. Core Factors Influencing ISP's Future Price
Supply Mechanism
- Market Growth and Supply Expansion: The global ISP chip market is transitioning from growth stage to maturity stage, maintaining a compound annual growth rate above 18%. The Chinese market demonstrates even stronger momentum with a growth rate reaching 24%, significantly exceeding the global average.
- Historical Patterns: Cost reduction has been a consistent driver in lowering terminal product prices, facilitating market penetration and expansion. The integration of built-in ISP and AP technologies has historically improved efficiency without requiring fundamental design changes.
- Current Impact: The market continues to experience supply expansion driven by increasing penetration of multi-camera smartphones. Price trends from 2019 to 2030 show gradual adjustments reflecting technological advancement and economies of scale.
Institutional and Major Player Dynamics
- Corporate Adoption: Mobile phone manufacturers are increasingly investing in ISP chip development, viewing it as strategic beyond imaging functions. This reflects concerns about supply chain security and technological independence.
- Industry Applications: ISP technology is expanding into various sectors including AI-enhanced imaging products, with price ranges varying significantly based on performance and materials (from $100 to $3,000 in the North American night vision market).
Macroeconomic Environment
- Market Demand Drivers: Consumer price sensitivity remains a critical factor, with cost reduction capabilities directly influencing market share. The ability to lower terminal product prices through integrated ISP solutions continues to drive competitive advantages.
- Regional Market Dynamics: China's information industry has become an economic growth engine with substantial resource investment since 1997, creating the world's largest telecommunications market. This infrastructure development supports sustained demand for ISP technologies.
Technological Development and Ecosystem Building
- AI Integration: The convergence of AI technology with ISP systems (AI-ISP) represents a significant development direction, with potential applications in software optimization and enhanced imaging capabilities.
- Industry Barriers: Entry barriers include technical expertise requirements, established supply relationships, and the need for close integration between ISP and application processors, which creates both challenges and opportunities for market participants.
- Application Expansion: ISP technology is moving beyond traditional smartphone applications into diverse sectors including outdoor equipment, security systems, and specialized imaging products, expanding the addressable market and use cases.
III. 2026-2031 ISP Price Prediction
2026 Outlook
- Conservative estimate: $0.00009
- Neutral estimate: $0.0001
- Optimistic estimate: $0.00014
2027-2029 Mid-term Outlook
- Market stage expectations: ISP is anticipated to enter a gradual growth phase, with price fluctuations reflecting broader market sentiment and potential adoption developments.
- Price range predictions:
- 2027: $0.00008 - $0.00017, average around $0.00012
- 2028: $0.0001 - $0.00016, average around $0.00014
- 2029: $0.0001 - $0.00022, average around $0.00015
- Key catalysts: The projected price increase of approximately 15% in 2027, 38% in 2028, and 43% in 2029 may be driven by improved market adoption, ecosystem expansion, and favorable macroeconomic conditions in the crypto sector.
2030-2031 Long-term Outlook
- Baseline scenario: $0.00009 - $0.0002 in 2030 (assuming steady market conditions and moderate growth trajectory)
- Optimistic scenario: $0.00014 - $0.00027 in 2031 (contingent upon significant adoption milestones and sustained bullish market momentum)
- Transformational scenario: Price ranges could extend beyond current predictions if breakthrough developments materialize in the ISP ecosystem
- 2026-02-03: ISP maintains a stable position with an expected average price of $0.0001, establishing a foundation for potential future growth
| Year | Predicted High Price | Predicted Average Price | Predicted Low Price | Price Change |
|---|---|---|---|---|
| 2026 | 0.00014 | 0.0001 | 0.00009 | 0 |
| 2027 | 0.00017 | 0.00012 | 0.00008 | 15 |
| 2028 | 0.00016 | 0.00014 | 0.0001 | 38 |
| 2029 | 0.00022 | 0.00015 | 0.0001 | 43 |
| 2030 | 0.0002 | 0.00018 | 0.00009 | 75 |
| 2031 | 0.00027 | 0.00019 | 0.00014 | 82 |
IV. ISP Professional Investment Strategy and Risk Management
ISP Investment Methodology
(1) Long-Term Holding Strategy
- Target Investors: Blockchain technology enthusiasts and investors seeking exposure to AI-powered recruitment platforms
- Operational Recommendations:
- Conduct thorough due diligence on Ispolink's platform development and user adoption metrics
- Monitor the platform's integration progress with Binance Smart Chain and Polygon L2 solutions
- Consider implementing a dollar-cost averaging approach to mitigate entry timing risks
- Storage Solution: Utilize Gate Web3 Wallet for secure multi-chain asset management, supporting both ETH and BSC networks where ISP tokens are deployed
(2) Active Trading Strategy
- Technical Analysis Tools:
- Moving Averages: Monitor 50-day and 200-day moving averages to identify potential trend reversals and momentum shifts
- Volume Analysis: Track the 24-hour trading volume ($19,974.26) against historical patterns to gauge market interest and liquidity conditions
- Swing Trading Considerations:
- Establish clear entry and exit points based on the 24-hour range ($0.00010345 - $0.00012579)
- Set stop-loss orders to manage downside risk, particularly given the recent 17.28% decline over 24 hours
ISP Risk Management Framework
(1) Asset Allocation Principles
- Conservative Investors: 1-2% portfolio allocation
- Aggressive Investors: 3-5% portfolio allocation
- Professional Investors: Up to 8% portfolio allocation with active monitoring
(2) Risk Hedging Strategies
- Diversification Strategy: Balance ISP holdings with established cryptocurrencies and stablecoins to reduce portfolio volatility
- Position Sizing: Limit individual position size based on the token's relatively low market capitalization of approximately $985,889
(3) Secure Storage Solutions
- Multi-Chain Wallet Recommendation: Gate Web3 Wallet supports both Ethereum and BSC networks, enabling secure management of ISP tokens across both deployment chains
- Cold Storage Option: Consider transferring long-term holdings to hardware storage solutions for enhanced security
- Security Precautions: Never share private keys, enable two-factor authentication, and verify contract addresses (ETH: 0xc8807f0f5ba3fa45ffbdc66928d71c5289249014, BSC: 0xd2e7b964770fcf51df088a5f0bb2d33a3c60cccf) before transactions
V. ISP Potential Risks and Challenges
ISP Market Risks
- Price Volatility: The token has experienced an 82.42% decline over the past year, indicating substantial market volatility and downside risk
- Liquidity Concerns: With a 24-hour trading volume of approximately $19,974, the market depth may be insufficient for large transactions without significant price impact
- Market Capitalization Risk: The fully diluted market cap of approximately $1,020,820 represents a relatively small market presence, increasing susceptibility to market manipulation
ISP Regulatory Risks
- Recruitment Platform Compliance: The intersection of blockchain technology and employment services may face evolving regulatory scrutiny across different jurisdictions
- Token Utility Classification: Regulatory bodies may reassess the classification of tokens used for purchasing recruitment packages and platform services
- Cross-Border Employment Regulations: The platform's global nature may encounter challenges with varying labor and data privacy laws
ISP Technical Risks
- Smart Contract Vulnerabilities: The platform's reliance on smart contracts for payment processing and reward distribution introduces potential security risks
- Multi-Chain Complexity: Operating across Ethereum, BSC, and Polygon L2 increases technical complexity and potential points of failure
- Platform Adoption Risk: The success of ISP tokens is closely tied to user adoption of the Ispolink recruitment platform, which faces competition from established Web2 and emerging Web3 alternatives
VI. Conclusion and Action Recommendations
ISP Investment Value Assessment
Ispolink (ISP) represents an innovative approach to blockchain-based recruitment services, leveraging AI technology and multi-chain infrastructure. However, the token faces considerable challenges, including a circulating supply of 9.46 billion tokens (94.56% of maximum supply), recent price declines across multiple timeframes, and limited market liquidity. The platform's utility-driven tokenomics, including recruitment package purchases and staking rewards, provide fundamental use cases, but adoption metrics and competitive positioning require careful monitoring. The substantial year-over-year decline of 82.42% and current trading near historical lows suggests elevated near-term risks alongside potential recovery opportunities for risk-tolerant investors.
ISP Investment Recommendations
✅ Beginners: Limit exposure to micro-cap tokens like ISP; if interested, allocate no more than 1% of your crypto portfolio and focus on understanding the platform's core value proposition before investing
✅ Experienced Investors: Consider ISP as a speculative position within a diversified portfolio, maintaining strict position sizing and implementing technical stop-loss levels given recent downward momentum
✅ Institutional Investors: Conduct comprehensive due diligence on platform metrics, user growth, and competitive landscape; consider waiting for clearer adoption trends before establishing positions
ISP Trading Participation Methods
- Spot Trading: Purchase ISP tokens directly on Gate.com, which offers trading pairs for this asset with liquidity aggregation across supported networks
- Multi-Chain Access: Acquire tokens on either Ethereum or BSC networks depending on transaction cost preferences and existing wallet infrastructure
- Gradual Accumulation: Implement a systematic investment approach to mitigate timing risk in volatile micro-cap markets
Cryptocurrency investment carries extreme risks, and this article does not constitute investment advice. Investors should make prudent decisions based on their own risk tolerance and are advised to consult professional financial advisors. Never invest more than you can afford to lose.
FAQ
What are the main factors influencing ISP price prediction?
ISP price prediction is primarily influenced by market demand, network adoption rate, trading volume, technology upgrades, competitive landscape, and macroeconomic conditions. These factors collectively shape price movements and market trends.
How to analyze historical data to predict internet service provider price changes?
Analyze historical pricing data for trends and patterns using statistical models. Track transaction volume, market sentiment, and technical indicators. Use data visualization tools to identify support/resistance levels and forecast future price movements based on identified patterns.
What are the differences in ISP price prediction models across different regions?
Regional ISP price prediction models differ based on local economic conditions, market demand, and regulatory policies. They account for regional market dynamics, competition levels, and liquidity variations. Local trading volume and service provider differences also influence price forecasts across regions.
How does the development of 5G and fiber optic networks impact ISP price prediction?
5G and fiber network expansion reduces ISP operating costs and increases service competition, potentially driving prices down. Enhanced infrastructure and improved connectivity standards may create downward pricing pressure in the ISP market through 2026-2027.
What is the relationship between ISP price and network bandwidth and service quality?
ISP price is directly proportional to network bandwidth and service quality. Higher bandwidth and better service quality (lower latency, lower packet loss) command higher prices. Choose ISP based on your actual needs and performance requirements.
What is the development trend of ISP service prices in the next 3-5 years?
ISP service prices are projected to rise steadily over the next 3-5 years, with a compound annual growth rate of 3.61%. Market scale is expected to grow from $1.01461 billion in 2026 to $1.39649 billion by 2035, driven by technological advancement and increasing demand.
How much does competition level affect the accuracy of ISP price prediction?
High competition typically reduces ISP price prediction accuracy due to increased market volatility and uncertainty. Intense competition creates larger price fluctuations and greater complexity in modeling. Changes in market share further impact prediction model effectiveness.
What are the applications of machine learning and AI in ISP price prediction?
Machine learning and AI analyze market data, trading volume, and user behavior patterns to predict ISP price trends. These technologies enable real-time price forecasting, identify support and resistance levels, and optimize predictive models through historical data analysis for improved accuracy.
Share
Content
Introduction: ISP's Market Position and Investment Value
I. ISP Price History Review and Market Status
II. Core Factors Influencing ISP's Future Price
III. 2026-2031 ISP Price Prediction
IV. ISP Professional Investment Strategy and Risk Management
V. ISP Potential Risks and Challenges
VI. Conclusion and Action Recommendations
FAQ
How to Buy Cryptocurrency


Trending Cryptocurrencies


XZXX: A Comprehensive Guide to the BRC-20 Meme Token in 2025

Survey Note: Detailed Analysis of the Best AI in 2025

Detailed Analysis of the Best 10 GameFi Projects to Play and Earn in 2025

Kaspa’s Journey: From BlockDAG Innovation to Market Buzz
Best Crypto Wallets 2025: How to Choose and Secure Your Digital Assets
Popular GameFi Games in 2025

7 Essential Trading Indicators for Beginner Traders

Top 5 Coins to Mine Without Upfront Investment

TLOS vs OP: A Comprehensive Comparison of Two Leading Layer-2 Solutions in the Blockchain Ecosystem

ETHS vs QNT: A Comprehensive Comparison of Two Leading Enterprise Blockchain Solutions
TREAT vs ADA: Understanding the Key Differences Between Two Major Disability Rights Frameworks
