TURBOS vs DOT: A Comprehensive Comparison of Two Rising Blockchain Platforms


Introduction: Investment Comparison Between TURBOS and DOT
In the cryptocurrency market, the comparison between TURBOS vs DOT has become a topic of interest for investors. These two assets differ significantly in market cap ranking, application scenarios, and price performance, representing distinct positioning within the crypto asset landscape.
TURBOS (TURBOS): Launched in 2023, this token operates as a non-custodial DEX on the Sui blockchain, focusing on horizontal scalability and digital asset ownership. Backed by Jump Crypto and Mysten Labs, Turbos Finance aims to bridge the Sui ecosystem with broader DeFi markets.
DOT (DOT): Introduced in 2019, Polkadot has established itself as a multi-chain protocol designed to connect private chains, consortium chains, public chains, and oracle networks. It facilitates trustless information and transaction exchange between independent blockchains through its relay chain architecture.
This article will provide a comprehensive analysis of TURBOS vs DOT across historical price trends, supply mechanisms, institutional adoption, technological ecosystems, and future projections, addressing the question many investors are asking:
"Which is the better buy right now?"
I. Historical Price Comparison and Current Market Status
TURBOS (Coin A) and DOT (Coin B) Historical Price Trends
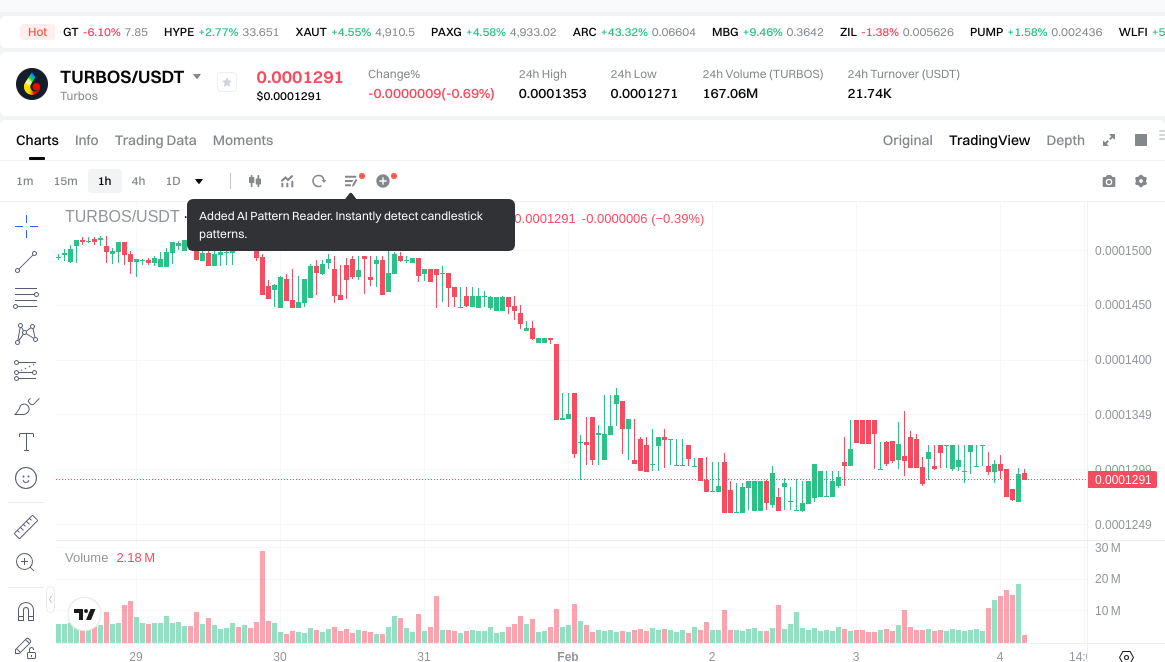
- 2023: TURBOS reached an all-time high of $0.024 on May 15, 2023, following its initial launch on the Sui ecosystem. The token experienced significant volatility in its early trading period.
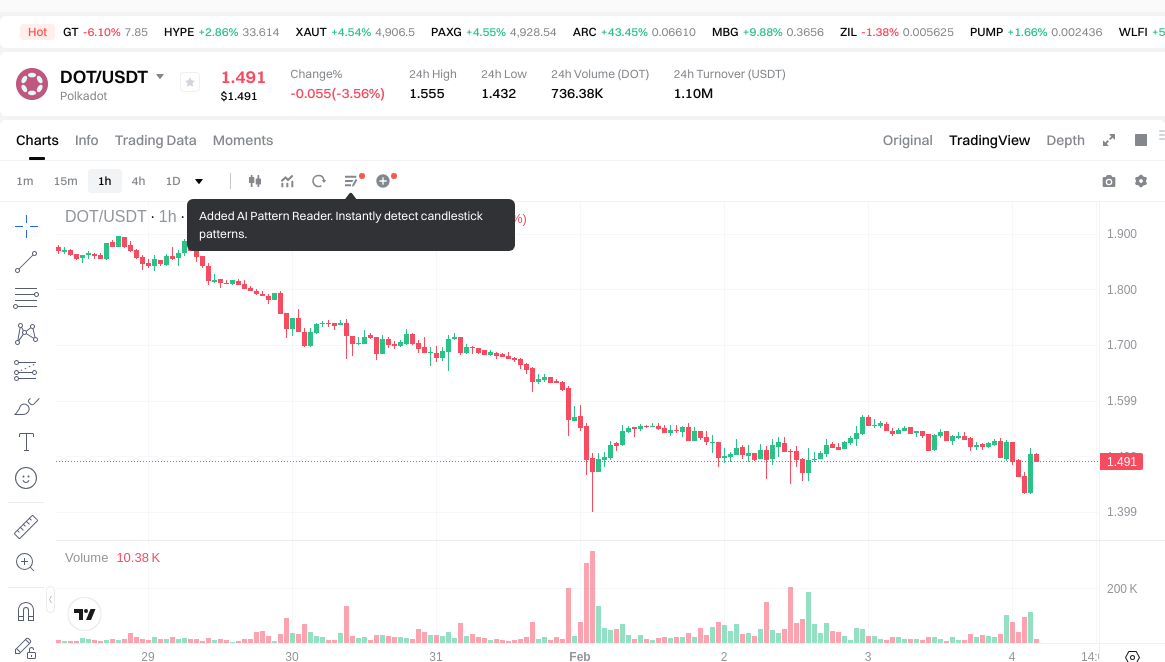
- 2021: DOT achieved its all-time high of $54.98 on November 4, 2021, during the broader cryptocurrency market bull run. This peak reflected strong investor confidence in Polkadot's multi-chain interoperability vision.
- Comparative Analysis: During the 2023-2026 market cycle, TURBOS declined from its peak of $0.024 to a low of $0.0000707 recorded on December 17, 2023, representing a decline of approximately 99.7%. In contrast, DOT fell from its 2021 high of $54.98 to its all-time low of $1.44 on February 4, 2026, marking a decrease of approximately 97.4%.
Current Market Conditions (February 4, 2026)
- TURBOS current price: $0.0001297
- DOT current price: $1.50
- 24-hour trading volume: TURBOS recorded $21,531 compared to DOT's $1,101,669
- Market Sentiment Index (Fear & Greed Index): 17 (Extreme Fear)
View real-time prices:
- Check current TURBOS price Market Price
- Check current DOT price Market Price
II. Core Factors Influencing TURBOS vs DOT Investment Value
Supply Mechanism Comparison (Tokenomics)
The supply mechanisms of TURBOS and DOT represent different approaches to token economics, though specific details about TURBOS's supply model are not extensively documented in available sources. Understanding these mechanisms helps assess long-term value retention potential.
For cryptocurrencies generally, supply mechanisms fall into several categories: fixed supply models create scarcity similar to precious metals, while deflationary models gradually reduce circulating supply through burning or other mechanisms. Some projects implement periodic reduction events (halving mechanisms) that systematically decrease new token issuance over time.
📌 Historical patterns suggest that supply mechanisms can significantly influence price cycles. Projects with predictable supply schedules may exhibit cyclical price movements correlated with supply changes, while those with flexible or governance-determined supply face different dynamics shaped by community decisions and market conditions.
Institutional Adoption and Market Applications
Institutional Interest Patterns
Institutional positioning toward different cryptocurrency assets varies based on risk profiles, regulatory clarity, and use case alignment. Established blockchain networks with longer operational histories and clearer regulatory frameworks tend to attract institutional capital more readily.
Enterprise Utilization Comparison
Both TURBOS and DOT serve different roles within the broader cryptocurrency ecosystem. Enterprise adoption depends on factors including transaction speed, cost efficiency, interoperability capabilities, and ecosystem maturity. Cross-border payment applications, settlement systems, and portfolio diversification strategies each favor different technical characteristics.
Regulatory Landscape
Government approaches to cryptocurrency regulation continue evolving globally. Some jurisdictions maintain supportive frameworks encouraging blockchain innovation, while others implement restrictive measures. Regulatory clarity significantly impacts institutional adoption rates and market accessibility for different cryptocurrency assets.
Technical Development and Ecosystem Building
Technical Evolution Trajectories
Cryptocurrency projects undergo continuous technical refinement to improve scalability, security, and functionality. Polkadot's architecture emphasizes interoperability through its parachain model, enabling specialized blockchains to connect within a unified framework. Technical upgrades across blockchain networks typically aim to enhance transaction throughput, reduce costs, and expand capability sets.
Ecosystem Comparison Across Key Sectors
Decentralized finance (DeFi) applications, non-fungible token (NFT) platforms, payment infrastructure, and smart contract implementations represent major ecosystem development areas. Mature ecosystems demonstrate diversity across these categories, with active developer communities, robust tooling, and sustained user engagement.
The depth and breadth of ecosystem development often correlates with network effect strength, which can influence long-term adoption trajectories and value accrual potential.
Macroeconomic Context and Market Cycles
Performance During Inflationary Periods
Different cryptocurrency assets exhibit varying characteristics during high inflation environments. Some function primarily as speculative assets whose value fluctuates with risk appetite, while others develop utility-driven value propositions less correlated with traditional inflation hedges. Asset behavior during inflationary periods depends on multiple factors including liquidity, adoption breadth, and perceived store-of-value characteristics.
Macroeconomic Policy Influences
Central bank interest rate decisions, monetary policy stances, and currency strength indicators (particularly the U.S. dollar index) influence cryptocurrency market dynamics. Tightening monetary conditions typically reduce risk asset valuations, while accommodative policies may support speculative positioning. These relationships remain complex and context-dependent.
Geopolitical Considerations
International developments affecting cross-border transaction needs, capital flow restrictions, and financial system accessibility can impact cryptocurrency adoption patterns. Geopolitical tensions occasionally drive increased interest in decentralized financial alternatives, though sustained adoption depends on practical usability and regulatory acceptance in key jurisdictions.
III. 2026-2031 Price Forecast: TURBOS vs DOT
Short-term Forecast (2026)
- TURBOS: Conservative $0.000089562 - $0.0001298 | Optimistic $0.000154462
- DOT: Conservative $0.80514 - $1.491 | Optimistic $1.65501
Mid-term Forecast (2028-2029)
- TURBOS may enter a consolidation phase, with estimated price range of $0.00008022584295 - $0.0001665064665 in 2028, expanding to $0.000100130934172 - $0.000182778689362 by 2029
- DOT may enter a growth phase, with estimated price range of $1.83860689425 - $1.99024457625 in 2028, potentially reaching $1.6708577085375 - $2.6811437648625 by 2029
- Key drivers: institutional capital inflows, ETF developments, ecosystem expansion
Long-term Forecast (2031)
- TURBOS: Baseline scenario $0.000136549985372 - $0.00018452700726 | Optimistic scenario $0.000239885109439
- DOT: Baseline scenario $2.624698888609842 - $2.762840935378781 | Optimistic scenario $3.287780713100749
Disclaimer
TURBOS:
| Year | Predicted High Price | Predicted Average Price | Predicted Low Price | Price Change |
|---|---|---|---|---|
| 2026 | 0.000154462 | 0.0001298 | 0.000089562 | 0 |
| 2027 | 0.00016060803 | 0.000142131 | 0.0000994917 | 9 |
| 2028 | 0.0001665064665 | 0.000151369515 | 0.00008022584295 | 16 |
| 2029 | 0.000182778689362 | 0.00015893799075 | 0.000100130934172 | 22 |
| 2030 | 0.000198195674465 | 0.000170858340056 | 0.000160606839652 | 31 |
| 2031 | 0.000239885109439 | 0.00018452700726 | 0.000136549985372 | 42 |
DOT:
| Year | Predicted High Price | Predicted Average Price | Predicted Low Price | Price Change |
|---|---|---|---|---|
| 2026 | 1.65501 | 1.491 | 0.80514 | 0 |
| 2027 | 2.21793705 | 1.573005 | 1.2269439 | 4 |
| 2028 | 1.99024457625 | 1.895471025 | 1.83860689425 | 26 |
| 2029 | 2.6811437648625 | 1.942857800625 | 1.6708577085375 | 29 |
| 2030 | 3.213681088013812 | 2.31200078274375 | 1.803360610540125 | 54 |
| 2031 | 3.287780713100749 | 2.762840935378781 | 2.624698888609842 | 84 |
IV. Investment Strategy Comparison: TURBOS vs DOT
Long-term vs Short-term Investment Strategies
-
TURBOS: May appeal to speculative investors focused on emerging DeFi protocols within the Sui ecosystem, though the asset exhibits considerable volatility and limited liquidity as reflected in its 24-hour trading volume of $21,531. The token's performance since launch suggests heightened risk characteristics suitable primarily for participants with high risk tolerance seeking exposure to early-stage decentralized exchange infrastructure.
-
DOT: May suit investors interested in established multi-chain interoperability protocols with broader ecosystem development and higher liquidity, evidenced by its $1,101,669 daily trading volume. Polkadot's longer operational history and established parachain architecture represent a comparatively mature technical foundation, though past price performance indicates substantial volatility common across cryptocurrency assets.
Risk Management and Asset Allocation
Asset allocation approaches vary based on individual risk profiles, investment horizons, and portfolio objectives. Different investor categories may consider distinct positioning strategies:
-
Conservative approach: Portfolios emphasizing capital preservation might allocate minimal exposure to highly volatile cryptocurrency assets, potentially favoring established networks with longer operational histories and greater liquidity over newer protocols with limited track records.
-
Growth-oriented approach: Investors seeking higher potential returns while accepting increased volatility might consider diversified exposure across multiple cryptocurrency assets with different risk-return profiles, balancing established networks against emerging protocols.
-
Hedging mechanisms: Risk management tools include stablecoin allocations for liquidity management, derivative instruments where available and appropriate, and diversification across uncorrelated or low-correlation asset categories. Portfolio construction should align with individual circumstances, risk tolerance, and investment objectives.
V. Potential Risk Comparison
Market Risks
-
TURBOS: Trading at $0.0001297 as of February 4, 2026, the asset demonstrates limited liquidity with $21,531 in 24-hour volume, potentially creating challenges during periods of market stress. Price volatility remains substantial, with the token having declined approximately 99.7% from its all-time high. The current market sentiment index of 17 (Extreme Fear) reflects challenging broader market conditions.
-
DOT: Priced at $1.50 with $1,101,669 in daily trading volume, Polkadot exhibits greater liquidity than TURBOS while still demonstrating significant volatility characteristic of cryptocurrency markets. The asset has declined approximately 97.4% from its 2021 peak, reflecting both project-specific factors and broader market dynamics.
Technical Risks
-
TURBOS: As a newer protocol operating on the Sui blockchain, technical considerations include network scalability as adoption grows, smart contract security within its DEX implementation, and the overall maturity of the Sui ecosystem infrastructure. Limited operational history provides fewer data points for assessing long-term technical resilience.
-
DOT: Polkadot's parachain architecture introduces complexity in maintaining security across connected chains and ensuring efficient cross-chain communication. Technical evolution continues through ongoing upgrades aimed at enhancing scalability and functionality. Network stability depends on validator participation and governance mechanisms.
Regulatory Risks
Global regulatory frameworks for cryptocurrency assets continue evolving, with different jurisdictions implementing varying approaches. Established networks with longer operational histories may face different regulatory scrutiny than newer protocols. Decentralized exchange protocols like TURBOS and interoperability platforms like Polkadot each intersect with regulatory considerations around securities classification, trading infrastructure, and cross-border transactions. Regulatory developments can materially impact accessibility, trading venues, and institutional participation for both assets.
VI. Conclusion: Which Is the Better Buy?
📌 Investment Value Summary
-
TURBOS highlights: Represents early-stage exposure to DeFi infrastructure within the Sui ecosystem, backed by notable entities including Jump Crypto and Mysten Labs. The protocol focuses on non-custodial trading with horizontal scalability, though current market positioning reflects limited liquidity and substantial volatility.
-
DOT highlights: Offers exposure to an established multi-chain interoperability protocol with a longer operational history dating to 2019. Polkadot's parachain architecture enables specialized blockchain connectivity, supported by a more developed ecosystem and higher trading liquidity compared to TURBOS.
✅ Investment Considerations
-
Newer market participants: May benefit from thorough research into fundamental cryptocurrency concepts, risk characteristics, and portfolio management principles before committing capital. Understanding volatility patterns, liquidity dynamics, and market cycles provides important context for investment decisions.
-
Experienced market participants: Might evaluate positioning based on portfolio diversification objectives, risk-adjusted return expectations, and views on ecosystem development trajectories. Comparative analysis of technical fundamentals, adoption metrics, and macroeconomic conditions can inform allocation decisions.
-
Institutional participants: Assessment criteria typically encompass regulatory clarity, custody solutions, liquidity depth, operational infrastructure maturity, and alignment with investment mandates. Due diligence processes examine technical architecture, governance structures, and ecosystem sustainability.
⚠️ Risk Notice: Cryptocurrency markets exhibit extreme volatility. This content does not constitute investment advice, financial guidance, or recommendations to buy, sell, or hold any assets. Investment decisions should be based on individual circumstances, risk tolerance, and independent research or consultation with qualified financial professionals.
VII. FAQ
Q1: What is the primary difference between TURBOS and DOT in terms of blockchain functionality?
TURBOS operates as a non-custodial decentralized exchange (DEX) on the Sui blockchain, while DOT (Polkadot) functions as a multi-chain interoperability protocol connecting various blockchain networks. TURBOS focuses specifically on horizontal scalability for digital asset trading within the Sui ecosystem, launched in 2023 with backing from Jump Crypto and Mysten Labs. In contrast, Polkadot, introduced in 2019, provides infrastructure for trustless communication between independent blockchains through its relay chain and parachain architecture, enabling specialized chains to connect within a unified framework for cross-chain information and transaction exchange.
Q2: How do the liquidity levels of TURBOS and DOT compare as of February 4, 2026?
DOT demonstrates significantly higher liquidity with a 24-hour trading volume of $1,101,669 compared to TURBOS's $21,531. This represents approximately 51 times greater daily trading activity for DOT. Higher liquidity typically translates to easier entry and exit positions, tighter bid-ask spreads, and reduced price impact during transactions. The substantial difference reflects DOT's longer market presence since 2019, broader exchange listings, and more established user base compared to TURBOS, which launched in 2023 and operates within the more nascent Sui ecosystem.
Q3: Which asset has declined more from its all-time high, and what does this indicate?
TURBOS has declined approximately 99.7% from its all-time high of $0.024 (May 15, 2023) to $0.0001297, while DOT has fallen approximately 97.4% from its peak of $54.98 (November 4, 2021) to $1.50. Although both assets have experienced severe drawdowns characteristic of cryptocurrency bear markets, TURBOS shows a slightly steeper percentage decline. This may reflect its status as a newer protocol with less established market positioning, limited trading history, and exposure to the emerging Sui ecosystem. Both declines underscore the extreme volatility inherent in cryptocurrency markets and the importance of risk management regardless of asset selection.
Q4: What factors should investors consider when choosing between TURBOS and DOT for portfolio allocation?
Investors should evaluate risk tolerance, investment horizon, and portfolio diversification objectives. TURBOS represents higher-risk exposure to early-stage DeFi infrastructure with limited liquidity ($21,531 daily volume) but potential upside if the Sui ecosystem gains adoption. DOT offers exposure to a more established protocol with greater liquidity ($1,101,669 daily volume), longer operational history since 2019, and broader ecosystem development across its parachain network. Conservative approaches might favor DOT's relative maturity, while growth-oriented strategies accepting substantial volatility might allocate smaller portions to TURBOS. Both assets exhibit extreme price fluctuations, require thorough due diligence, and should align with individual financial circumstances and risk capacity rather than speculative sentiment.
Q5: How do the price forecasts for 2031 compare between TURBOS and DOT?
The 2031 baseline forecast for TURBOS ranges from $0.000136549985372 to $0.00018452700726, with an optimistic scenario reaching $0.000239885109439. For DOT, the baseline projection spans $2.624698888609842 to $2.762840935378781, with an optimistic scenario of $3.287780713100749. In percentage terms, TURBOS shows a projected increase of 42% from current levels by 2031, while DOT indicates an 84% potential increase. However, these projections represent analytical estimates based on historical patterns, technical factors, and market assumptions—not guarantees. Actual outcomes depend on numerous variables including ecosystem development, regulatory changes, macroeconomic conditions, competitive dynamics, and adoption trajectories that remain inherently uncertain in the cryptocurrency sector.
Q6: What regulatory risks should investors be aware of when considering TURBOS versus DOT?
Both assets face evolving regulatory landscapes that vary across jurisdictions. TURBOS, as a decentralized exchange protocol, intersects with regulatory considerations around trading infrastructure, securities classification for tokens traded on its platform, and DeFi oversight frameworks that remain under development globally. DOT's interoperability protocol faces scrutiny related to cross-chain transaction facilitation, potential classification questions regarding its token utility versus security characteristics, and governance mechanism regulations. Established networks like Polkadot with longer operational histories may receive different regulatory treatment than newer protocols like TURBOS. Regulatory developments can materially impact exchange listings, institutional participation, geographic accessibility, and compliance requirements. Investors should monitor jurisdiction-specific regulatory announcements and consider how changing frameworks might affect each asset's accessibility and utility within their investment strategy.
Q7: What role does ecosystem maturity play in the investment comparison between TURBOS and DOT?
Ecosystem maturity significantly influences long-term viability and adoption potential. DOT benefits from operation since 2019, enabling development of its parachain network with specialized blockchains, established developer communities, diverse DeFi applications, and proven interoperability infrastructure. This maturity translates to greater resilience, broader use case validation, and network effects that can support sustained value. TURBOS, launched in 2023, operates within the newer Sui ecosystem with less established infrastructure, fewer integrated applications, and limited operational track record. While this creates potential upside if Sui gains traction, it also introduces execution risk regarding ecosystem growth, developer adoption, and competitive positioning. Mature ecosystems typically demonstrate diversity across DeFi, NFT platforms, payment infrastructure, and smart contract implementations—factors that correlate with network effect strength and long-term adoption trajectories affecting investment value.
Q8: How does the current market sentiment of "Extreme Fear" (index: 17) affect investment decisions for TURBOS and DOT?
The Fear & Greed Index reading of 17 indicates "Extreme Fear" in cryptocurrency markets as of February 4, 2026, reflecting pessimistic sentiment, risk aversion, and potential capitulation among market participants. Historically, extreme fear periods have sometimes preceded market bottoms, though timing remains uncertain and past patterns don't guarantee future outcomes. For TURBOS and DOT specifically, extreme fear conditions may create entry opportunities for investors with long-term horizons and high risk tolerance, as assets trade at depressed valuations relative to historical levels. However, extreme fear can also precede further declines if fundamental conditions deteriorate. Lower liquidity assets like TURBOS ($21,531 daily volume) may experience amplified volatility during fear-driven sell-offs compared to more liquid assets like DOT ($1,101,669 volume). Investment decisions should prioritize individual risk capacity, portfolio objectives, and fundamental analysis rather than attempting to time market sentiment reversals.
Share
Content
Introduction: Investment Comparison Between TURBOS and DOT
I. Historical Price Comparison and Current Market Status
II. Core Factors Influencing TURBOS vs DOT Investment Value
III. 2026-2031 Price Forecast: TURBOS vs DOT
IV. Investment Strategy Comparison: TURBOS vs DOT
V. Potential Risk Comparison
VI. Conclusion: Which Is the Better Buy?
VII. FAQ
How to Buy Cryptocurrency


Trending Cryptocurrencies


2025 SUI coin: price, buying guide, and Staking rewards

How to Buy Crypto: A Step-by-Step Guide with Gate.com

HNT Price in 2025: Helium Network Token Value and Market Analysis
What is SwissCheese (SWCH) and How Does It Democratize Investment?

Cardano (ADA) Price Analysis and Outlook for 2025

How to Invest in Metaverse Crypto

Is Fireverse (FIR) a good investment?: A Comprehensive Analysis of the Metaverse Platform's Potential, Risks, and Market Prospects

Is OverProtocol (OVER) a good investment?: A Comprehensive Analysis of Risk, Potential, and Market Outlook for 2024

Is Overlay Protocol (OVL) a good investment?: A Comprehensive Analysis of Risk, Tokenomics, and Market Potential

Is Keep3rV1 (KP3R) a good investment?: A Comprehensive Analysis of Market Potential, Risk Factors, and Future Prospects
Comprehensive Guide to Altcoin Bull Markets