2026 OOOO Price Prediction: Expert Analysis and Market Forecast for the Coming Year


Introduction: OOOO's Market Position and Investment Value
OOOO (OOOO) is an AI-driven full-spectrum collaboration platform that breaks down barriers between multi-chain, multi-protocol, and multi-application environments. Since its inception, the project has attracted attention in the decentralized ecosystem for its innovative approach to cross-chain interoperability. As of February 2026, OOOO has a market capitalization of approximately $173,667, with around 158.6 million tokens in circulation, and the price is maintained at approximately $0.001095. This asset, characterized by its AI-powered collaborative infrastructure, is playing an increasingly important role in facilitating seamless interactions across diverse blockchain networks.
This article will comprehensively analyze OOOO's price trends from 2026 to 2031, combining historical patterns, market supply and demand dynamics, ecosystem development, and macroeconomic environment factors to provide investors with professional price forecasts and practical investment strategies.
I. OOOO Price History Review and Market Status
OOOO Historical Price Evolution Trajectory
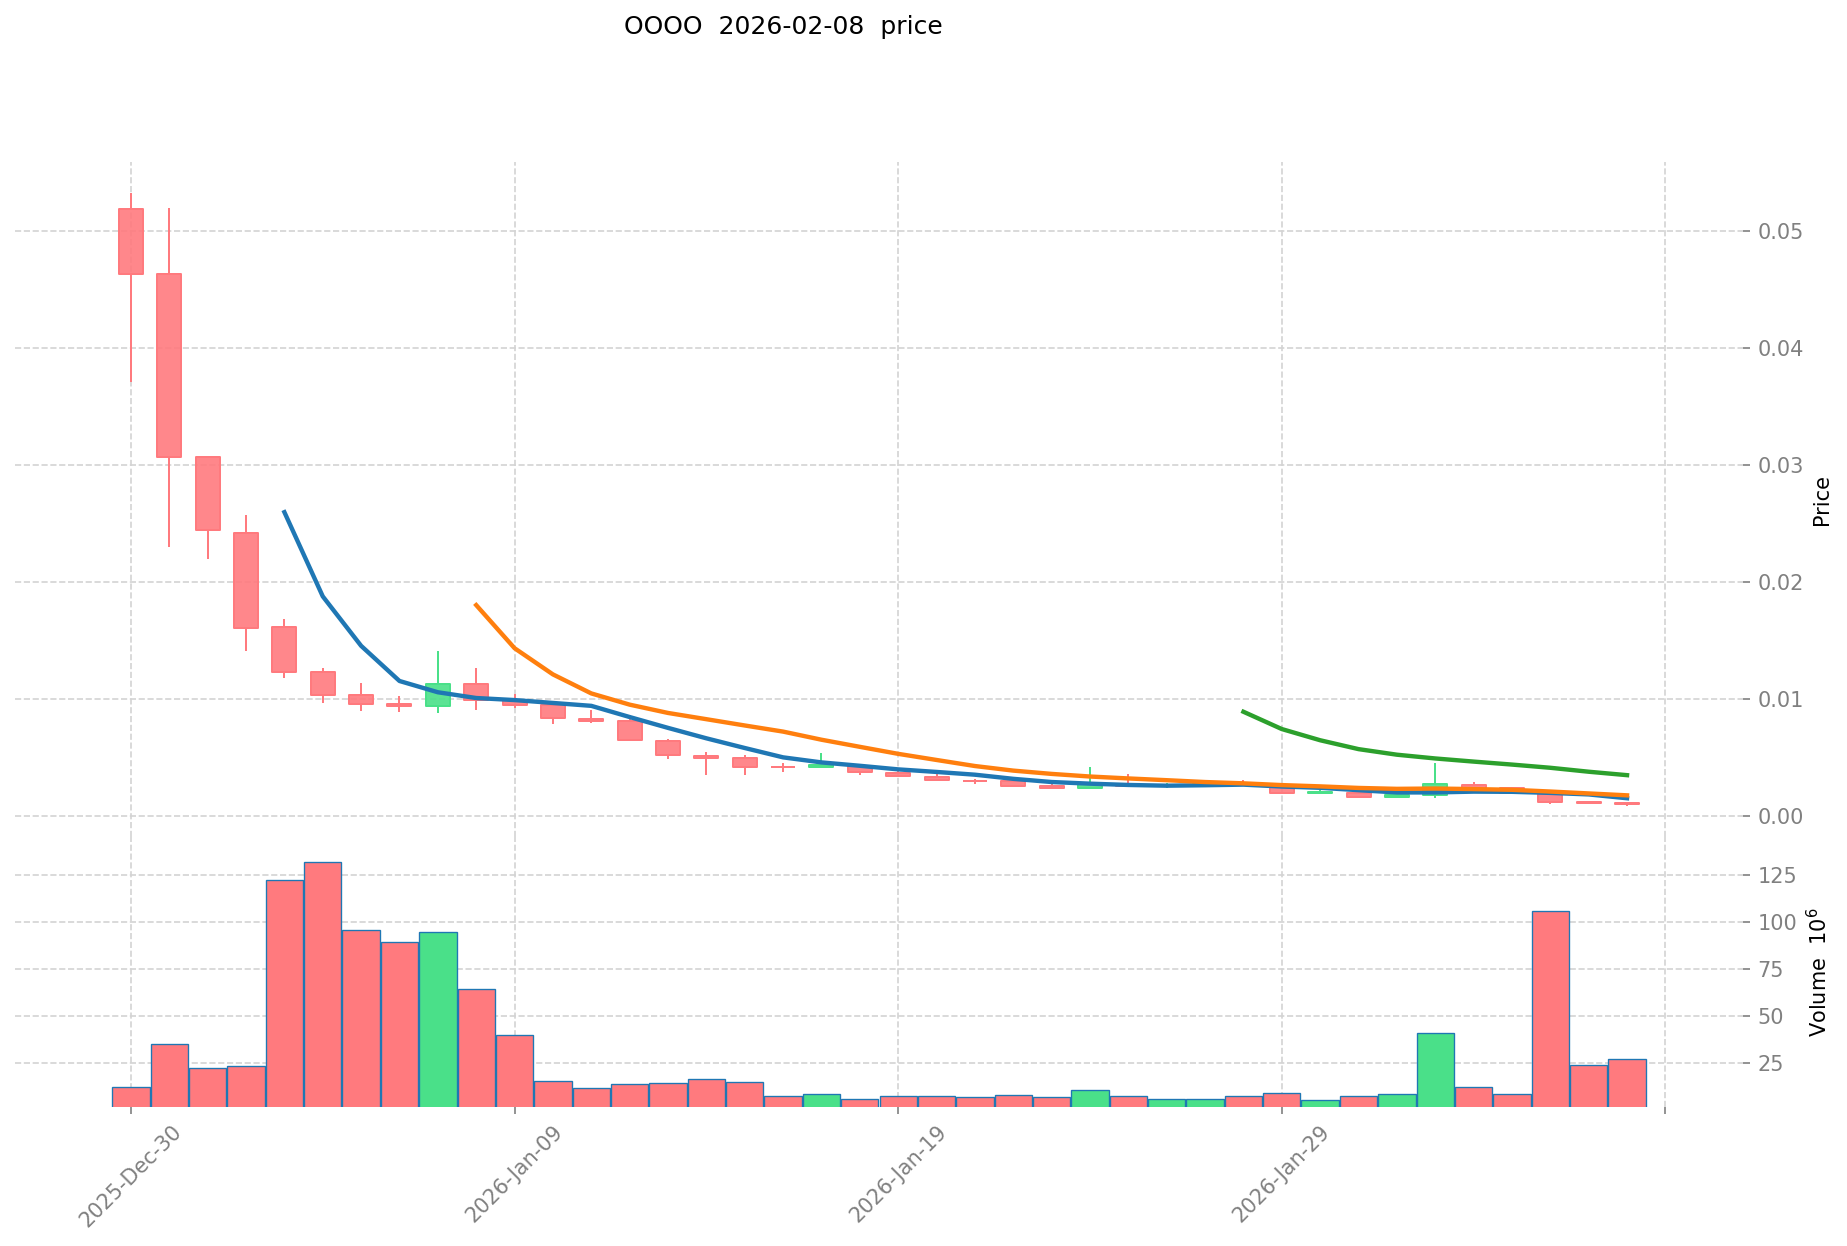
- 2025: OOOO reached its all-time high of $0.05331 on December 30, 2025, marking a significant peak in its early trading period.
- 2026: The token experienced a sharp decline, dropping to its all-time low of $0.00084 on February 7, 2026, representing a substantial correction from its historical peak.
OOOO Current Market Status
As of February 9, 2026, OOOO is trading at $0.001095, showing a 4.38% increase over the past 24 hours. The token has demonstrated mixed performance across different timeframes, with a modest 0.27% gain in the last hour. However, the broader trend reveals notable pressure, with a 41.16% decline over the past week and an 88.37% decrease over the past 30 days. The annual performance shows a 98.61% decline from its previous levels.
The market capitalization stands at approximately $173,667, with a circulating supply of 158.6 million tokens out of a maximum supply of 1 billion tokens, resulting in a circulation ratio of 15.86%. The fully diluted market cap is calculated at $1,095,000. The 24-hour trading volume registers at $10,069.62, with the token's market dominance at 0.000043%.
OOOO currently ranks #4,119 in the cryptocurrency market and is listed on 6 exchanges. The token has attracted 59,432 holders and operates on the BSC blockchain with the contract address 0xf0a28bddac9d3045c95bf57df033e80685d881c0. The market sentiment index indicates a reading of 7, reflecting extreme fear in the current market environment.
Click to view the current OOOO market price
Crypto Market Sentiment Index
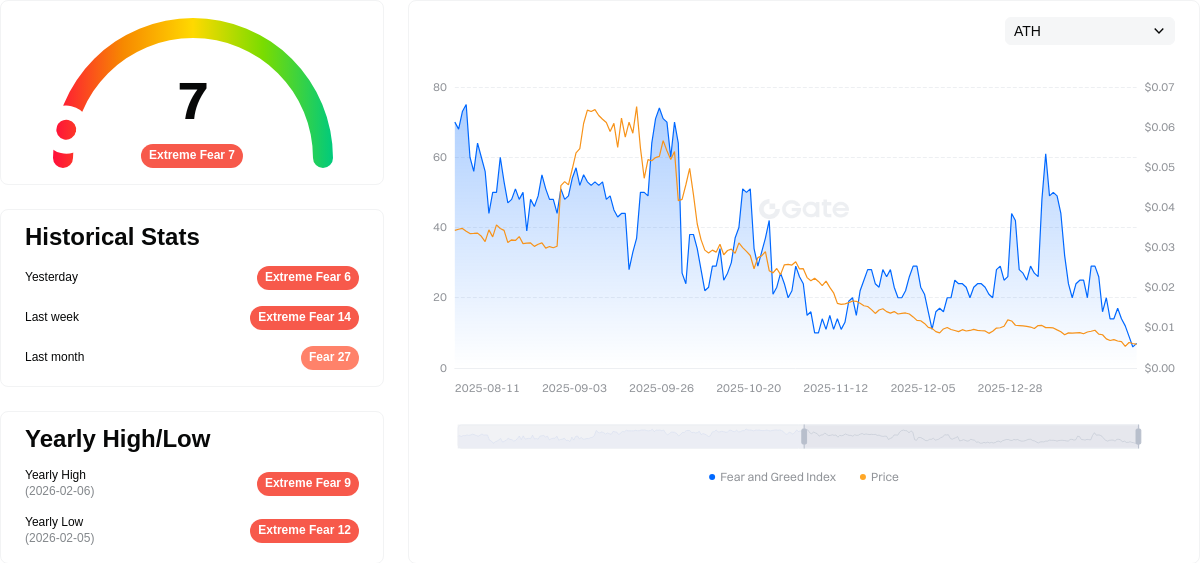
2026-02-08 Fear and Greed Index: 7 (Extreme Fear)
Click to view current Fear & Greed Index
The cryptocurrency market is currently experiencing extreme fear, with the Fear and Greed Index hitting 7. This exceptionally low reading indicates intense investor pessimism and widespread market anxiety. During such periods, panic selling often dominates trading activity, creating significant downward pressure on asset prices. However, contrarian investors view extreme fear as a potential buying opportunity, as excessive pessimism may have priced in worst-case scenarios. Market participants should remain cautious, conduct thorough research, and avoid making impulsive decisions driven by fear. Historical patterns suggest that markets often recover from extreme fear conditions, rewarding disciplined, long-term investors.
OOOO Holdings Distribution
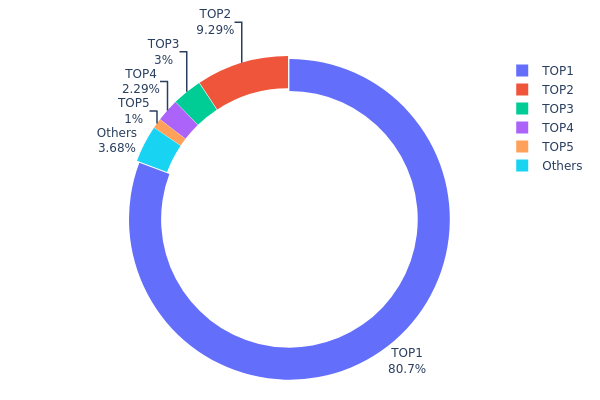
The holdings distribution chart visualizes the proportion of total token supply held by major addresses, serving as a key indicator of token concentration and decentralization level within the blockchain network. By analyzing the distribution pattern across top holders versus smaller participants, this metric reveals the structural composition of token ownership and provides insights into potential market dynamics.
According to the current data, OOOO demonstrates an extremely high concentration pattern. The top address (0x45ed...51bda1) controls approximately 80.74% of the total supply, holding 807,422.22K tokens. The second-ranked address holds 9.29%, while addresses ranked third through fifth collectively account for only 6.27% of the circulating supply. The remaining addresses outside the top 5 hold merely 3.7% of tokens, indicating that over 96% of OOOO's supply is concentrated within five major addresses.
This centralized holding structure presents significant implications for market stability and price volatility. The dominant position of the top holder creates substantial concentration risk, as large-scale transfers or liquidations from this address could trigger severe market reactions. Such distribution patterns typically reduce decentralization characteristics and may increase susceptibility to coordinated market actions. Additionally, the limited distribution among smaller holders suggests relatively weak retail participation and potentially lower organic trading activity across the broader market.
Click to view current OOOO Holdings Distribution
| Top | Address | Holding Qty | Holding (%) |
|---|---|---|---|
| 1 | 0x45ed...51bda1 | 807422.22K | 80.74% |
| 2 | 0x73d8...4946db | 92936.57K | 9.29% |
| 3 | 0x238a...d5e6c4 | 29976.43K | 2.99% |
| 4 | 0x0d07...b492fe | 22884.48K | 2.28% |
| 5 | 0x83ba...da540e | 10000.00K | 1.00% |
| - | Others | 36780.30K | 3.7% |
II. Core Factors Influencing OOOO's Future Price
Market Demand and Leverage Dynamics
- Leverage Trading Impact: The availability of 1-400x leverage on futures contracts significantly amplifies both potential returns and risks. Traders can control substantial positions with minimal capital, which intensifies price volatility during favorable or adverse market movements.
- Market Participation: The growing popularity of OOOO derivatives stems from increased institutional engagement and retail traders seeking amplified returns through various contract types, including perpetual contracts offered on trading platforms.
- Pre-market Trading Activity: OOOO's recent listing has generated notable interest through pre-market trading opportunities, which may influence price discovery ahead of official spot market launches.
Institutional and Market Sentiment
- Institutional Participation: Rising institutional involvement has contributed to the expansion of OOOO derivatives markets, potentially providing greater market depth and liquidity.
- Market Sentiment Dynamics: Trader sentiment plays a crucial role in short-term price movements, particularly in leveraged trading environments where sentiment shifts can trigger rapid position adjustments.
- Risk Management Considerations: The high-leverage environment necessitates careful risk management, as even minor price fluctuations can result in significant portfolio impacts or liquidations.
Technical Development and Ecosystem
- AI Omninet Technology: OOOO's core technology focuses on revolutionizing blockchain interoperability by seamlessly translating complex cross-chain user intentions into actual on-chain operations.
- Interoperability Solutions: The project addresses critical pain points in the Web3 space, including blockchain silos and liquidity fragmentation across multi-chain, multi-protocol, and multi-application environments.
- Token Supply Structure: With a total supply of 1,000,000,000 OOOO tokens, the project's tokenomics may influence long-term supply-demand dynamics.
Trading Platform Features
- Contract Flexibility: The availability of various contract types, including USDT-margined and coin-margined contracts, provides traders with multiple strategic options for market participation.
- Hedging Opportunities: Futures contracts enable investors holding spot positions to implement strategic hedging, potentially offsetting downside risks during uncertain market conditions without liquidating actual holdings.
- Market Access: User-friendly platforms with competitive fees and comprehensive tools facilitate both novice and experienced trader participation in OOOO futures markets.
III. 2026-2031 Price Prediction
2026 Outlook
- Conservative prediction: $0.00098 - $0.00106
- Neutral prediction: Around $0.00106
- Optimistic prediction: Up to $0.00149 (requires favorable market conditions)
The 2026 forecast suggests a relatively stable period with modest price fluctuations. The predicted average price of $0.00106 indicates a slight decline of 2% compared to the previous period, reflecting potential consolidation in the market.
2027-2029 Outlook
- Market stage expectation: Recovery and gradual growth phase
- Price range predictions:
- 2027: $0.00078 - $0.00184, with an average of $0.00128 (16% increase)
- 2028: $0.00083 - $0.00227, with an average of $0.00156 (42% increase)
- 2029: $0.00117 - $0.00243, with an average of $0.00192 (74% increase)
- Key catalysts: Progressive market adoption and increased trading volume
This mid-term period shows a consistent upward trajectory, with year-over-year growth accelerating from 16% in 2027 to 74% by 2029. The expanding price ranges suggest increasing market participation and improved liquidity.
2030-2031 Long-term Outlook
- Baseline scenario: $0.00176 - $0.00228 (assuming steady market development)
- Optimistic scenario: $0.00149 - $0.00328 (with enhanced ecosystem growth)
- Transformative scenario: Potential to reach $0.00328 (under highly favorable market conditions)
The long-term forecast indicates substantial growth potential, with 2030 showing a 98% cumulative increase and 2031 projecting a 103% rise. The 2031 average price of $0.00223 represents more than double the 2026 baseline, suggesting significant value appreciation over the five-year period. However, investors should note the widening price ranges, which reflect increased market volatility and uncertainty in longer-term projections.
| Year | Predicted High Price | Predicted Average Price | Predicted Low Price | Price Change |
|---|---|---|---|---|
| 2026 | 0.00149 | 0.00106 | 0.00098 | -2 |
| 2027 | 0.00184 | 0.00128 | 0.00078 | 16 |
| 2028 | 0.00227 | 0.00156 | 0.00083 | 42 |
| 2029 | 0.00243 | 0.00192 | 0.00117 | 74 |
| 2030 | 0.00228 | 0.00217 | 0.00176 | 98 |
| 2031 | 0.00328 | 0.00223 | 0.00149 | 103 |
IV. OOOO Professional Investment Strategy and Risk Management
OOOO Investment Methodology
(I) Long-term Holding Strategy
- Suitable for: Investors who believe in AI-driven multi-chain collaboration technology and have medium to long-term investment horizons
- Operational Recommendations:
- Consider accumulating positions during market pullbacks, given the token's significant decline from its all-time high
- Monitor project development milestones and ecosystem expansion progress
- Storage Solution: Use Gate Web3 Wallet for secure custody with multi-signature protection and hardware wallet integration options
(II) Active Trading Strategy
- Technical Analysis Tools:
- Moving Averages: Track 20-day and 50-day moving averages to identify trend reversals and potential entry points
- Volume Analysis: Monitor trading volume changes relative to the 24-hour average of approximately $10,069 to confirm price movements
- Swing Trading Key Points:
- The token has shown high volatility with a 41.16% decline over 7 days, presenting opportunities for experienced traders
- Set strict stop-loss levels given the 88.37% decline over 30 days to protect capital
OOOO Risk Management Framework
(I) Asset Allocation Principles
- Conservative Investors: 1-2% of crypto portfolio allocation
- Aggressive Investors: 3-5% of crypto portfolio allocation
- Professional Investors: Up to 10% allocation with active hedging strategies
(II) Risk Hedging Solutions
- Portfolio Diversification: Balance OOOO holdings with established cryptocurrencies and stablecoins
- Position Sizing: Implement dollar-cost averaging to mitigate volatility impact
(III) Security Storage Solutions
- Hot Wallet Recommendation: Gate Web3 Wallet for active trading with enhanced security features
- Cold Storage Solution: Transfer long-term holdings to hardware wallets for maximum security
- Security Precautions: Enable two-factor authentication, never share private keys, and regularly verify contract addresses (BSC: 0xf0a28bddac9d3045c95bf57df033e80685d881c0)
V. OOOO Potential Risks and Challenges
OOOO Market Risks
- High Volatility: The token has experienced a 98.61% decline over one year, demonstrating extreme price volatility
- Low Liquidity: With a 24-hour trading volume of approximately $10,069 and circulation on only 6 exchanges, liquidity constraints may impact large transactions
- Market Cap Risk: The relatively small market cap of approximately $173,667 indicates higher susceptibility to market manipulation and sudden price swings
OOOO Regulatory Risks
- Compliance Uncertainty: AI-driven blockchain projects may face evolving regulatory frameworks regarding automated decision-making and cross-chain operations
- Multi-chain Regulatory Complexity: Operating across multiple blockchain protocols may expose the project to varying regulatory requirements in different jurisdictions
- Token Classification: Potential regulatory changes regarding token classification could impact trading and custody requirements
OOOO Technical Risks
- Smart Contract Vulnerability: As a BEP-20 token on BSC, the project relies on smart contract security which may contain undiscovered vulnerabilities
- Cross-chain Integration Complexity: Breaking down barriers between multi-chain environments introduces technical challenges and potential interoperability issues
- Development Risk: The project's ability to deliver on its AI-driven full-spectrum collaboration vision depends on ongoing technical development and team execution
VI. Conclusion and Action Recommendations
OOOO Investment Value Assessment
OOOO presents an innovative approach to AI-driven cross-chain collaboration, addressing the fragmentation in multi-chain ecosystems. However, the token has experienced severe price depreciation with a 98.61% decline from its all-time high of $0.05331 in December 2025 to the current price of approximately $0.001095. The project's small market cap, limited liquidity, and extreme volatility pose significant risks. While the underlying technology vision of breaking down barriers between multi-chain, multi-protocol, and multi-application environments has long-term potential, investors should carefully weigh the high-risk profile against the speculative upside. The current market cap to fully diluted valuation ratio of 15.86% suggests substantial token unlock risk.
OOOO Investment Recommendations
✅ Beginners: Avoid investing in OOOO at this stage due to extreme volatility and high risk; focus on understanding fundamental blockchain concepts first ✅ Experienced Investors: Consider micro-allocations only if you have high risk tolerance and believe in the AI-driven multi-chain vision; implement strict position sizing and stop-loss discipline ✅ Institutional Investors: Conduct thorough due diligence on project development, team credentials, and technical architecture before any allocation; consider waiting for market stabilization and project maturity signals
OOOO Trading Participation Methods
- Spot Trading: Purchase OOOO on Gate.com with limit orders to manage execution price in low-liquidity conditions
- Dollar-Cost Averaging: Spread purchases over time to reduce timing risk given the high volatility
- Portfolio Integration: Use Gate Web3 Wallet to manage OOOO holdings alongside other assets with comprehensive security features
Cryptocurrency investment carries extremely high risk, and this article does not constitute investment advice. Investors should make cautious decisions based on their own risk tolerance and are advised to consult professional financial advisors. Never invest more than you can afford to lose.
FAQ
What is OOOO? What are its fundamentals and use cases?
OOOO represents excellence in technology and innovation fields. It encompasses contributions across information technology, artificial intelligence, and biomedical sectors, driving modern technological advancement and defining next-generation digital economy applications.
What is the historical price trend of OOOO? What are the past price fluctuation patterns?
OOOO has demonstrated a significant upward trajectory historically. Market data shows the sector revenue grew from approximately 2.6 billion USD in 2024 to projected 13.42 billion USD by 2031, with a CAGR of 16.1%. This reflects strong bullish momentum and consistent growth patterns in the token's underlying market fundamentals.
What are the main factors affecting OOOO price?
OOOO price is primarily influenced by market sentiment, regulatory policies, trading volume, macroeconomic conditions, and technological developments in the crypto ecosystem. Market news and investor confidence significantly impact price movements.
How to use technical analysis and fundamental analysis to predict OOOO price?
Use technical analysis by examining historical price and trading volume with indicators like moving averages and MACD. Apply fundamental analysis by evaluating economic factors and project development. Combine both approaches for more accurate price predictions.
What risks exist in OOOO price predictions and how should I rationally view the forecast results?
Price predictions face market volatility, policy changes, and unforeseen events. Rationally evaluate predictions by considering multiple scenarios rather than relying on single forecasts. Maintain a diversified strategy and cautious approach to decision-making.
OOOO与其他类似资产相比,投资前景和价格潜力如何?
OOOO demonstrates strong investment potential with innovative technology foundation and growing market adoption. Compared to similar assets, OOOO offers competitive advantages in transaction volume and ecosystem development. Price appreciation potential remains significant given market expansion trends and technological advancement in the sector.
Share
Content
Introduction: OOOO's Market Position and Investment Value
I. OOOO Price History Review and Market Status
II. Core Factors Influencing OOOO's Future Price
III. 2026-2031 Price Prediction
IV. OOOO Professional Investment Strategy and Risk Management
V. OOOO Potential Risks and Challenges
VI. Conclusion and Action Recommendations
FAQ
How to Buy Cryptocurrency


Trending Cryptocurrencies


Survey Note: Detailed Analysis of the Best AI in 2025

What Is the Best AI Crypto in 2025?

What is the Best AI Now?
Why ChatGPT is Likely the Best AI Now?
How Does Solidus Ai Tech's Market Cap Compare to Other AI Cryptocurrencies?

MomoAI: AI-Powered Social Gaming Revolution on Solana

What is AIX9: A Comprehensive Guide to the Next Generation of Enterprise Computing Solutions

What is KLINK: A Comprehensive Guide to Understanding the Revolutionary Communication Platform

What is ART: A Comprehensive Guide to Understanding Assisted Reproductive Technology and Its Impact on Modern Fertility Treatment
What is KAR: A Comprehensive Guide to Knowledge and Reasoning Systems in Modern Technology

What is MART: A Comprehensive Guide to Multi-Agent Reinforcement Learning Through Time