This comprehensive analysis examines Treecle (TRCL), a blockchain-based second-hand car trading platform, providing expert price predictions from 2026 to 2031 on Gate exchange. The article reviews TRCL's historical performance, current market position at $0.0007405 with $737,943 market capitalization, and identifies key price drivers including market sentiment, regulatory environment, and macroeconomic conditions. Detailed forecasts project conservative scenarios at $0.00071-$0.00074 for 2026, with potential growth to $0.00125-$0.00165 by 2031 under favorable conditions. Designed for both beginners and experienced investors, this guide presents practical investment strategies including long-term holding, active trading methodologies, and comprehensive risk management frameworks specific to TRCL's volatile, low-liquidity trading environment on Gate.
Introduction: TRCL's Market Position and Investment Value
Treecle (TRCL), as a blockchain-based platform focused on the second-hand car trading market, has been operating since 2021. As of February 2026, TRCL's market capitalization stands at approximately $737,943, with a circulating supply of about 996.55 million tokens, and the price maintaining around $0.0007405. This asset, designed to provide transparent and reliable second-hand vehicle transactions through blockchain and hash value technology, is playing an increasingly important role in the automotive trading sector.
This article will comprehensively analyze TRCL's price trends from 2026 to 2031, combining historical patterns, market supply and demand dynamics, ecosystem development, and macroeconomic conditions to provide investors with professional price forecasts and practical investment strategies.
I. TRCL Price History Review and Market Status
TRCL Historical Price Evolution Trajectory
- 2021: TRCL reached its all-time high on April 4, with the price climbing to $0.300077
- 2022: The token experienced significant market correction, dropping to its all-time low of $0.000039 on December 25
- 2023-2026: The token has undergone a gradual recovery phase, with price fluctuations reflecting broader market conditions
TRCL Current Market Situation
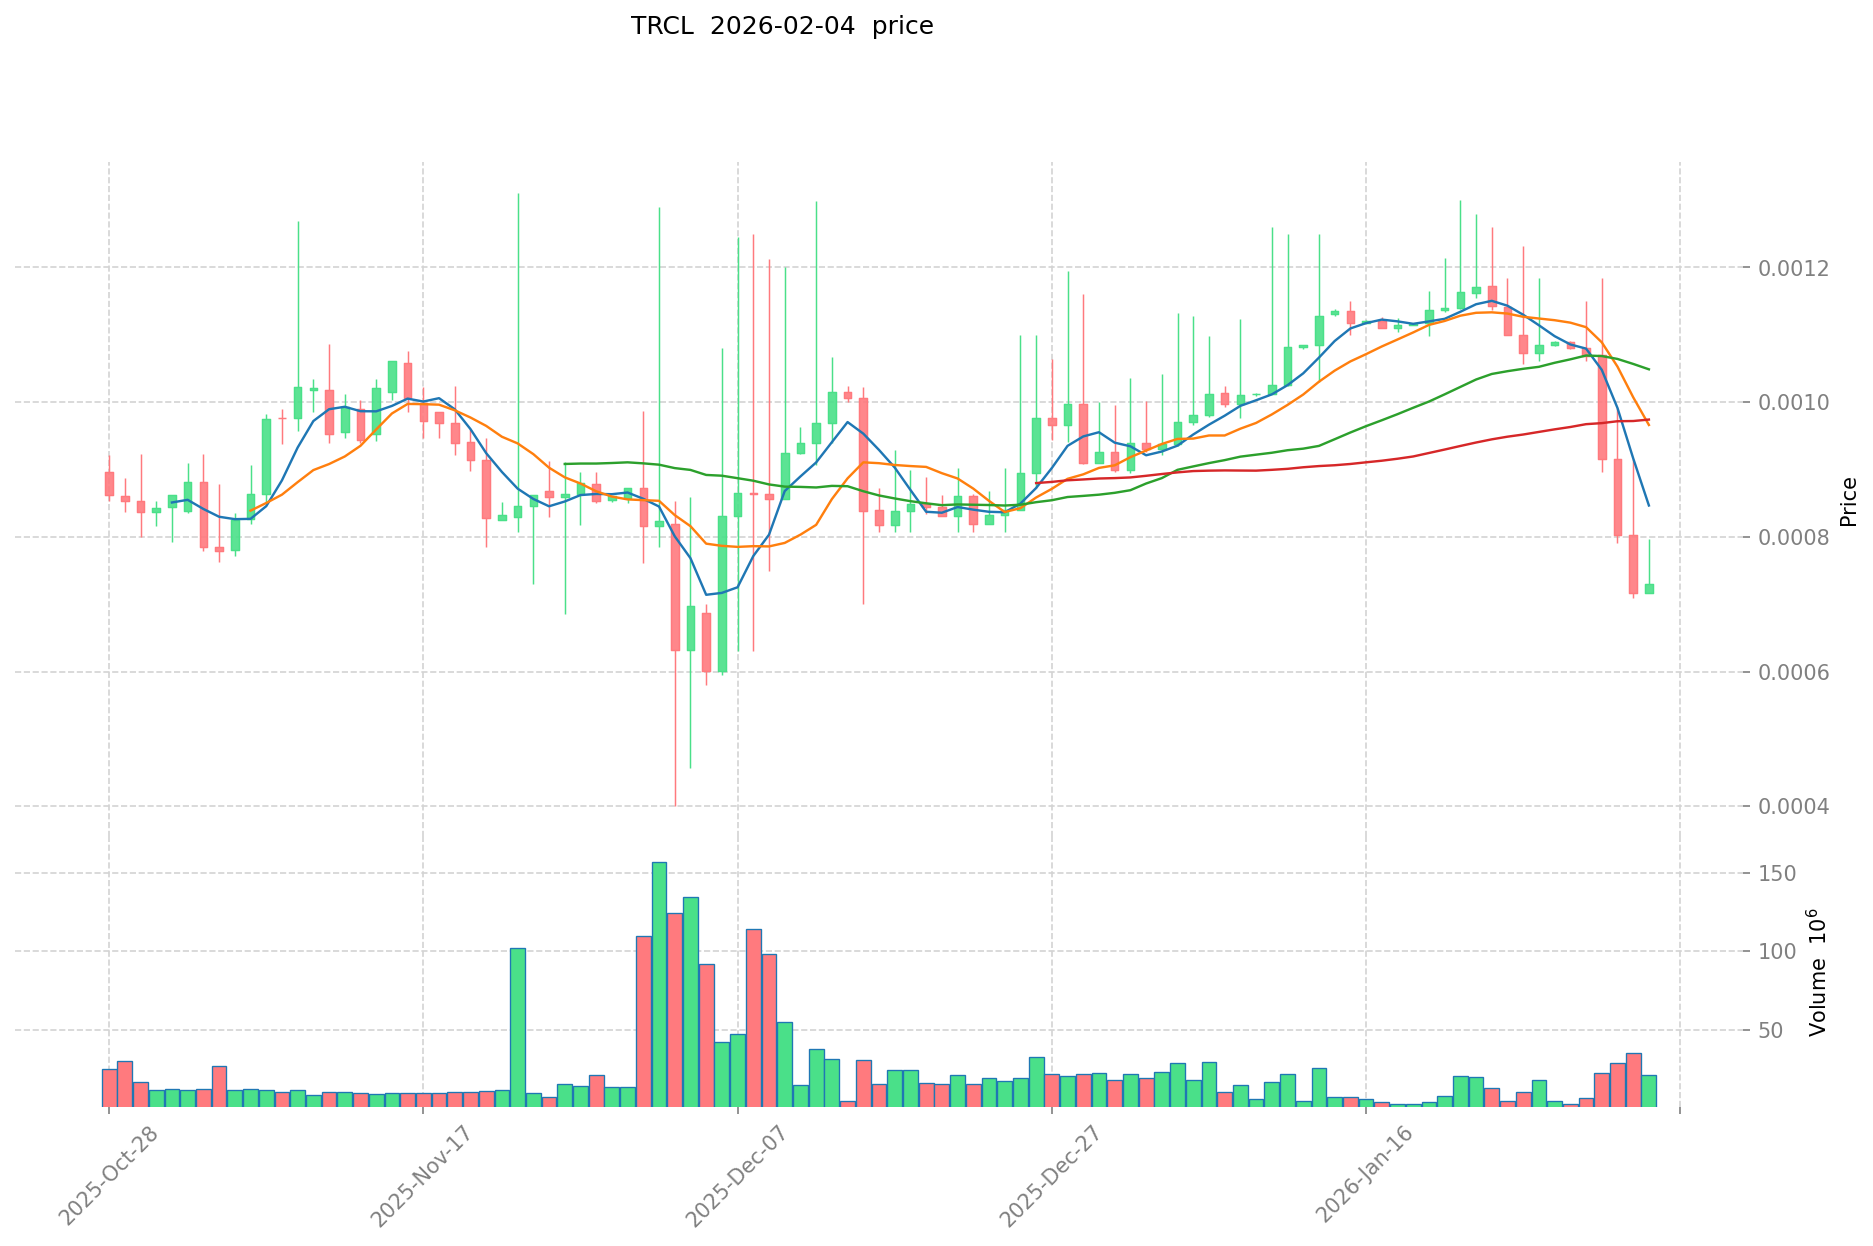
As of February 4, 2026, TRCL is trading at $0.0007405, representing a 0.83% increase over the past 24 hours. The 24-hour trading volume stands at $18,856.12, with prices ranging between $0.00073 (low) and $0.0008159 (high) during this period.
From a broader timeframe perspective, TRCL has shown mixed performance across different periods. The token recorded a modest 2.51% gain over the past year, while experiencing more pronounced declines in shorter timeframes, with a 24.99% decrease over the past 30 days and a 31.81% drop over the past 7 days. The 1-hour price movement indicates a marginal decline of 0.01%.
The token's market capitalization currently sits at approximately $737,943.52, with a circulating supply of 996,547,634 TRCL tokens out of a maximum supply of 1,000,000,000, representing a circulation ratio of 99.65%. The fully diluted valuation remains aligned with the current market cap at $737,943.52. TRCL's market dominance stands at 0.000027%, reflecting its position as a niche project within the broader cryptocurrency ecosystem.
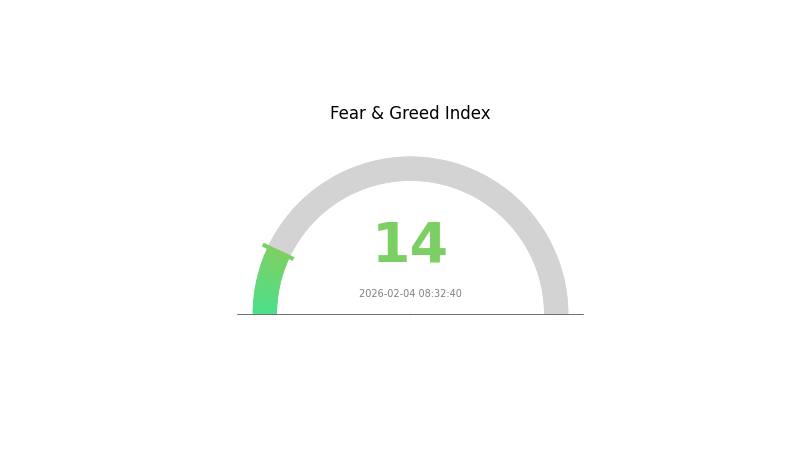
With 181 token holders and trading availability on Gate.com, TRCL operates on the Binance Smart Chain (BSC) network as a BEP-20 token. The current market sentiment index registers at 14, indicating an "Extreme Fear" condition in the cryptocurrency market, which may be influencing trading behavior across various digital assets including TRCL.
Click to view the current TRCL market price
TRCL Market Sentiment Index
02-04-2026 Fear and Greed Index: 14 (Extreme Fear)
Click to view current Fear & Greed Index
The cryptocurrency market is experiencing extreme fear, with the Fear and Greed Index dropping to 14. This exceptionally low reading indicates widespread investor panic and pessimism across the market. Such extreme fear levels typically present contrarian buying opportunities for long-term investors, as excessive pessimism often precedes market recoveries. However, traders should exercise caution and conduct thorough research before making investment decisions. Monitor market developments closely and consider dollar-cost averaging strategies during periods of extreme fear to potentially capitalize on lower asset prices.
TRCL Holdings Distribution
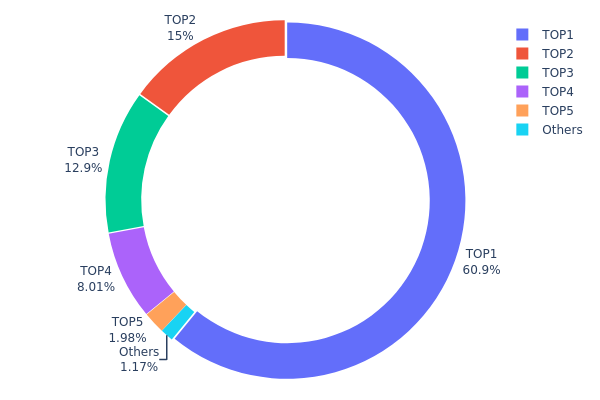
The holdings distribution chart illustrates the concentration of token ownership across different wallet addresses, serving as a critical indicator of decentralization and market structure. According to the current data, TRCL exhibits a highly concentrated distribution pattern. The top five addresses collectively control 97.8% of the total token supply, with the largest holder alone accounting for 60.87% (608.78M tokens). This extreme concentration level significantly deviates from the ideal decentralized distribution model typically observed in mature cryptocurrency projects.
Such concentrated holdings present substantial structural risks to the TRCL market. The dominant position of the top address creates significant sell pressure potential, where any large-scale transaction from major holders could trigger dramatic price volatility. Additionally, the combined holdings of the top three addresses exceed 88%, indicating that market control is effectively consolidated among a small group of entities. This distribution pattern makes TRCL particularly vulnerable to coordinated market manipulation and reduces the token's resilience against single-point decision-making impacts.
From an on-chain structure perspective, the current distribution reveals that TRCL remains in an early development phase with limited token circulation among retail participants. The "Others" category, representing dispersed holders, accounts for merely 1.2% of total supply, suggesting weak organic adoption and insufficient community distribution. This centralized structure may constrain the project's long-term sustainability and raises concerns about governance transparency, as token-weighted voting mechanisms could be dominated by a handful of major stakeholders.
Click to view current TRCL Holdings Distribution
| Top |
Address |
Holding Qty |
Holding (%) |
| 1 |
0xe2bd...f58f63 |
608782.24K |
60.87% |
| 2 |
0x4982...6e89cb |
150310.70K |
15.03% |
| 3 |
0xdcbd...65f5d8 |
129311.11K |
12.93% |
| 4 |
0xae28...a0ab1d |
80088.91K |
8.00% |
| 5 |
0x0d07...b492fe |
19759.02K |
1.97% |
| - |
Others |
11748.01K |
1.2% |
II. Core Factors Influencing TRCL's Future Price
Market Sentiment and Adoption Trends
- Investor Confidence: Market sentiment and investor confidence have a direct impact on TRCL's price movement. Positive news regarding widespread adoption or significant technological breakthroughs tends to drive bullish momentum.
- Market Demand: TRCL's price outlook is influenced by market demand, adoption trends, and institutional participation. These factors collectively shape the token's value trajectory in the broader crypto ecosystem.
- News Sensitivity: The crypto market is highly sensitive to sentiment shifts, making TRCL vulnerable to both positive and negative news cycles that can trigger notable price fluctuations.
Regulatory Environment and Legal Clarity
- Government Policies: The regulatory environment in major cryptocurrency markets plays a crucial role in shaping TRCL's price dynamics. Clear legal frameworks can enhance market confidence, while restrictive policies may create headwinds.
- Compliance Standards: Evolving compliance requirements across different jurisdictions can impact TRCL's accessibility and trading volume, thereby affecting its price performance.
- Policy Uncertainty: Ambiguity in regulatory approaches can lead to increased volatility as market participants react to potential policy changes that may affect TRCL's operational landscape.
Macroeconomic Factors
- Broader Economic Conditions: General economic factors, including global financial market trends, risk appetite, and liquidity conditions, influence TRCL's price behavior alongside other crypto assets.
- Market Cycle Dynamics: TRCL's price movement often correlates with broader cryptocurrency market cycles, where bull and bear phases can amplify or dampen individual token performance.
- Economic Indicators: Macroeconomic indicators such as inflation rates, interest rate expectations, and currency valuations may indirectly affect TRCL by influencing overall crypto market participation.
III. 2026-2031 TRCL Price Prediction
2026 Outlook
- Conservative forecast: $0.00071 - $0.00074
- Neutral forecast: $0.00074
- Optimistic forecast: $0.00085 (requiring favorable market conditions and increased adoption)
2027-2029 Outlook
- Market stage expectation: Early growth phase with moderate volatility as the project establishes market presence
- Price range forecast:
- 2027: $0.00058 - $0.00113
- 2028: $0.00084 - $0.00107
- 2029: $0.00099 - $0.00135
- Key catalysts: Technology development milestones, ecosystem expansion, and broader market recovery trends
2030-2031 Long-term Outlook
- Base scenario: $0.00097 - $0.00118 (assuming steady adoption and stable market conditions)
- Optimistic scenario: $0.00176 (with accelerated ecosystem growth and favorable regulatory environment)
- Transformative scenario: $0.00125 - $0.00165 average range by 2031 (under sustained bullish market cycles and mainstream integration)
- 2026-02-04: TRCL trading within early consolidation phase with projected average of $0.00074
| Year |
Predicted High Price |
Predicted Average Price |
Predicted Low Price |
Price Change |
| 2026 |
0.00085 |
0.00074 |
0.00071 |
0 |
| 2027 |
0.00113 |
0.0008 |
0.00058 |
7 |
| 2028 |
0.00107 |
0.00096 |
0.00084 |
30 |
| 2029 |
0.00135 |
0.00102 |
0.00099 |
37 |
| 2030 |
0.00176 |
0.00118 |
0.00097 |
59 |
| 2031 |
0.00165 |
0.00147 |
0.00125 |
99 |
IV. TRCL Professional Investment Strategies and Risk Management
TRCL Investment Methodology
(1) Long-term Holding Strategy
- Suitable for: Investors who believe in blockchain-based automotive service platforms and can tolerate high volatility
- Operational Recommendations:
- Consider accumulating positions during price dips below $0.0008, given the 24-hour high of $0.0008159
- Set a diversified allocation not exceeding 1-2% of total crypto portfolio due to the token's small market cap of approximately $737,943
- Storage Solution: Use Gate Web3 Wallet for secure storage of TRCL tokens on BSC network, ensuring private key control and backup
(2) Active Trading Strategy
- Technical Analysis Tools:
- Volume Analysis: Monitor the 24-hour trading volume of $18,856 to identify accumulation or distribution patterns
- Support/Resistance Levels: Track the 24-hour range between $0.00073 (low) and $0.0008159 (high) for short-term trading opportunities
- Swing Trading Key Points:
- Pay attention to the 7-day decline of 31.81% and 30-day decline of 24.99%, which may present oversold bounce opportunities
- Set stop-loss orders 5-10% below entry points to manage downside risk
TRCL Risk Management Framework
(1) Asset Allocation Principles
- Conservative Investors: 0.5-1% of total crypto portfolio
- Aggressive Investors: 2-3% of total crypto portfolio
- Professional Investors: 3-5% with active management and hedging strategies
(2) Risk Hedging Solutions
- Portfolio Diversification: Combine TRCL with more established cryptocurrencies to balance risk exposure
- Position Sizing: Implement scaling strategies rather than lump-sum investments given the token's volatility
(3) Secure Storage Solutions
- Hot Wallet Recommendation: Gate Web3 Wallet for active trading and convenient access on BSC network
- Cold Storage Option: Consider hardware wallet solutions for long-term holdings exceeding $1,000
- Security Precautions: Never share private keys, enable two-factor authentication, and verify contract address (0x774a53c2be994299bd07cb4d74fc7c0271916713) before transactions
V. TRCL Potential Risks and Challenges
TRCL Market Risks
- Liquidity Risk: With a relatively low 24-hour trading volume of $18,856 and circulation on limited exchanges, large orders may experience significant slippage
- Volatility Risk: The token has experienced a 31.81% decline over 7 days, indicating high price volatility that may result in substantial losses
- Market Cap Risk: With a market cap of only $737,943 and ranking at 2736, the token faces higher delisting and abandonment risks compared to established projects
TRCL Regulatory Risks
- Automotive Industry Compliance: Blockchain applications in second-hand car markets may face regulatory scrutiny regarding consumer protection and data privacy
- Cross-border Transaction Regulations: The stated goal of replacing tax-inclusive overseas transactions may encounter regulatory challenges in different jurisdictions
- Token Classification Uncertainty: Evolving regulatory frameworks may impact the token's legal status and usage scenarios
TRCL Technical Risks
- Smart Contract Vulnerabilities: As a BEP-20 token on BSC, potential coding flaws or exploits could compromise user funds
- Platform Adoption Risk: The success of TreeCle depends on actual adoption by dealers and consumers in the second-hand car market, which remains uncertain
- Centralization Concerns: With only 181 holders, the token distribution may be concentrated, creating price manipulation risks
VI. Conclusion and Action Recommendations
TRCL Investment Value Assessment
TRCL represents a niche application of blockchain technology in the automotive industry, specifically targeting second-hand car transaction authenticity. While the concept of using blockchain for vehicle history verification has merit, the token faces significant challenges including limited liquidity, small market cap, substantial recent price declines, and uncertain market adoption. The 1-year performance of 2.51% shows minimal appreciation despite crypto market growth during this period. Investors should recognize this as a highly speculative, high-risk investment suitable only for those willing to accept potential total loss.
TRCL Investment Recommendations
✅ Beginners: Avoid investing in TRCL until gaining more experience with established cryptocurrencies; if interested, limit exposure to less than 0.5% of crypto portfolio
✅ Experienced Investors: Consider small speculative positions (1-2% of portfolio) with strict stop-loss orders; monitor platform development updates and user adoption metrics closely
✅ Institutional Investors: Conduct thorough due diligence on TreeCle platform usage, partnership developments, and regulatory compliance before considering any allocation; ensure proper risk assessment frameworks are in place
TRCL Trading Participation Methods
- Spot Trading: Purchase TRCL on Gate.com with limit orders to minimize slippage in the low-liquidity market
- Dollar-Cost Averaging: Implement gradual accumulation strategies to mitigate timing risk and average entry prices
- Research-Driven Approach: Monitor TreeCle platform announcements, GitHub repository updates, and social media channels for development progress before making investment decisions
Cryptocurrency investment carries extremely high risks, and this article does not constitute investment advice. Investors should make prudent decisions based on their own risk tolerance and are advised to consult professional financial advisors. Never invest more than you can afford to lose.
FAQ
What is TRCL? What are its uses and value?
TRCL is the token of OriginTrail protocol, incentivizing data providers and validators while enabling access to ODN ecosystem services. It facilitates interoperability across different blockchain systems through a blockchain-agnostic protocol architecture.
What is TRCL's historical price trend? What are the main factors affecting its price?
TRCL's price has fluctuated based on market sentiment and adoption trends. Key factors include investor confidence, technology developments, market adoption, and overall crypto market conditions. These dynamics continue shaping its price movements in 2026.
How is TRCL price likely to develop in the future? What analysis indicators can be referenced?
TRCL price development depends on market trends, trading volume, and community sentiment. Key indicators include market capitalization growth, trading activity, social engagement levels, and overall crypto market conditions for comprehensive analysis.
What are the risks of investing in TRCL? How should I evaluate if it's worth investing?
TRCL investment carries market volatility, liquidity, and regulatory risks. Evaluate by analyzing tokenomics, development team credibility, community engagement, and transaction volume trends. Monitor technical developments and market sentiment for informed decision-making.
What are the differences and advantages of TRCL compared to similar tokens?
TRCL offers lower transaction fees and enhanced security without third-party intervention. Its blockchain technology ensures superior transaction transparency and reliability compared to similar tokens in the market.
* The information is not intended to be and does not constitute financial advice or any other recommendation of any sort offered or endorsed by Gate.