This comprehensive guide analyzes UDAO's price trajectory from 2026 to 2031, examining a decentralized Web3 education platform addressing global reskilling challenges. Currently trading at $0.087 with a market cap of $276,895, UDAO faces liquidity constraints but holds transformative potential. The analysis combines historical price patterns, supply-demand dynamics, macroeconomic factors, and ecosystem growth to forecast price ranges: $0.09887 high in 2026, potentially reaching $0.2297 by 2031. The article provides professional investment strategies for diverse investor types, risk management frameworks including position sizing and secure storage via Gate Web3 Wallet, and identifies key challenges including regulatory uncertainty and technical risks. Essential for investors evaluating early-stage blockchain education tokens on Gate exchange platform.
Introduction: UDAO's Market Position and Investment Value
UDAO, as a Web3 platform focused on job-relevant skill learning and workforce development, has been addressing the growing global reskilling challenge since its launch in 2024. As of 2026, UDAO maintains a market capitalization of approximately $276,895, with a circulating supply of around 3.19 million tokens, and the price hovering near $0.087. This asset, positioned as a "decentralized education and employment solution," is playing an increasingly relevant role in the intersection of blockchain technology and professional development.
This article will comprehensively analyze UDAO's price trajectory from 2026 to 2031, combining historical patterns, market supply-demand dynamics, ecosystem development, and macroeconomic conditions to provide investors with professional price forecasts and practical investment strategies.
I. UDAO Price Historical Review and Current Market Status
UDAO Historical Price Evolution Trajectory
- June 2024: UDAO launched on Gate.com at a listing price of $0.245, marking its entry into the cryptocurrency market.
- July 2025: The token reached a peak price of $9.00 on July 30, 2025, representing significant early-stage growth momentum.
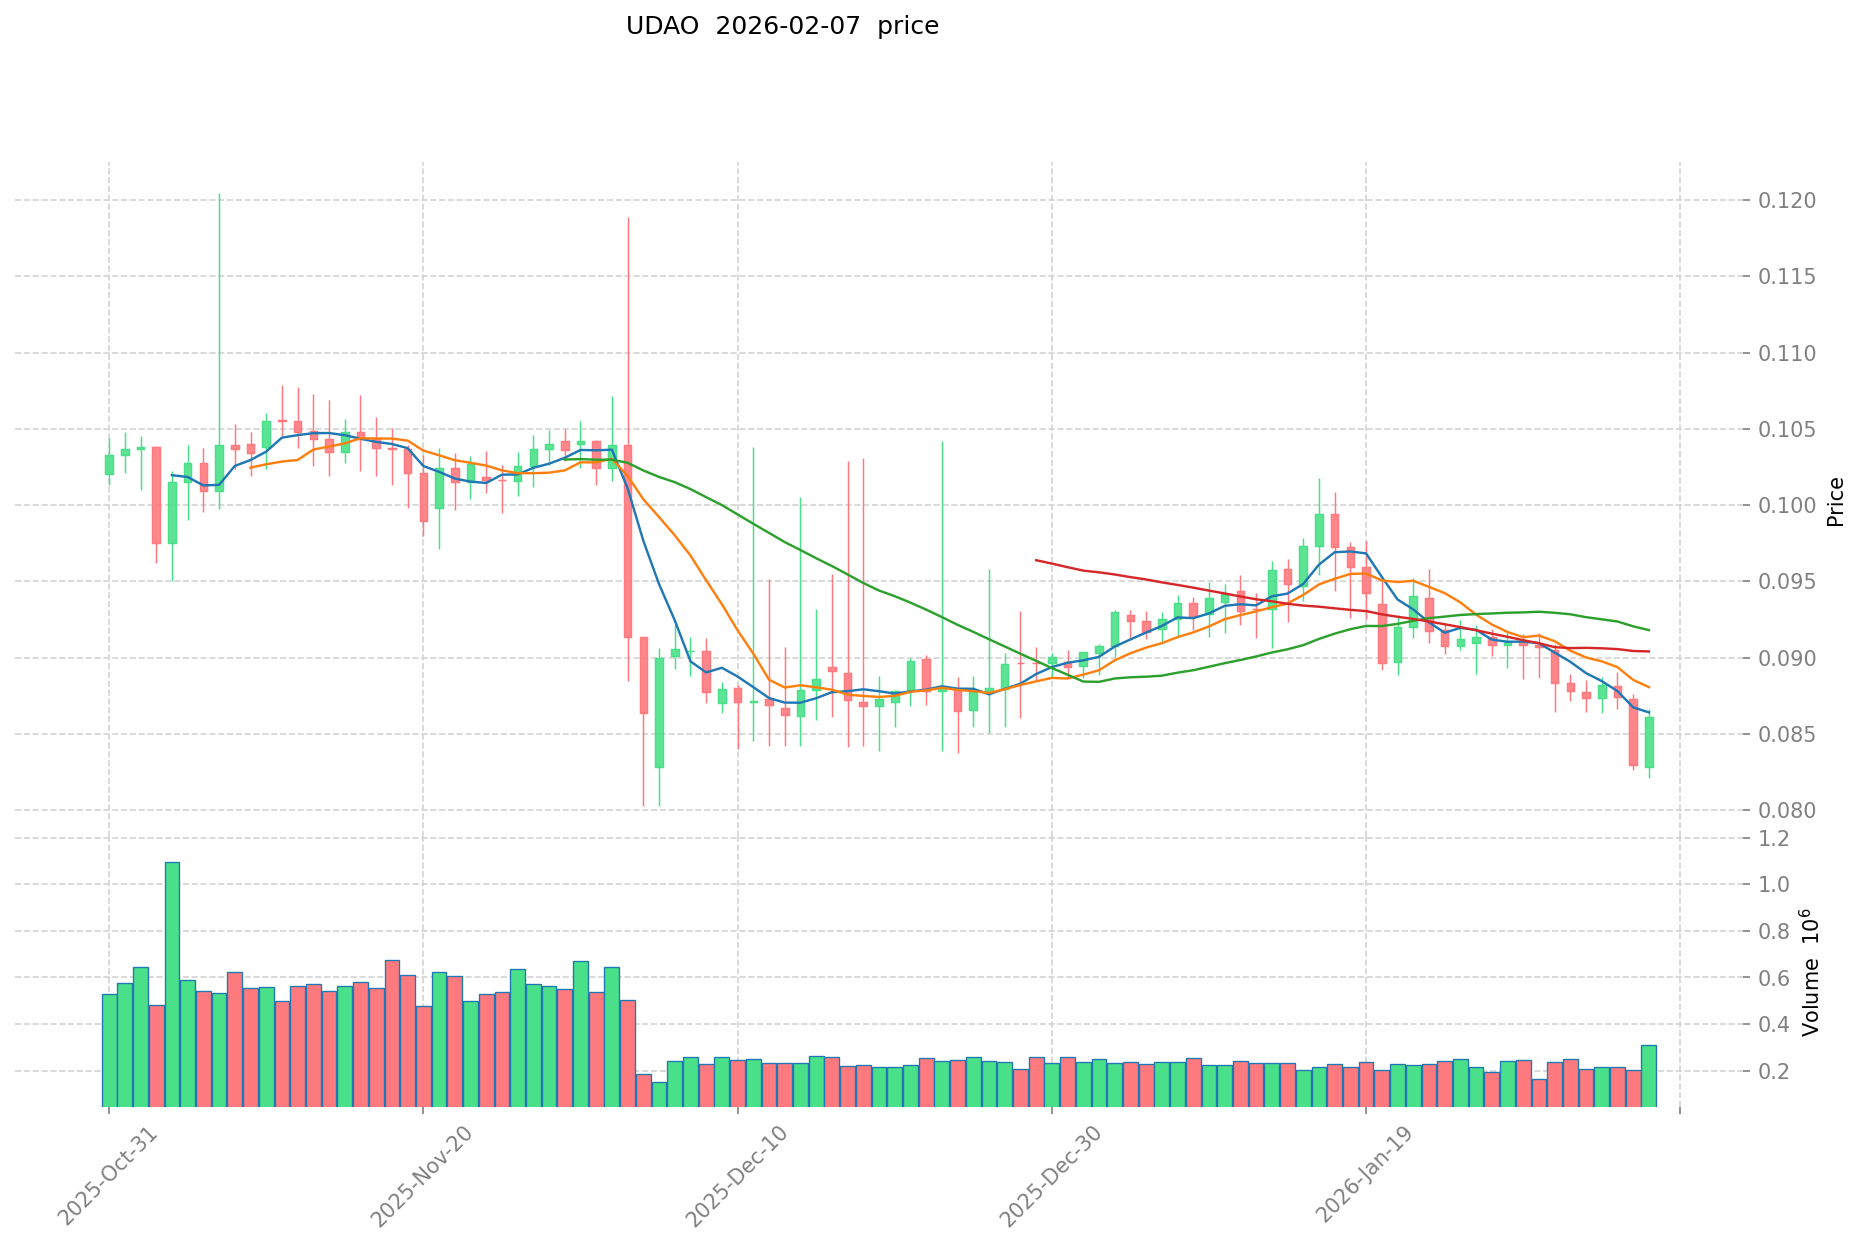
- December 2025: UDAO experienced a substantial correction, declining to a low of $0.08026 on December 5, 2025, reflecting broader market pressures.
UDAO Current Market Status
As of February 7, 2026, UDAO is trading at $0.08674, showing a modest 24-hour gain of 2.47% with a trading volume of approximately $29,428.62. The token's market capitalization stands at around $276,895, with a circulating supply of 3,192,241 tokens representing approximately 1.60% of the maximum supply of 200,000,000 tokens.
The fully diluted market cap is calculated at $17,348,000. UDAO's market dominance is minimal at 0.00070%, indicating a relatively small position within the broader cryptocurrency ecosystem. The 24-hour trading range has fluctuated between $0.08453 and $0.08748.
From a longer-term perspective, UDAO has declined 2.69% over the past seven days, 6.81% over 30 days, and 23.64% over one year. The current price represents a significant distance from the all-time high of $9.00, while remaining slightly above the recorded low of $0.08026. Current market sentiment indicators suggest an "Extreme Fear" reading with a volatility index score of 6, reflecting cautious investor positioning.
The token has approximately 1,816 holders, and is currently traded on one exchange platform.
Click to view the current UDAO market price
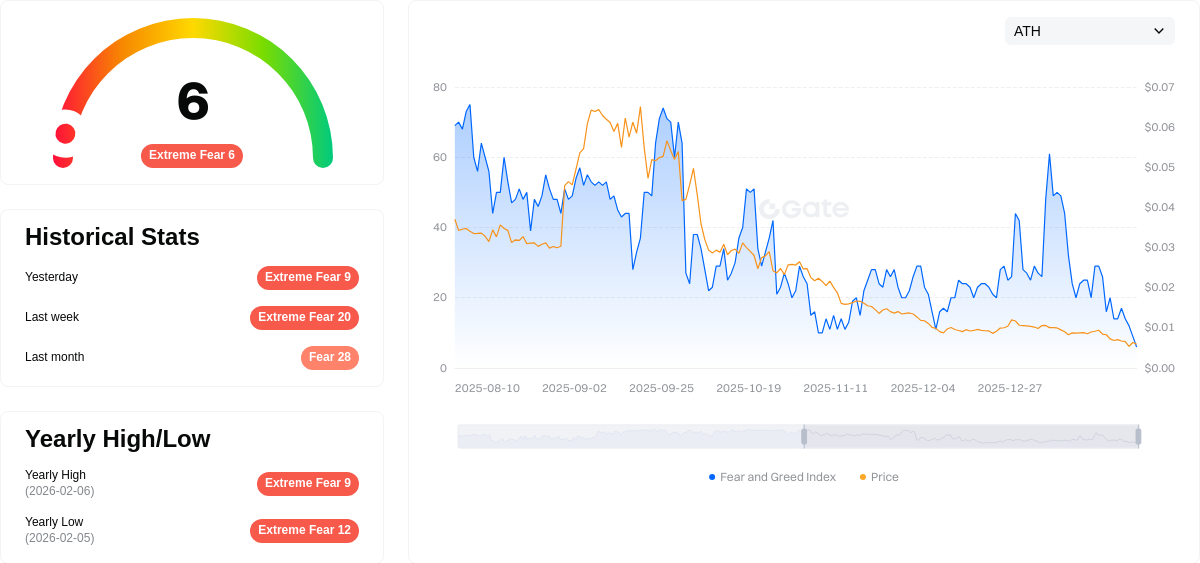
UDAO Market Sentiment Indicator
2026-02-07 Fear and Greed Index: 6 (Extreme Fear)
Click to view the current Fear & Greed Index
The cryptocurrency market is experiencing extreme fear, with the Fear and Greed Index dropping to 6. This exceptionally low reading signals severe market pessimism and risk aversion among investors. During such periods, asset prices often reach capitulation levels, presenting potential opportunities for contrarian traders and long-term investors who view extreme fear as a buying opportunity. However, caution remains essential as market conditions remain highly volatile.
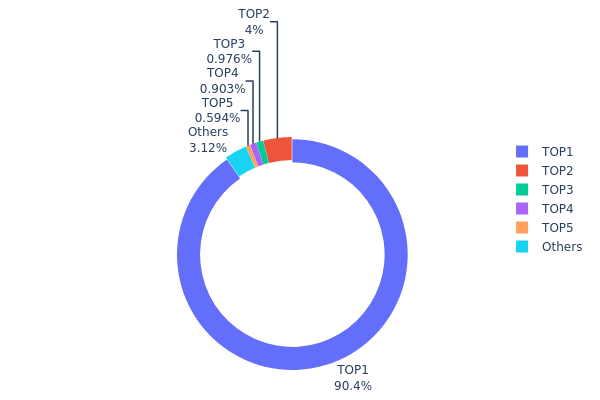
UDAO Holdings Distribution
The holdings distribution chart represents the allocation of UDAO tokens across different wallet addresses, revealing the concentration level of token ownership within the ecosystem. This metric serves as a crucial indicator for assessing the degree of decentralization and potential market manipulation risks associated with the token.
According to the current data, UDAO exhibits an extremely high concentration pattern. The top-ranked address controls 180,805.55K tokens, accounting for 90.40% of the total circulating supply. The second-largest holder possesses merely 8,007.74K tokens (4.00%), while the third through fifth addresses hold 1,952.21K (0.97%), 1,806.45K (0.90%), and 1,188.02K (0.59%) respectively. All remaining addresses collectively control only 6,240.03K tokens, representing 3.14% of the total supply. This distribution reveals a severe imbalance where a single entity dominates over nine-tenths of the circulating supply.
Such extreme concentration poses significant implications for market dynamics and price stability. The dominant holder's disproportionate control creates substantial vulnerability to single-point risk, as any large-scale token movement from this address could trigger dramatic price volatility. This structure potentially enables price manipulation, as the primary holder possesses sufficient market power to influence trading dynamics unilaterally. Furthermore, the limited distribution among smaller holders suggests weak retail participation and constrained liquidity depth, which may result in amplified price swings during trading activities.
Click to view current UDAO Holdings Distribution
| Top |
Address |
Holding Qty |
Holding (%) |
| 1 |
0xb0a9...d59dc0 |
180805.55K |
90.40% |
| 2 |
0xc62e...68ccc0 |
8007.74K |
4.00% |
| 3 |
0x0d07...b492fe |
1952.21K |
0.97% |
| 4 |
0x51e3...bc75e0 |
1806.45K |
0.90% |
| 5 |
0x5bec...56138f |
1188.02K |
0.59% |
| - |
Others |
6240.03K |
3.14% |
II. Core Factors Influencing UDAO's Future Price
Supply and Demand Dynamics
- Market Supply-Demand Balance: The core driver of UDAO's price trajectory lies in the fundamental relationship between supply and demand. Historical patterns demonstrate that supply fluctuations consistently trigger significant price movements across cryptocurrency markets.
- Historical Impact: Past supply adjustments in digital asset markets have repeatedly influenced price discovery mechanisms, with constrained supply often correlating with upward price pressure during periods of sustained demand.
- Current Market Context: Future price volatility will be shaped by prevailing supply structures and evolving demand patterns within the cryptocurrency ecosystem.
Macroeconomic Environment
- Monetary Policy Influence: Global monetary conditions, particularly central bank policies regarding interest rates and quantitative measures, establish the foundational liquidity environment for risk assets including cryptocurrencies. The Federal Reserve's policy stance and inflation management approach significantly affect capital flows into digital asset markets.
- Inflation Dynamics: In environments characterized by elevated inflation expectations, certain cryptocurrencies demonstrate attributes as potential stores of value, though this relationship remains subject to market sentiment and broader risk appetite.
- Geopolitical Considerations: International political developments and policy uncertainties can drive volatility in cryptocurrency markets. Geopolitical tensions may temporarily elevate demand for decentralized assets, though sustained effects depend on the nature and duration of such events.
Market Liquidity and Risk Sentiment
- Liquidity Conditions: The availability of liquidity within global financial markets directly impacts cryptocurrency valuations. Periods of abundant liquidity typically support higher risk asset prices, while tightening conditions may constrain upward momentum.
- Dollar Index Correlation: Cryptocurrencies often exhibit inverse relationships with the U.S. dollar, as dollar weakness can enhance the relative attractiveness of alternative assets. However, this correlation is not absolute and varies across different market cycles.
- Risk Appetite Fluctuations: Broader market risk sentiment influences capital allocation to cryptocurrencies. During risk-on phases, speculative interest may drive price appreciation, while risk-off periods can trigger capital flight from volatile assets.
Technological Development and Ecosystem Expansion
- Infrastructure Advancement: Ongoing technological improvements within blockchain networks can enhance transaction efficiency, security, and scalability, potentially supporting long-term value accrual.
- Ecosystem Growth: The expansion of decentralized applications and use cases within cryptocurrency ecosystems contributes to fundamental demand drivers, though adoption timelines remain uncertain.
- Innovation Cycles: Technological breakthroughs and protocol upgrades may create periodic catalysts for price movements, though the materialization of such effects depends on successful implementation and market acceptance.
III. 2026-2031 UDAO Price Prediction
2026 Outlook
- Conservative Forecast: $0.04423 - $0.08673
- Neutral Forecast: Around $0.08673
- Optimistic Forecast: Up to $0.09887 (requires favorable market conditions and increased adoption)
2027-2029 Outlook
- Market Phase Expectation: The token is projected to enter a gradual growth phase with moderate volatility, potentially driven by expanding ecosystem development and broader market recovery.
- Price Range Forecast:
- 2027: $0.08259 - $0.11786 (approximately 6% growth from 2026)
- 2028: $0.05477 - $0.14219 (approximately 21% cumulative growth)
- 2029: $0.07921 - $0.16832 (approximately 42% cumulative growth)
- Key Catalysts: Platform enhancements, strategic partnerships, and increased user engagement within the education technology sector could serve as primary drivers for price appreciation.
2030-2031 Long-term Outlook
- Baseline Scenario: $0.11245 - $0.16648 in 2030 (assuming steady ecosystem growth and sustained market interest, representing approximately 68% cumulative growth)
- Optimistic Scenario: $0.09063 - $0.2297 in 2031 (conditional on significant platform adoption and favorable regulatory developments, with potential cumulative growth reaching 80%)
- Transformative Scenario: Beyond $0.2297 in 2031 (requires exceptional market conditions, major institutional partnerships, and breakthrough adoption in decentralized education platforms)
- February 7, 2026: UDAO trading within the $0.04423 - $0.09887 range (establishing baseline for medium-term projections)
| Year |
Predicted High Price |
Predicted Average Price |
Predicted Low Price |
Price Change |
| 2026 |
0.09887 |
0.08673 |
0.04423 |
0 |
| 2027 |
0.11786 |
0.0928 |
0.08259 |
6 |
| 2028 |
0.14219 |
0.10533 |
0.05477 |
21 |
| 2029 |
0.16832 |
0.12376 |
0.07921 |
42 |
| 2030 |
0.16648 |
0.14604 |
0.11245 |
68 |
| 2031 |
0.2297 |
0.15626 |
0.09063 |
80 |
IV. UDAO Professional Investment Strategy and Risk Management
UDAO Investment Methodology
(1) Long-Term Holding Strategy
- Target Investors: Investors who believe in the long-term development potential of Web3 education platforms and are willing to tolerate market volatility
- Operational Recommendations:
- Consider gradual position building when the price experiences significant retracement to reduce the risk of single entry point
- Set reasonable stop-loss levels to protect capital against unexpected market events
- Recommended Storage Solution: Gate Web3 Wallet provides secure multi-chain asset management with user-friendly interface suitable for long-term storage
(2) Active Trading Strategy
- Technical Analysis Tools:
- Moving Averages: Monitor 7-day and 30-day moving averages to identify potential trend reversals and support/resistance levels
- Volume Analysis: Pay attention to trading volume changes (current 24h volume approximately $29,428) to confirm price movement validity
- Swing Trading Key Points:
- Consider taking profits during short-term rallies as UDAO showed 2.47% gain in 24 hours but faces 2.69% decline over 7 days
- Monitor market sentiment and news related to Web3 education sector developments
UDAO Risk Management Framework
(1) Asset Allocation Principles
- Conservative Investors: 1-3% of crypto portfolio allocation
- Aggressive Investors: 5-8% of crypto portfolio allocation
- Professional Investors: Up to 10% with active monitoring and hedging strategies
(2) Risk Hedging Solutions
- Diversification: Combine UDAO holdings with other established cryptocurrencies to reduce concentration risk
- Position Sizing: Avoid allocating excessive capital to a single token with limited market liquidity
(3) Secure Storage Solutions
- Software Wallet Recommendation: Gate Web3 Wallet offers comprehensive security features for Polygon-based tokens
- Multi-Signature Option: For larger holdings, consider multi-signature wallet solutions to enhance security
- Security Precautions: Always verify contract addresses (0x433cCeBC95ad458E74d81837Db0D4aa27e30E117 for UDAO on Polygon), never share private keys, and be cautious of phishing attempts
V. UDAO Potential Risks and Challenges
UDAO Market Risks
- Low Liquidity: With 24-hour trading volume around $29,428 and market cap of approximately $276,895, UDAO faces significant liquidity constraints that may result in high price volatility
- Limited Exchange Availability: Currently available on only one exchange, which concentrates trading risk and limits price discovery mechanisms
- Price Volatility: The token has experienced substantial decline from its peak, with 1-year performance showing -23.64% change, indicating considerable downside risk
UDAO Regulatory Risks
- Education Token Classification: Regulatory uncertainty surrounding tokens used in education platforms may affect future compliance requirements
- Cross-Border Operations: As a global Web3 education platform, UDAO may face varying regulatory frameworks across different jurisdictions
- Token Utility Regulations: Potential changes in how utility tokens are classified and regulated could impact platform operations
UDAO Technical Risks
- Smart Contract Vulnerabilities: Like all blockchain-based platforms, UDAO's smart contracts on Polygon may contain undiscovered vulnerabilities
- Platform Development Risk: As a relatively new project (launched in June 2024), there are execution risks related to roadmap delivery and platform adoption
- Blockchain Dependency: Operating on Polygon blockchain means UDAO is subject to any technical issues or network disruptions affecting the underlying infrastructure
VI. Conclusion and Action Recommendations
UDAO Investment Value Assessment
UDAO presents an innovative approach to addressing the global reskilling challenge through Web3 technology, targeting a market need that is expected to affect over one billion people by 2030. However, the token currently faces significant challenges including extremely low market capitalization (approximately $276,895), limited liquidity with only 1.6% of maximum supply in circulation, and substantial price decline since its all-time high. The long-term value proposition depends on successful platform adoption, user growth, and the team's ability to execute its vision in a competitive education technology landscape. Short-term risks include continued price volatility, limited trading venues, and the need to prove product-market fit in an emerging sector.
UDAO Investment Recommendations
✅ Beginners: Start with minimal allocation (less than 1% of crypto portfolio) and focus on understanding the project fundamentals before increasing exposure; consider waiting for clearer signs of platform adoption
✅ Experienced Investors: Approach with caution given low liquidity; if interested, implement strict position limits and stop-loss orders; monitor project development milestones closely
✅ Institutional Investors: Conduct thorough due diligence on team, technology, and market opportunity; consider direct engagement with project team for transparency; be aware of liquidity constraints for position sizing
UDAO Trading Participation Methods
- Spot Trading: Available on Gate.com with UDAO/USDT trading pair; suitable for basic buying and holding strategies
- Secure Storage: Transfer tokens to Gate Web3 Wallet for enhanced security after purchase, especially for long-term holdings
- Research First Approach: Monitor project updates through official channels (Twitter: @udao_official, website: udao.org) before making investment decisions
Cryptocurrency investment carries extremely high risks, and this article does not constitute investment advice. Investors should make cautious decisions based on their own risk tolerance and are advised to consult professional financial advisors. Never invest more than you can afford to lose.
FAQ
What is UDAO? What are its uses and value?
UDAO is a decentralized autonomous organization operating on blockchain, utilizing smart contracts for governance and token distribution. It supports community-driven decisions and incentivizes ecosystem contributors through reward mechanisms, creating value through decentralized participation and collaboration.
What is the historical price trend of UDAO tokens?
UDAO has demonstrated moderate volatility in its price trajectory. From launch through 2025, the token experienced several growth phases with peaks around $0.10, while establishing support levels near $0.06. Current trading reflects ongoing market cycles typical of emerging utility tokens in the Web3 ecosystem.
What price will UDAO reach in 2024?
UDAO demonstrated strong growth potential through 2024. Based on market momentum and adoption trends, price targets ranged from $0.50 to $2.00 USD, with bullish scenarios potentially exceeding $3.00 USD depending on ecosystem development and market conditions.
What are the main factors affecting UDAO price?
UDAO price is primarily influenced by supply and demand dynamics, market adoption of the platform, competitive landscape, overall crypto market trends, regulatory developments, and trading volume in the market.
What advantages does UDAO have compared to other DAO tokens?
UDAO offers superior governance through decentralized voting, lower operational costs, and advanced blockchain technology. It features transparent smart contract execution, flexible membership models, and efficient decision-making processes that outperform traditional DAO tokens.
What are the main risks of investing in UDAO?
UDAO investment risks include regulatory uncertainty in crypto markets, high market volatility, and early-stage development stage risks. Crypto markets are inherently volatile and unpredictable. Investors should conduct thorough research before investing.
What are the circulating supply and total supply of UDAO?
UDAO has a circulating supply of 11.19 million tokens. The total supply information has not been publicly disclosed. The current market cap is approximately $969,484.
Where can I purchase UDAO?
UDAO can be purchased through decentralized exchanges and Web3 wallets. You can access UDAO trading on various DEX platforms that support the token. Check official channels for current available trading venues and liquidity options.
* The information is not intended to be and does not constitute financial advice or any other recommendation of any sort offered or endorsed by Gate.