GORK vs LINK: Comparing Two Emerging Tokens in the Cryptocurrency Market

Introduction: GORK vs LINK Investment Comparison
In the cryptocurrency market, the comparison between GORK and LINK continues to be a topic that investors cannot avoid. Both show distinct differences in market cap ranking, application scenarios, and price performance, representing different crypto asset positioning. GORK (GORK): Launched in 2025, this Solana-based meme coin has gained attention through humorous social media interactions and community engagement, inspired by xAI's Grok AI chatbot. LINK (LINK): Since its launch in 2017, LINK has established itself as an ERC20 standardized token on the Ethereum blockchain, serving as the payment mechanism for Chainlink node operators to retrieve off-chain data, format data for blockchain readability, perform off-chain computations, and ensure network uptime. This article will comprehensively analyze the investment value comparison between GORK and LINK through historical price trends, supply mechanisms, institutional adoption, technical ecosystems, and future predictions, attempting to answer the question investors care most about:
"Which is the better buy right now?"
I. Historical Price Comparison and Current Market Situation
GORK (Coin A) and LINK (Coin B) Historical Price Trends
-
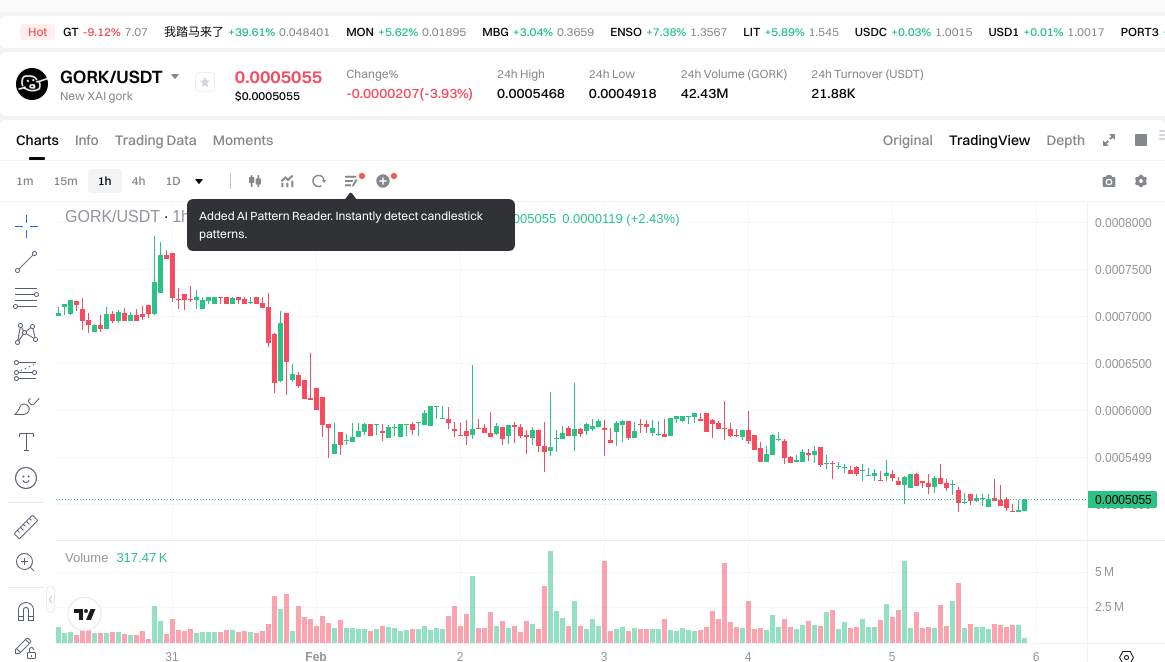
2025: GORK experienced significant price volatility following its launch in late January 2025, reaching a peak of $0.0955 in early May 2025, representing notable initial interest in this Solana-based meme coin inspired by xAI's Grok chatbot.
-
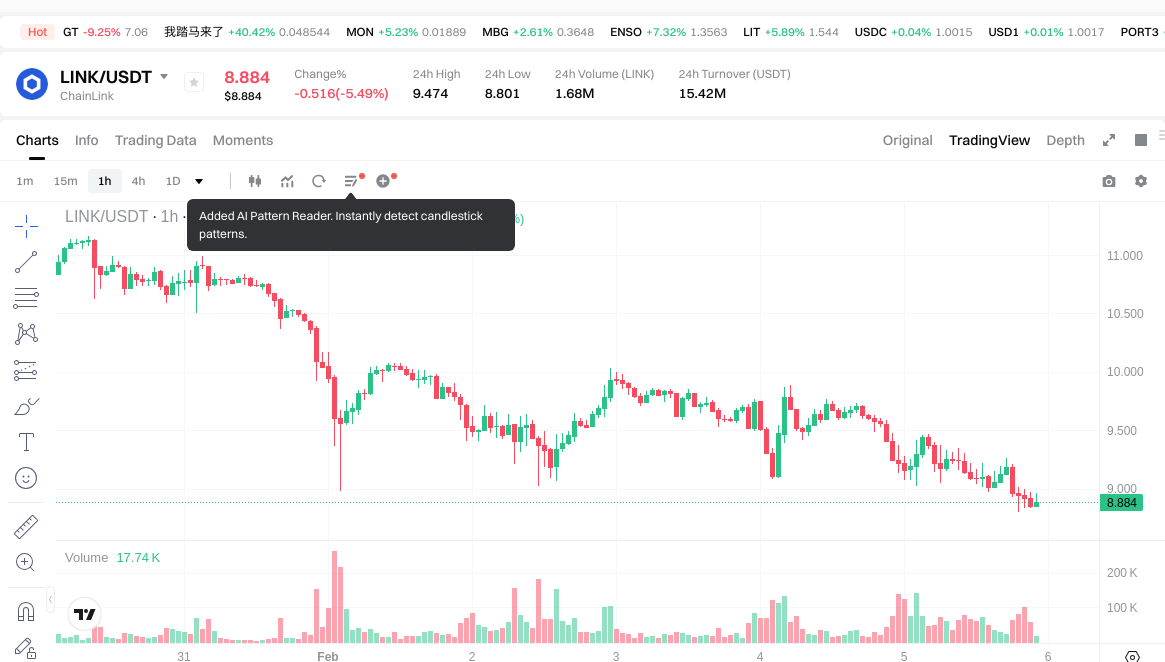
2021: LINK reached its all-time high of $52.70 in May 2021, driven by increased adoption of Chainlink's decentralized oracle network and growing demand for DeFi infrastructure services.
-
Comparative Analysis: During recent market cycles, GORK declined from its high of $0.0955 to a low of $0.0004918, representing a substantial correction. In contrast, LINK has experienced a more gradual decline from its 2021 peak, demonstrating relatively more stable price behavior typical of established infrastructure tokens.
Current Market Status (2026-02-05)
- GORK Current Price: $0.0004935
- LINK Current Price: $8.854
- 24-Hour Trading Volume: GORK $21,839.68 vs LINK $15,356,143.33
- Market Sentiment Index (Fear & Greed Index): 12 (Extreme Fear)
View real-time prices:
- Check GORK current price Market Price
- Check LINK current price Market Price
II. Core Factors Influencing GORK vs LINK Investment Value
Supply Mechanism Comparison (Tokenomics)
-
GORK: Based on available materials, specific supply mechanism details are not provided. The investment value framework emphasizes management skills, competitive advantages, and long-term profitability as fundamental factors.
-
LINK: According to reference materials, investment value stems from fundamental factors including current earnings, future profitability potential, management capabilities, and competitive positioning. These elements collectively form the asset's earning capacity.
-
📌 Historical Pattern: Supply mechanisms influence price cycles through scarcity dynamics and distribution models. The relationship between token economics and value accrual to holders remains a critical consideration for long-term investment strategies.
Institutional Adoption and Market Application
-
Institutional Holdings: Reference materials indicate that AI Agent investments focus on capabilities including self-learning, decision-making, and task execution. The trend toward cost-effective AI solutions suggests evolving institutional preferences.
-
Enterprise Adoption: Materials reference financial services applications where institutions leverage large datasets for operational efficiency. For example, Bloomberg developed BloombergGPT in 2023 for financial data analysis, while JPMorgan utilizes internal datasets for market insights and risk analysis.
-
National Policies: The materials mention regulatory investigations in certain jurisdictions, though specific comparative regulatory stances between different assets were not detailed in the provided context.
Technology Development and Ecosystem Building
-
GORK Technology: The materials reference xAI's technological ecosystem, including the Colossus training cluster and integration with broader AI infrastructure. However, specific technical upgrade details for GORK were not provided.
-
LINK Technology: Reference materials emphasize the importance of understanding protocol design and value flow mechanisms. The framework suggests that genuine long-term holding requires comprehension of how value originates and returns to holders.
-
Ecosystem Comparison: Materials indicate AI Agent applications span multiple sectors including financial services, cybersecurity, defense, and life sciences. The 2025 period marks increasing commercialization of AI Agent technologies across enterprise and consumer applications.
Macroeconomic Environment and Market Cycles
-
Performance in Inflationary Environment: Materials reference discussions of universal high income alongside potential social disruption, with future value tied to energy capture and utilization efficiency rather than traditional monetary metrics.
-
Macroeconomic Monetary Policy: Reference materials note that AI development may outpace government responses by a factor of ten or more. The relationship between policy rates, dollar indices, and digital assets requires consideration within broader technological transformation contexts.
-
Geopolitical Factors: Materials indicate China's solar energy capacity and AI computational trajectory, suggesting significant geopolitical dimensions to technological infrastructure development. Cross-border transaction demands and international dynamics form part of the broader investment consideration framework.
III. 2026-2031 Price Predictions: GORK vs LINK
Short-term Forecast (2026)
- GORK: Conservative $0.00032352 - $0.0005055 | Optimistic $0.0005055 - $0.000672315
- LINK: Conservative $7.743 - $8.9 | Optimistic $8.9 - $9.167
Mid-term Forecast (2028-2029)
- GORK may enter a consolidation phase with estimated prices ranging from $0.000385991 to $0.000759729
- LINK may enter a growth phase with estimated prices ranging from $7.99031 to $14.71232
- Key drivers: institutional capital inflows, ETF developments, ecosystem expansion
Long-term Forecast (2030-2031)
- GORK: Base scenario $0.00045976 - $0.000741103 | Optimistic scenario $0.000741103 - $0.001015312
- LINK: Base scenario $12.54707 - $15.68384 | Optimistic scenario $15.68384 - $21.6437
Disclaimer
GORK:
| Year | Predicted High Price | Predicted Average Price | Predicted Low Price | Price Change |
|---|---|---|---|---|
| 2026 | 0.000672315 | 0.0005055 | 0.00032352 | 2 |
| 2027 | 0.000618352875 | 0.0005889075 | 0.000406346175 | 19 |
| 2028 | 0.000621739093125 | 0.0006036301875 | 0.000488940451875 | 22 |
| 2029 | 0.000759728953987 | 0.000612684640312 | 0.000385991323396 | 24 |
| 2030 | 0.000795999884694 | 0.00068620679715 | 0.00045975855409 | 39 |
| 2031 | 0.001015311577063 | 0.000741103340922 | 0.000681815073648 | 50 |
LINK:
| Year | Predicted High Price | Predicted Average Price | Predicted Low Price | Price Change |
|---|---|---|---|---|
| 2026 | 9.167 | 8.9 | 7.743 | 0 |
| 2027 | 12.6469 | 9.0335 | 7.2268 | 2 |
| 2028 | 14.525868 | 10.8402 | 9.647778 | 22 |
| 2029 | 14.71231944 | 12.683034 | 7.99031142 | 43 |
| 2030 | 17.6700029688 | 13.69767672 | 12.6018625824 | 54 |
| 2031 | 21.643698985272 | 15.6838398444 | 12.54707187552 | 77 |
IV. Investment Strategy Comparison: GORK vs LINK
Long-term vs Short-term Investment Strategies
-
GORK: May suit investors with higher risk tolerance seeking exposure to emerging meme token dynamics and community-driven assets within the Solana ecosystem. The asset exhibits volatility characteristics typical of newer market entrants.
-
LINK: May appeal to investors focused on established blockchain infrastructure and decentralized oracle network adoption. The token's positioning within DeFi ecosystems and enterprise data integration scenarios suggests alignment with longer-term infrastructure investment theses.
Risk Management and Asset Allocation
-
Conservative Investors: Potential allocation framework might consider GORK 5-10% vs LINK 15-25% within a diversified cryptocurrency portfolio, reflecting relative market maturity and volatility profiles.
-
Aggressive Investors: Higher risk tolerance portfolios might explore GORK 15-25% vs LINK 20-35% allocations, though individual circumstances and risk capacity should guide specific positioning.
-
Hedging Instruments: Portfolio risk management approaches may incorporate stablecoin reserves for liquidity management, options strategies where available, and cross-asset diversification across different blockchain ecosystems and use cases.
V. Potential Risk Comparison
Market Risks
-
GORK: Faces substantial volatility risks characteristic of meme tokens, with price movements potentially influenced by social media sentiment, community engagement patterns, and broader retail investor behavior. Trading volume differentials suggest lower liquidity compared to established assets.
-
LINK: Subject to market cycle fluctuations affecting infrastructure tokens, with price performance potentially correlated to DeFi adoption trends, oracle service demand, and broader smart contract platform utilization rates.
Technical Risks
-
GORK: Network dependencies on Solana blockchain infrastructure include considerations around network congestion management and ecosystem development continuity.
-
LINK: Technical considerations encompass oracle network decentralization parameters, node operator incentive structures, and integration complexities across multiple blockchain platforms.
Regulatory Risks
- Evolving regulatory frameworks across jurisdictions may impact both assets differently based on their respective classifications and use cases. Infrastructure tokens and meme assets may face distinct regulatory considerations as policy frameworks continue developing.
VI. Conclusion: Which Is the Better Buy?
📌 Investment Value Summary:
-
GORK Characteristics: Represents emerging meme token segment with community-driven dynamics, positioned within Solana ecosystem, exhibiting higher volatility profile typical of newer market entrants.
-
LINK Characteristics: Established infrastructure token with defined utility in decentralized oracle networks, demonstrated institutional interest in data integration use cases, and positioning within DeFi ecosystem architecture.
✅ Investment Considerations:
-
Beginning Investors: May benefit from prioritizing established assets with clearer utility frameworks and more extensive historical performance data. Understanding fundamental value propositions and risk-return profiles should precede allocation decisions.
-
Experienced Investors: Portfolio construction might incorporate both infrastructure and emerging segments based on individual risk tolerance, time horizons, and conviction in specific technology adoption trajectories. Diversification across different blockchain ecosystems and use cases may help manage concentration risks.
-
Institutional Investors: Due diligence frameworks should encompass technical infrastructure assessment, regulatory compliance considerations, liquidity analysis, and alignment with broader portfolio mandates. Established infrastructure tokens may align more readily with institutional risk parameters.
⚠️ Risk Disclosure: Cryptocurrency markets demonstrate substantial volatility characteristics. This content does not constitute investment advice. Market participants should conduct independent research and consider individual circumstances before making allocation decisions.
VII. FAQ
Q1: What is the fundamental difference between GORK and LINK as investment assets?
GORK is a Solana-based meme token launched in 2025 focused on community engagement and social media-driven value, while LINK is an established Ethereum-based infrastructure token serving as the payment mechanism for Chainlink's decentralized oracle network since 2017. The fundamental distinction lies in their utility models: GORK operates primarily as a community-driven speculative asset with price dynamics influenced by sentiment and engagement patterns, whereas LINK functions as essential infrastructure for blockchain data integration, with value derived from oracle service adoption across DeFi ecosystems and enterprise applications. This represents the difference between emerging meme token dynamics versus established protocol infrastructure positioning.
Q2: How do the volatility profiles of GORK and LINK differ for risk management purposes?
GORK exhibits substantially higher volatility with a documented price decline from $0.0955 to $0.0004918 since its 2025 launch, while LINK demonstrates relatively more stable price behavior despite declining from its 2021 peak of $52.70. The 24-hour trading volume differential ($21,839.68 for GORK versus $15,356,143.33 for LINK as of February 5, 2026) indicates significantly lower liquidity for GORK, which amplifies volatility risks. For conservative portfolio management, suggested allocations reflect this risk differential with 5-10% GORK versus 15-25% LINK for conservative investors, and 15-25% GORK versus 20-35% LINK for aggressive portfolios. The volatility characteristics stem from GORK's meme token nature with sentiment-driven price movements versus LINK's correlation to measurable infrastructure adoption metrics.
Q3: What are the key technology ecosystem differences that impact investment value?
LINK's technology ecosystem centers on decentralized oracle network infrastructure, providing off-chain data retrieval, blockchain data formatting, and off-chain computation services for smart contracts across multiple blockchain platforms. This positions LINK within critical DeFi infrastructure with enterprise adoption cases, exemplified by financial institutions utilizing oracle services for data integration. GORK's ecosystem positioning relates to the Solana blockchain infrastructure and community-driven development without the defined utility framework of oracle services. The technology distinction impacts investment thesis fundamentally: LINK's value proposition ties to measurable oracle service adoption and data integration demand across blockchain ecosystems, while GORK's value dynamics relate to community engagement patterns and social media-driven sentiment within the meme token segment.
Q4: How should beginning investors approach allocation decisions between GORK and LINK?
Beginning investors should prioritize established assets with clearer utility frameworks and more extensive historical performance data, which suggests initial focus on LINK rather than GORK. The decision framework should encompass understanding fundamental value propositions: LINK's oracle network utility provides measurable adoption metrics and defined use cases, whereas GORK's meme token dynamics require assessment of community engagement and sentiment patterns. For portfolio construction, beginners might consider starting with infrastructure tokens like LINK that demonstrate established market positioning and institutional interest before exploring higher-volatility meme tokens. Risk management principles suggest limiting exposure to emerging assets like GORK until sufficient understanding of cryptocurrency market cycles and volatility dynamics develops through experience with more established assets.
Q5: What institutional adoption factors differentiate GORK and LINK investment cases?
LINK demonstrates established institutional adoption patterns through enterprise data integration applications, with reference cases including financial institutions leveraging oracle services for market data and risk analysis infrastructure. The token's positioning within DeFi ecosystem architecture and cross-platform blockchain integration indicates institutional utility recognition. GORK lacks comparable institutional adoption frameworks, operating primarily within retail community-driven dynamics typical of meme tokens. For institutional investors, due diligence frameworks encompassing technical infrastructure assessment, regulatory compliance considerations, and liquidity analysis favor established infrastructure tokens with defined utility cases. The institutional adoption differential reflects fundamental distinctions: LINK addresses measurable enterprise needs for blockchain data integration, while GORK represents speculative community-driven asset dynamics without equivalent institutional use case validation.
Q6: How do 2026-2031 price predictions compare between GORK and LINK?
LINK's predicted price trajectory shows substantial growth potential from a 2026 conservative range of $7.743-$8.9 to a 2031 optimistic scenario reaching $21.64, representing potential appreciation of approximately 144% at the upper range. GORK's predictions indicate movement from a 2026 conservative range of $0.00032352-$0.0005055 to a 2031 optimistic scenario of $0.001015, representing potential appreciation of approximately 105% at the upper range from current levels. The absolute price differential reflects market capitalization positioning and established adoption: LINK's higher base price and trading volume support larger absolute value movements, while GORK's lower price point creates percentage-based volatility dynamics. Both predictions incorporate assumptions about ecosystem expansion, institutional capital inflows, and broader market cycle dynamics, though LINK's forecast ties more directly to measurable oracle service adoption metrics versus GORK's community-driven speculation dynamics.
Q7: What are the primary regulatory risk differences between GORK and LINK?
LINK faces regulatory considerations typical of utility tokens providing infrastructure services across blockchain platforms, with potential regulatory frameworks focusing on oracle service provision, node operator structures, and cross-platform integration compliance. The established nature and defined utility may align more readily with emerging regulatory frameworks for functional cryptocurrency assets. GORK's regulatory risk profile reflects meme token characteristics, with potential classification considerations around speculative assets and community-driven tokens that lack defined utility beyond social engagement. Evolving regulatory frameworks across jurisdictions may impact these assets differently: infrastructure tokens with measurable utility may receive clearer regulatory treatment, while meme tokens face uncertainty regarding classification and compliance requirements. Both assets remain subject to broader cryptocurrency market regulatory developments, though the distinct use case positioning creates differential regulatory risk considerations for portfolio management and compliance planning.
Q8: What portfolio diversification benefits might combining GORK and LINK provide?
Combining GORK and LINK within a cryptocurrency portfolio provides exposure to distinct market segments: established infrastructure (LINK) versus emerging community-driven assets (GORK), with different blockchain ecosystem positioning (Ethereum versus Solana). The diversification benefits stem from potentially uncorrelated price drivers: LINK's performance correlates with DeFi adoption, oracle service demand, and institutional infrastructure requirements, while GORK's dynamics relate to retail sentiment, social media engagement, and meme token market cycles. However, both assets remain subject to broader cryptocurrency market correlation during significant market movements. For diversification effectiveness, portfolio construction should consider the 24-hour trading volume differential ($15.4M for LINK versus $21.8K for GORK), liquidity risk management, and rebalancing challenges. The combination might serve investors seeking infrastructure exposure through LINK while maintaining calculated exposure to higher-volatility community-driven dynamics through GORK, though individual risk tolerance and investment timeframes should guide specific allocation decisions.
Share
Content
Introduction: GORK vs LINK Investment Comparison
I. Historical Price Comparison and Current Market Situation
II. Core Factors Influencing GORK vs LINK Investment Value
III. 2026-2031 Price Predictions: GORK vs LINK
IV. Investment Strategy Comparison: GORK vs LINK
V. Potential Risk Comparison
VI. Conclusion: Which Is the Better Buy?
VII. FAQ
How to Buy Cryptocurrency


Trending Cryptocurrencies


What will be the market capitalization of USDC in 2025? Analysis of the stablecoin market landscape.

How is DeFi different from Bitcoin?

What is DeFi: Understanding Decentralized Finance in 2025

USDC stablecoin 2025 Latest Analysis: Principles, Advantages, and Web3 Eco-Applications

Development of Decentralized Finance Ecosystem in 2025: Integration of Decentralized Finance Applications with Web3
2025 USDT USD Complete Guide: A Must-Read for Newbie Investors

2026 VGX Price Prediction: Expert Analysis and Market Forecast for the Upcoming Year

2026 TRVL Price Prediction: Expert Analysis and Market Forecast for Travel Token's Future Growth
What is a Retrodrop and How to Earn From It
Is U2U Network (U2U) a good investment?: A Comprehensive Analysis of Technology, Tokenomics, and Market Potential
Bitcoin Unit 'Satoshi': A Comprehensive Guide