Santiment highlights 5 suitable signals to bottom out cryptocurrencies
The cryptocurrency market capitalization has decreased by more than 20% since the beginning of 2026. As of February, investors remain divided on whether prices have approached a local bottom or if the bear market still has room to extend further.
In the context of persistent volatility and increasing uncertainty, an important question arises: When is the right time to “buy the dip”? The Santiment data analysis platform has provided five key signals to help traders make more informed decisions.
Are traders missing buy signals during market panic? Santiment reveals 5 important indicators
According to Santiment, the first signal stems from extreme negative social sentiment. By analyzing positive and negative language directly related to specific assets, traders can filter out noise and identify when fear dominates discussions.
In the past, sudden spikes of fear, uncertainty, and doubt (FUD) on social media often coincided with pessimistic comments, followed by strong market recoveries.
Santiment’s analysis indicates that: “When Bitcoin hit a bottom at $60,001 on Thursday, the largest market cap asset in the crypto space recovered spectacularly, rising over 19% in less than 24 hours after FUD spread. When negative sentiment peaks, it usually happens because prices are falling sharply. And when you start seeing apocalyptic predictions for the crypto market, that’s often the ideal time to ‘buy the dip.’”
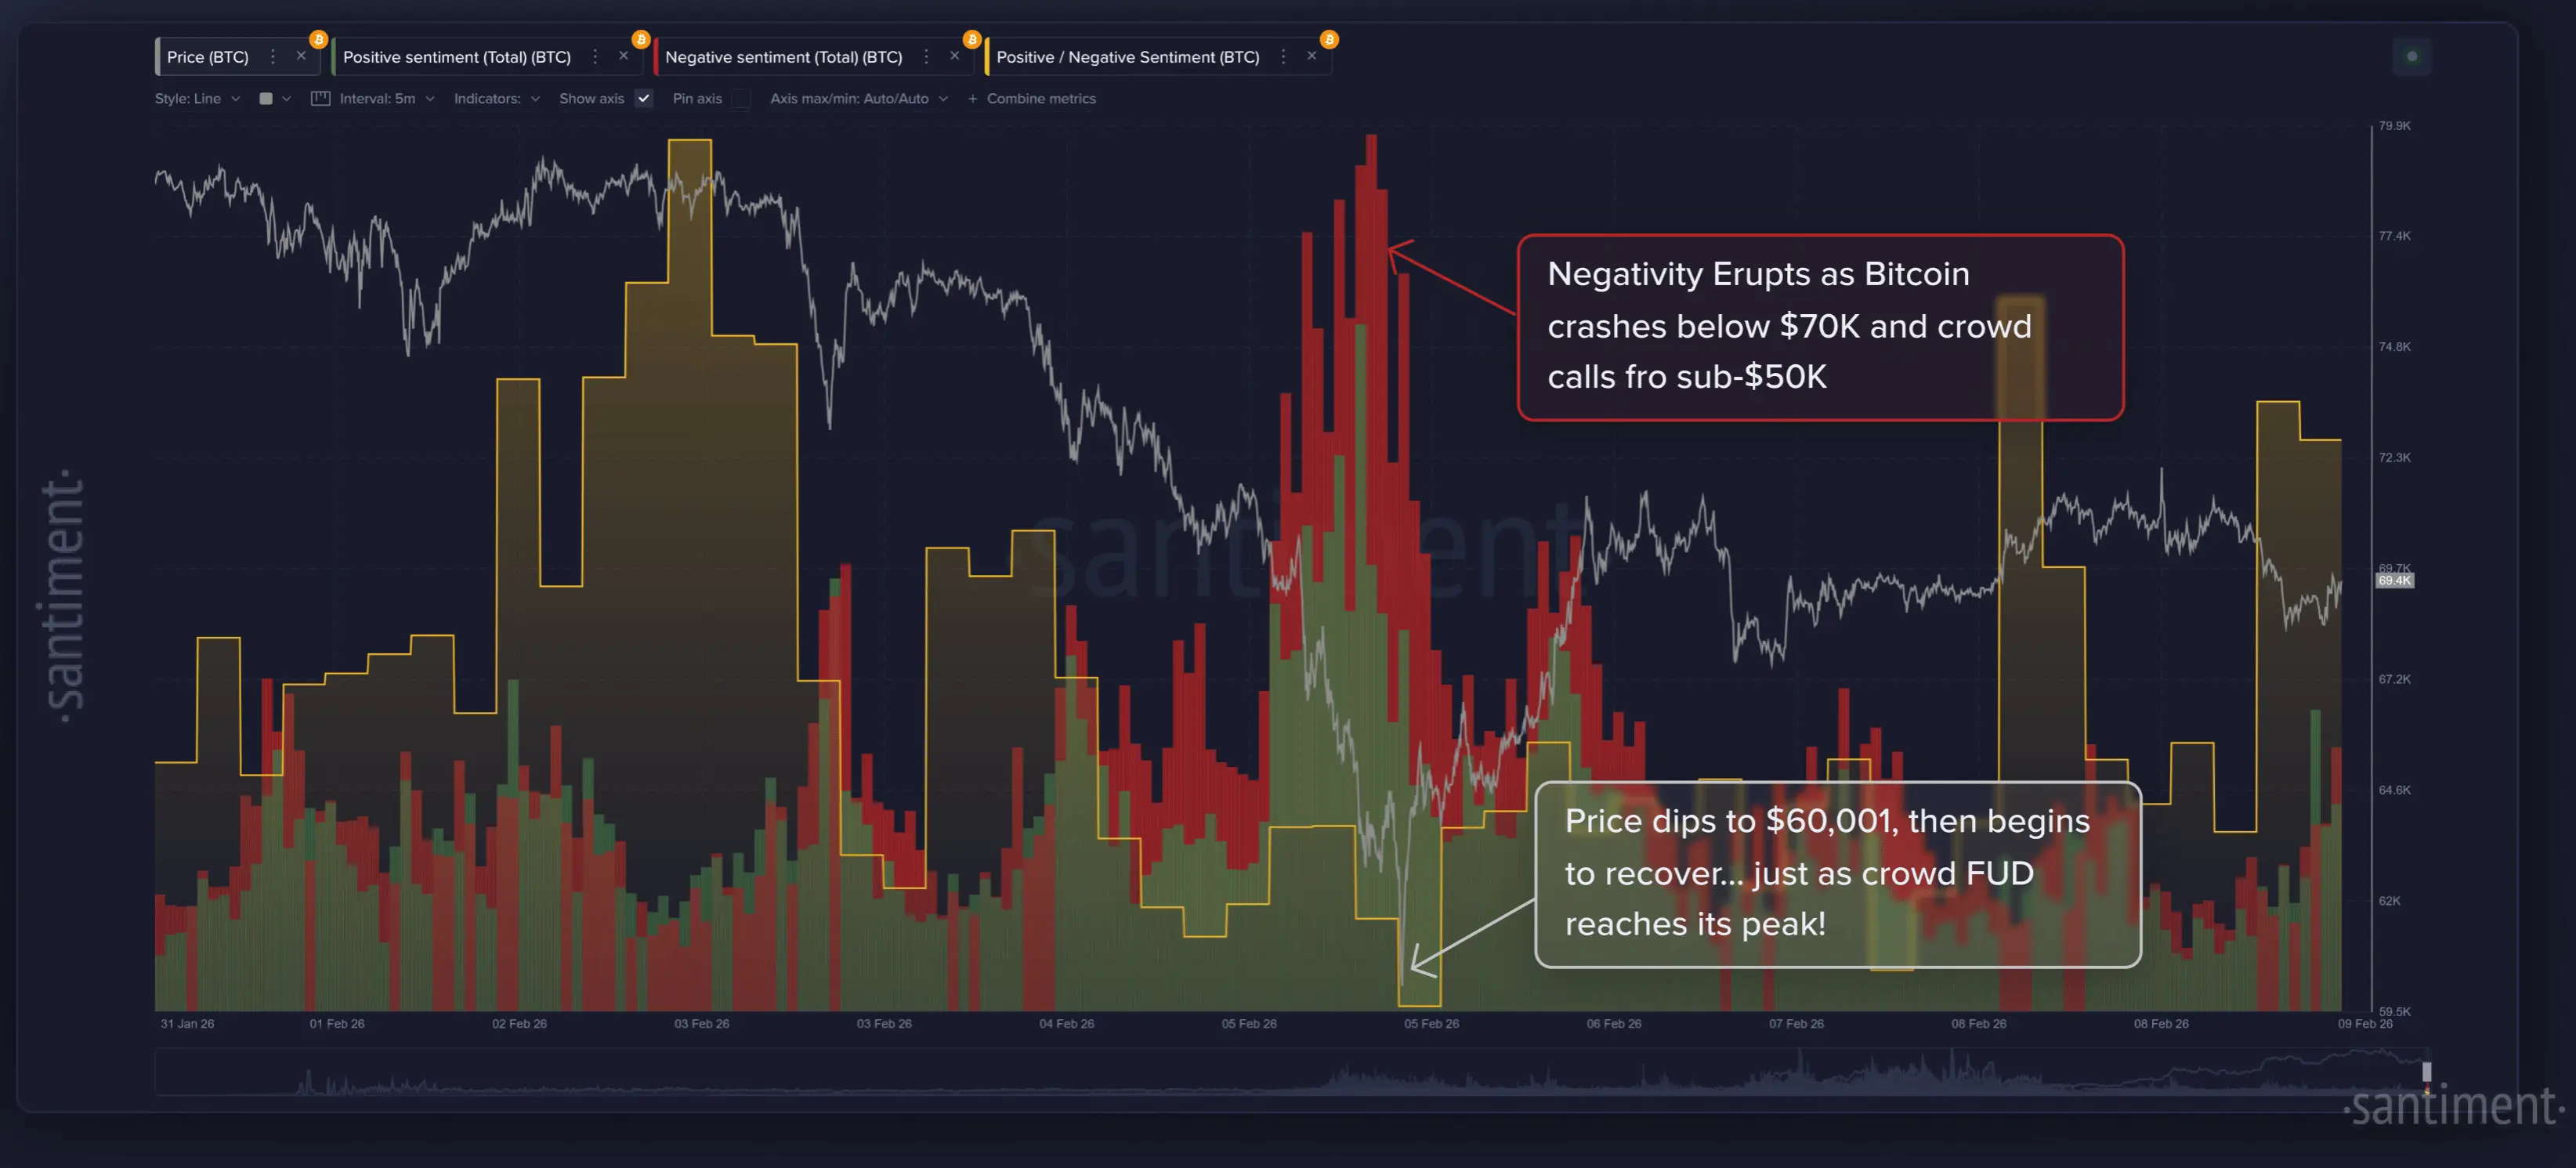 Negative comments as a buy signal during price drops | Source: Santiment## Key market sentiment signals
Santiment also emphasizes another important indicator: an increase in keywords like “buy,” “buying,” or “bought” combined with “discount.” These phrases tend to appear more during sell-offs, but Santiment warns that this indicator should not be used in isolation. The reason is that the market can recover before retail traders completely give up their positions.
A more reliable signal is a shift in language usage. When terms like “discount” gradually give way to more extreme words such as “collapse” or “disaster,” it may indicate capitulation driven by peak fear.
Additionally, monitoring popular discount-related keywords like “panic sell,” “sharp decline,” or even pessimistic statements like “this asset will go to zero” can help identify when retail investor confidence begins to waver.
On-chain data: Signals from the MVRV ratio
The final signal highlighted by Santiment involves on-chain data analysis, specifically the 30-day Market Value to Realized Value (MVRV) ratio. This metric measures whether active wallets are, on average, in profit or loss.
When MVRV drops into a “strongly undervalued” zone, it indicates that recent investors are experiencing losses. Typically, this is a sign that the market may be about to reverse and recover.
Santiment further explains: “As the chart indicates, you should avoid heavy investing when the asset is in the ‘Strongly Overvalued’ zone. Conversely, buying when the asset falls below the ‘Strongly Undervalued’ zone often presents significant growth opportunities.”
Strategic considerations and timing
Santiment’s analysis emphasizes that whether a price decline is a buying opportunity depends heavily on market context and each investor’s trading horizon. For short-term traders, a 1.7% price fluctuation can be an opportunity for intraday trading. Meanwhile, most market participants tend to react cyclically on a weekly basis, aligning better with their actual trading capacity.
Santiment recommends that instead of relying on gut feelings or baseless predictions, investors should base their decisions on objective data to identify when fear-driven sell-offs may have reached their bottom.
However, the platform also stresses that all investment decisions should be made according to individual preferences, risk tolerance, and long-term strategies. While Santiment’s signals can help identify extreme fear phases and potential opportunities, they do not guarantee market recovery immediately afterward.
Currently, many analysts believe that the bear market still has room to continue, meaning prices could remain under pressure in the near future. Therefore, buying or holding decisions should be carefully considered based on personal goals and financial strategies.