Analyst predicts Solana's price will drop sharply to $40
Recent Solana (SOL) price action has confirmed the formation of a classic “head and shoulders” pattern across multiple timeframes. This change has set a new bearish target for SOL, expected to fluctuate around $50, based on how this pattern typically operates when the neckline is broken.
This warning comes just weeks after a top analyst suggested that SOL might need more time to break above the $280 level, as many traders anticipated. According to the perspective shared in January, the reasons are quite clear: some on-chain signals and derivative indicators have weakened after reaching a local peak recently.
However, the analyst also emphasized that SOL’s long-term bullish outlook remains intact. It still has the potential to retest its all-time high of $295 set on January 19. Nevertheless, current less-than-optimistic data has raised short-term concerns, especially whether recent capital inflows are strong enough to sustain the rally.
Bearish Pattern Indicates $42 Target for Solana
Since reaching a cycle peak of nearly $295 in January 2025, Solana’s price has dropped over 72%. This prolonged sell-off has also completed the formation of a head and shoulders pattern across various timeframes.
In technical analysis, the head and shoulders pattern is often seen as a potential bearish signal. Cryptocurrency analyst Bitcoinsensus highlighted this event by publishing a chart clearly illustrating the pattern’s confirmation.
According to their assessment, breaking the neckline has opened significant downside risk. In a post on X platform on Monday, Bitcoinsensus stated that SOL has now broken out of a larger head and shoulders pattern. The analyst also predicted that this move could push SOL’s price down to $50.
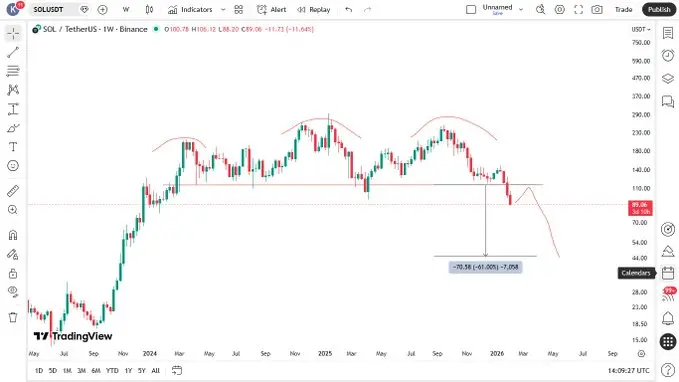 Solana Price Action | Source: TradingViewMeanwhile, Nextiscrypto commented that Solana’s two-week chart shows a textbook head and shoulders pattern, with a measured downside target around $45.
However, some other analysts believe the decline could extend further. An anonymous analyst known as Shitpoastin pointed out that Solana’s monthly chart has been forming a large-scale head and shoulders pattern over the past two years.
They noted that if this pattern continues to develop and breaks, SOL’s price chart will have little support until it hits around $30. Using standard measurement methods, the downside target is estimated at about $57, representing roughly a 32% decline from current trading levels.
SOL Price Recovers from $75 as MVRV Indicators Signal Exhaustion of Selling Pressure
Solana’s recent sell-off finally halted at $75, coinciding with the lower boundary of extreme MVRV divergence bands. This is an area traders often monitor to determine whether the price is unusually undervalued.
MVRV bands track how much the price of SOL deviates from the average price at which coins last changed hands. In other words, they provide information on whether the market is overvaluing or undervaluing SOL relative to recent investor purchase prices.
In previous market cycles, Solana’s price often dipped to the lowest MVRV band before finding a true bottom. Sometimes, the price dipped slightly below this band before rebounding. For this reason, this zone is often considered a “pressure test” level, where selling pressure tends to weaken.
A notable example was in March 2022, when SOL tested the lowest band at $75 and then surged about 87% over three weeks to reach $140. A similar rebound occurred in December 2020, when the price bounced from a comparable extreme zone.
In past cycles, Solana’s price typically only bottomed out when it dipped into the lowest MVRV band, sometimes even falling below it. This is why traders closely watch this area, as it often marks the point where selling pressure begins to wane.
However, this history also serves as a warning for the current situation. If SOL’s price clearly breaks below $75, it could signal the start of a deeper decline, similar to what happened in 2022. In that case, the next drop could align with the downside target set by the head and shoulders pattern.
Related Articles
Solana $SOL Dips Into Key Support — Could This Pattern Trigger a Bounce Back?
Data: 25,008.43 SOL transferred out from an anonymous address, then relayed to another anonymous address
USDC Treasury has added a new minting of 250 million USDC on the Solana blockchain.
New Model Flags Solana as Deeply Undervalued at $87: SOL Price Analysis