2025 SNT Price Prediction: Expert Analysis and Market Outlook for Status Network Token

Introduction: SNT's Market Position and Investment Value
Status (SNT) stands as a pioneering decentralized communication and application platform built on Ethereum, known in the industry as the "blockchain WeChat." Since its inception in 2017, SNT has established itself as a comprehensive mobile application integrating instant messaging, decentralized application browsing, and Ethereum-based wallet functionality. As of December 2025, SNT has achieved a market capitalization of approximately $88.8 million, with a circulating supply of around 3.96 billion tokens, currently trading at $0.01305 per token. This innovative asset is playing an increasingly vital role in enabling encrypted communications, decentralized application interactions, and cross-border cryptocurrency transactions within the Ethereum ecosystem.
This article will provide a comprehensive analysis of SNT's price trajectory from 2025 through 2030, integrating historical price patterns, market supply and demand dynamics, ecosystem development progress, and macroeconomic factors to deliver professional price forecasts and actionable investment guidance for investors.
SNT Price History Review and Market Analysis Report
I. SNT Price History Review and Market Status
SNT Historical Price Evolution Trajectory
Based on the available data, SNT reached its all-time high of $0.684918 on January 3, 2018, following its ICO launch on June 22, 2017. The token achieved this peak during the early bull market phase of Ethereum-based projects.
The lowest price point of $0.00592935 was recorded on March 13, 2020, reflecting the significant market downturn during that period.
SNT Current Market Status
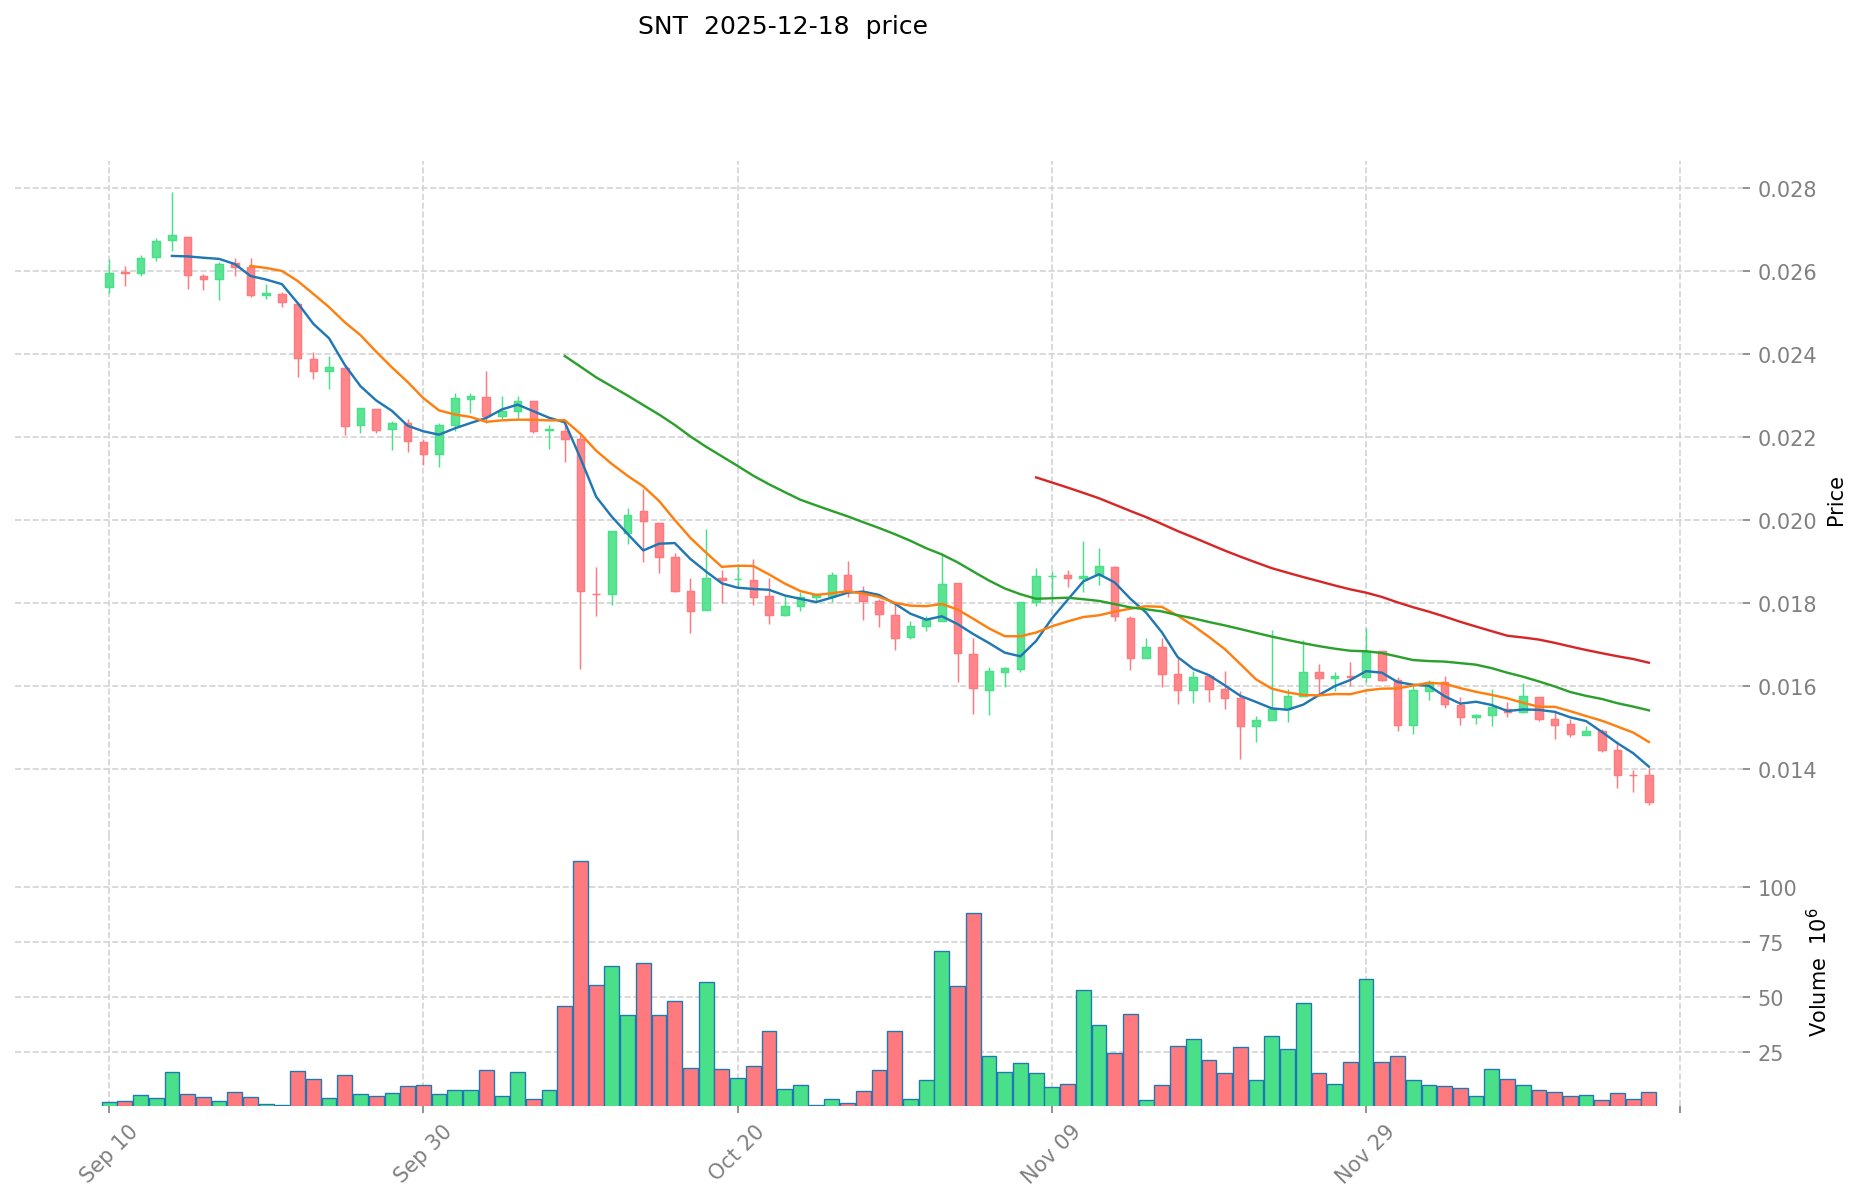
As of December 18, 2025, SNT is trading at $0.01305, representing a decline of 4.81% over the past 24 hours. The token's current market capitalization stands at approximately $51.68 million with a fully diluted valuation of $88.80 million.
Key Market Metrics:
- Price Range (24H): $0.01295 to $0.01403
- Trading Volume (24H): $84,806.77
- Circulating Supply: 3,960,483,788.31 SNT tokens (58.20% of total supply)
- Total Supply: 6,804,870,174 SNT
- Market Ranking: #491
- Market Dominance: 0.0028%
- Active Holders: 76,403
- Trading Exchanges: 16 platforms
Price Performance Across Multiple Timeframes:
- 1 Hour: +0.38%
- 24 Hours: -4.81%
- 7 Days: -12.23%
- 30 Days: -17.50%
- 1 Year: -75.11%
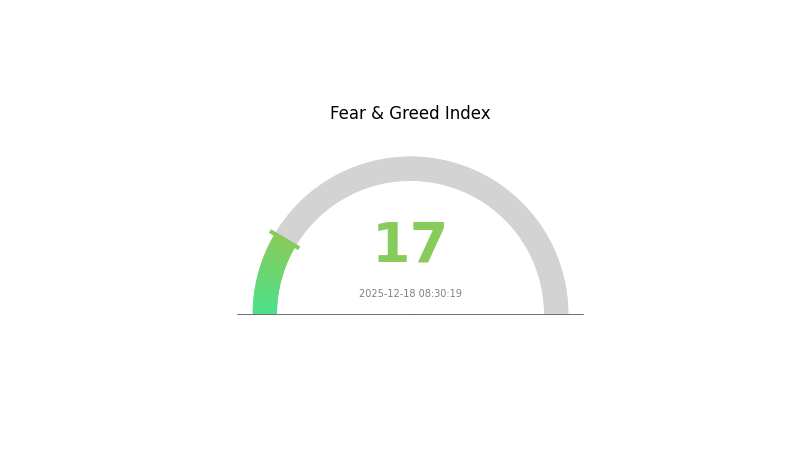
The market sentiment indicator shows "Extreme Fear" (VIX level 17), reflecting overall risk aversion in the cryptocurrency market as of the current date.
Click to view current SNT market price
SNT Market Sentiment Index
2025-12-18 Fear and Greed Index: 17 (Extreme Fear)
Click to view the current Fear & Greed Index
The cryptocurrency market is currently experiencing extreme fear, with the Fear and Greed Index at 17. This historically low reading indicates intense market pessimism and panic selling pressure. During such extreme fear periods, long-term investors often view market dips as buying opportunities, as assets may be undervalued. However, caution is advised, as prices could continue declining. Consider dollar-cost averaging or setting clear entry points on Gate.com rather than making impulsive decisions during heightened volatility.
SNT Holdings Distribution
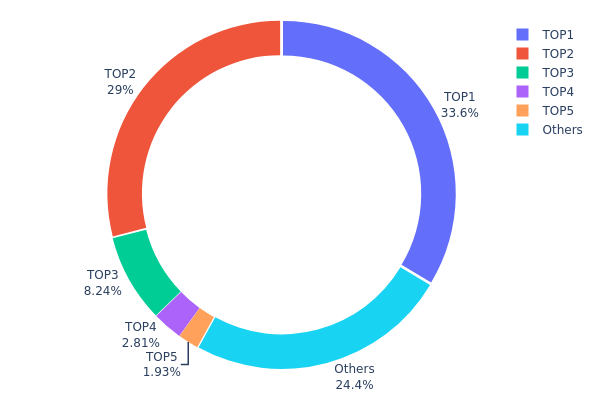
The address holdings distribution map represents the concentration of SNT tokens across blockchain addresses, serving as a critical metric for assessing token decentralization and potential market manipulation risks. By analyzing the proportion of total token supply held by top addresses, this data reveals the structural characteristics of token ownership and provides insights into the distribution dynamics of the network.
SNT currently exhibits significant concentration characteristics, with the top two addresses controlling approximately 62.60% of the total supply. The leading address (0x3542...27b349) holds 33.60%, while the second address (0xbbf0...af6022) accounts for 29.00%, collectively representing a substantial portion of circulating tokens. The third-largest holder possesses 8.24%, followed by progressively smaller positions. This distribution pattern indicates moderate to high concentration risk, as the combination of the top three addresses alone controls over 70% of the token supply, suggesting that coordinated actions by these major stakeholders could potentially influence market dynamics.
The concentration level raises important considerations regarding market structure and price stability. While the remaining 24.43% is distributed across numerous smaller addresses, the dominance of the top two holders creates asymmetrical market conditions. Such concentration patterns may amplify price volatility during significant token movements and could present scenarios where large-scale liquidations or accumulations by major holders significantly impact market sentiment and pricing. The current distribution reflects a partially decentralized structure, with concentration levels that warrant monitoring for potential systemic risks to market stability and fair price discovery mechanisms.
Visit SNT Holdings Distribution on Gate.com for real-time data.
| Top | Address | Holding Qty | Holding (%) |
|---|---|---|---|
| 1 | 0x3542...27b349 | 2286601.81K | 33.60% |
| 2 | 0xbbf0...af6022 | 1973412.35K | 29.00% |
| 3 | 0x5b0b...08c565 | 560974.03K | 8.24% |
| 4 | 0x57d7...5feafa | 191504.49K | 2.81% |
| 5 | 0x326d...70a601 | 131276.82K | 1.92% |
| - | Others | 1661100.68K | 24.43% |
II. Core Factors Influencing SNT's Future Price
Market Sentiment and Investor Confidence
-
Sentiment Impact: Investor sentiment and confidence directly influence SNT price movements. Positive market news regarding widespread SNT adoption or major technological breakthroughs can significantly boost the token's value.
-
Adoption Effects: Major events such as platform adoption and significant technological upgrades can substantially impact SNT's market performance.
Regulatory Changes and Policy Environment
-
Regulatory Risk: Investment in digital currencies faces numerous risks, including market volatility, regulatory oversight, and technical defects. These factors can lead to sharp price fluctuations or even affect the token's continued existence.
-
Policy Monitoring: Regulatory changes at national and international levels play crucial roles in determining SNT's price trajectory and overall market acceptance.
Macroeconomic Trends and Market Dynamics
-
Economic Factors: SNT's exchange rate is influenced by multiple macroeconomic dimensions, including overall economic trends, policy frameworks, and technological innovation.
-
Investment Risks: Digital currency investments carry inherent risks that can cause dramatic price swings and affect the token's viability in the market.
III. SNT Price Forecast 2025-2030
2025 Outlook
- Conservative Forecast: $0.01006 - $0.01200
- Neutral Forecast: $0.01307
- Optimistic Forecast: $0.01425 (requires sustained platform adoption and positive market sentiment)
2026-2028 Medium-term Outlook
- Market Phase Expectation: Gradual recovery and consolidation phase with potential volatility, followed by gradual appreciation as ecosystem development progresses
- Price Range Predictions:
- 2026: $0.00929 - $0.01953
- 2027: $0.01527 - $0.01759
- 2028: $0.00957 - $0.01778
- Key Catalysts: Expansion of platform functionality, increased user adoption, integration of new services on Status network, and overall cryptocurrency market recovery
2029-2030 Long-term Outlook
- Base Case: $0.01517 - $0.01831 (assuming steady ecosystem development and moderate market growth)
- Optimistic Case: $0.01787 - $0.02270 (assuming accelerated platform adoption and favorable macroeconomic conditions)
- Transformational Case: $0.0227+ (extreme conditions including mass mainstream adoption, significant institutional interest, and breakthrough in Web3 mainstream integration)
- 2025-12-18: SNT trading range at $0.01006 - $0.01425 (current consolidation phase)
| 年份 | 预测最高价 | 预测平均价格 | 预测最低价 | 涨跌幅 |
|---|---|---|---|---|
| 2025 | 0.01425 | 0.01307 | 0.01006 | 0 |
| 2026 | 0.01953 | 0.01366 | 0.00929 | 4 |
| 2027 | 0.01759 | 0.01659 | 0.01527 | 26 |
| 2028 | 0.01778 | 0.01709 | 0.00957 | 30 |
| 2029 | 0.01831 | 0.01743 | 0.01517 | 33 |
| 2030 | 0.0227 | 0.01787 | 0.01555 | 36 |
SNT (Status) Professional Investment Strategy and Risk Management Report
IV. SNT Professional Investment Strategy and Risk Management
SNT Investment Methodology
(1) Long-term Holding Strategy
- Suitable investors: Blockchain enthusiasts and decentralized application advocates who believe in the long-term potential of Ethereum ecosystem infrastructure
- Operational suggestions:
- Accumulate SNT during market downturns when price volatility increases, leveraging dollar-cost averaging to mitigate timing risk
- Hold tokens for a minimum of 2-3 years to capture potential gains from ecosystem adoption and network effects
- Participate in Status ecosystem governance and community development to generate additional value beyond token appreciation
(2) Active Trading Strategy
- Technical analysis tools:
- Support and Resistance Levels: Identify trading zones using historical price data; SNT has demonstrated resistance near $0.014-0.018 range and support around $0.012-0.013 levels
- Volume Analysis: Monitor 24-hour trading volume trends; increased volume above 100,000 SNT suggests strengthening conviction in price direction changes
- Wave operation key points:
- Execute buy positions during periods of negative market sentiment when 7-day and 30-day price declines exceed 12% without fundamental deterioration
- Establish profit-taking targets at resistance levels, allocating 30-40% position exits to capture short-term volatility premiums
SNT Risk Management Framework
(1) Asset Allocation Principles
- Conservative investors: 1-3% of portfolio allocation
- Active investors: 3-7% of portfolio allocation
- Professional investors: 7-15% of portfolio allocation
(2) Risk Hedging Solutions
- Portfolio Diversification: Combine SNT holdings with established Ethereum infrastructure tokens to reduce single-asset concentration risk
- Stablecoin Reserve Strategy: Maintain 20-30% cash reserves in USD stablecoins to capitalize on sudden price corrections without forced liquidation
(3) Secure Storage Solutions
- Hot Wallet Option: Gate.com Web3 Wallet for frequent trading and ecosystem interaction; enable two-factor authentication and withdrawal whitelisting
- Self-custody approach: Transfer SNT to personal wallet addresses for long-term holdings exceeding 6 months; use hardware wallet backups stored in secure locations
- Security precautions: Never share private keys or recovery phrases; verify all smart contract interactions through official Status channels; maintain updated device security with latest patches
V. SNT Potential Risks and Challenges
SNT Market Risk
- User Adoption Lag: Despite its 2017 launch and positioning as a "blockchain WeChat," Status has failed to achieve mainstream adoption metrics comparable to traditional messaging platforms, limiting token utility and demand
- Extreme Price Volatility: SNT has experienced a -75.11% decline over the past year and -17.5% monthly decline, indicating significant downside pressure and unsustainable price momentum
- Liquidity Concentration: With only 16 trading pairs across exchanges and 24-hour volume of approximately $84,806, SNT suffers from relatively thin liquidity that can amplify price swings during large transactions
SNT Regulatory Risk
- Regulatory Classification Uncertainty: Unclear regulatory treatment of SNT as either utility token or security in different jurisdictions creates compliance exposure for exchanges and users
- Jurisdiction-Specific Restrictions: Potential bans or restrictions on SNT trading in major markets could significantly reduce liquidity and accessibility
- Compliance Burden on Development: Changes in securities regulations could impose operational constraints on Status ecosystem development and token distribution mechanisms
SNT Technical Risk
- Smart Contract Vulnerability Exposure: As an ERC-20 token built on Ethereum, SNT inherits technical risks from both its own codebase and the underlying Ethereum protocol
- Ecosystem Competition: Emergence of alternative messaging and decentralized application platforms with superior user experience or lower technical barriers may reduce Status platform relevance
- Scalability Constraints: Ethereum network congestion and transaction costs could impair the practical utility of Status for micropayments and frequent messaging use cases
VI. Conclusion and Action Recommendations
SNT Investment Value Assessment
Status (SNT) represents a pioneering effort to create a decentralized application ecosystem centered on blockchain-based communication and finance. The platform's integrated approach combining encrypted messaging, DApp browsing, and Ethereum wallet functionality addresses genuine infrastructure gaps in the Web3 space. However, the token has faced significant headwinds including subdued user adoption rates, extreme price depreciation (-75% annually), and market capitalization ranking of only 491st. The current price of $0.01305 reflects substantial distance from its 2018 all-time high of $0.684918, suggesting either significant upside recovery potential or structural challenges limiting long-term value realization. Investors should approach SNT as a speculative, high-risk venture capital play rather than a stable infrastructure investment.
SNT Investment Recommendations
✅ Beginners: Start with a minimal allocation (0.5-1% of crypto portfolio) through Gate.com spot trading to gain exposure without excessive risk exposure; use limit orders rather than market orders to avoid slippage in lower-liquidity conditions
✅ Experienced investors: Employ tactical accumulation during 15-20% monthly price declines; establish position size limits at 3-5% portfolio weighting and use trailing stop-loss orders set 8-10% below entry prices to manage downside risk
✅ Institutional investors: Conduct detailed due diligence on Status protocol roadmap, user metrics, and competitive positioning before deploying capital; structure positions with clear exit criteria tied to adoption milestones or regulatory developments
SNT Trading Participation Methods
- Spot Trading on Gate.com: Execute direct SNT purchases using fiat or stablecoin pairs; utilize Gate.com's advanced order types (limit, stop-loss, take-profit) to optimize entry and exit execution
- Liquidity Mining Programs: Participate in Status or partner platform liquidity pools to generate yield on SNT holdings, though this strategy carries impermanent loss and smart contract risks
- Direct Staking Mechanisms: Lock SNT in protocol contracts to support network governance and earn transaction fee distributions, creating passive income streams for long-term holders
Cryptocurrency investment carries extreme risk. This report does not constitute investment advice. Investors must make decisions based on individual risk tolerance and financial circumstances. Consult qualified financial advisors before committing capital. Never invest funds you cannot afford to lose entirely.
FAQ
What is the future potential of SNT?
SNT has strong growth potential, with projections to reach new price and market cap highs by 2029. The token benefits from increasing adoption, promising market trends, and expanding use cases within its ecosystem.
What is the all time high for SNT coin?
The all-time high for SNT coin is $0.68, achieved during its peak market performance. This represents the highest price SNT has reached since its launch.
Can Star Atlas reach 1 dollar?
Yes, Star Atlas could potentially reach $1 by the end of 2025 based on current market trends and growth projections. Strong community support and expanding metaverse adoption may drive this price movement.
Which crypto boom in 2025 prediction?
Bitcoin ETFs will drive substantial inflows in 2025. Crypto IPOs will surge with major unicorns going public. Tokenized real-world assets (RWAs) are predicted to exceed $50 billion, signaling institutional adoption and market expansion across Web3 sectors.
Share
Content
Introduction: SNT's Market Position and Investment Value
I. SNT Price History Review and Market Status
II. Core Factors Influencing SNT's Future Price
III. SNT Price Forecast 2025-2030
IV. SNT Professional Investment Strategy and Risk Management
V. SNT Potential Risks and Challenges
VI. Conclusion and Action Recommendations
FAQ
How to Buy Cryptocurrency


Trending Cryptocurrencies


2025 FST Price Prediction: Analyzing Market Trends, Technological Developments, and Potential Growth Factors

Hedera (HBAR) 2025 Price Analysis and Investment Prospects

Sui Price Market Analysis and Long-term Investment Potential in 2025

Where to Find Alpha in the 2025 Crypto Spot Market

Analysis of GT coin price and investment prospects in 2025
Latest Analysis and Investment Outlook for Chainlink Price in June 2025

Comparing Blockchain Transaction Efficiency: SegWit and NEM Explained

Guide to Participating and Claiming Rewards from Crypto Airdrops

Guide to Withdrawing Funds from Crypto Platform to Your Bank Account

Exploring Ethereum's Leading NFT Marketplace: Features and Guide

Creating Your Own Cryptocurrency Tokens: A Comprehensive Guide