This article provides a thorough analysis of the TURTLE (TURTLE) price prediction for 2025, focusing on market trends and growth potential. It explores TURTLE's market position, investment value, and its unique proposition as a Web3 distribution protocol. Key insights include its historical price evolution, current market status, factors influencing future prices, and a detailed investment strategy with risk management recommendations. Designed for DeFi participants and investors, the article offers practical strategies for navigating market volatility, while emphasizing TURTLE's long-term potential and associated risks.
Introduction: TURTLE's Market Position and Investment Value
TURTLE (TURTLE) is the first Distribution Protocol that monetizes Web3 activity by tracking user wallet activity across liquidity deployment, swaps, staking, and referral codes. Since its launch, TURTLE has established itself as a pivotal infrastructure solution in the DeFi ecosystem. As of December 2025, TURTLE's market capitalization has reached $56,590,000, with a circulating supply of approximately 154,700,000 tokens trading at around $0.05659 per coin. This innovative protocol, designed to align incentives among key DeFi participants—including Liquidity Providers (LPs), Developers, Venture Capitalists, Security Auditors, and Miners—is playing an increasingly critical role in establishing safeguarding mechanisms within decentralized finance.
This article provides a comprehensive analysis of TURTLE's price trajectory and market trends, integrating historical price patterns, market supply and demand dynamics, ecosystem development, and macroeconomic factors to deliver professional price forecasts and practical investment strategies for stakeholders considering exposure to this emerging DeFi infrastructure asset.
TURTLE Market Analysis Report
I. TURTLE Price History Review and Current Market Status
TURTLE Historical Price Evolution
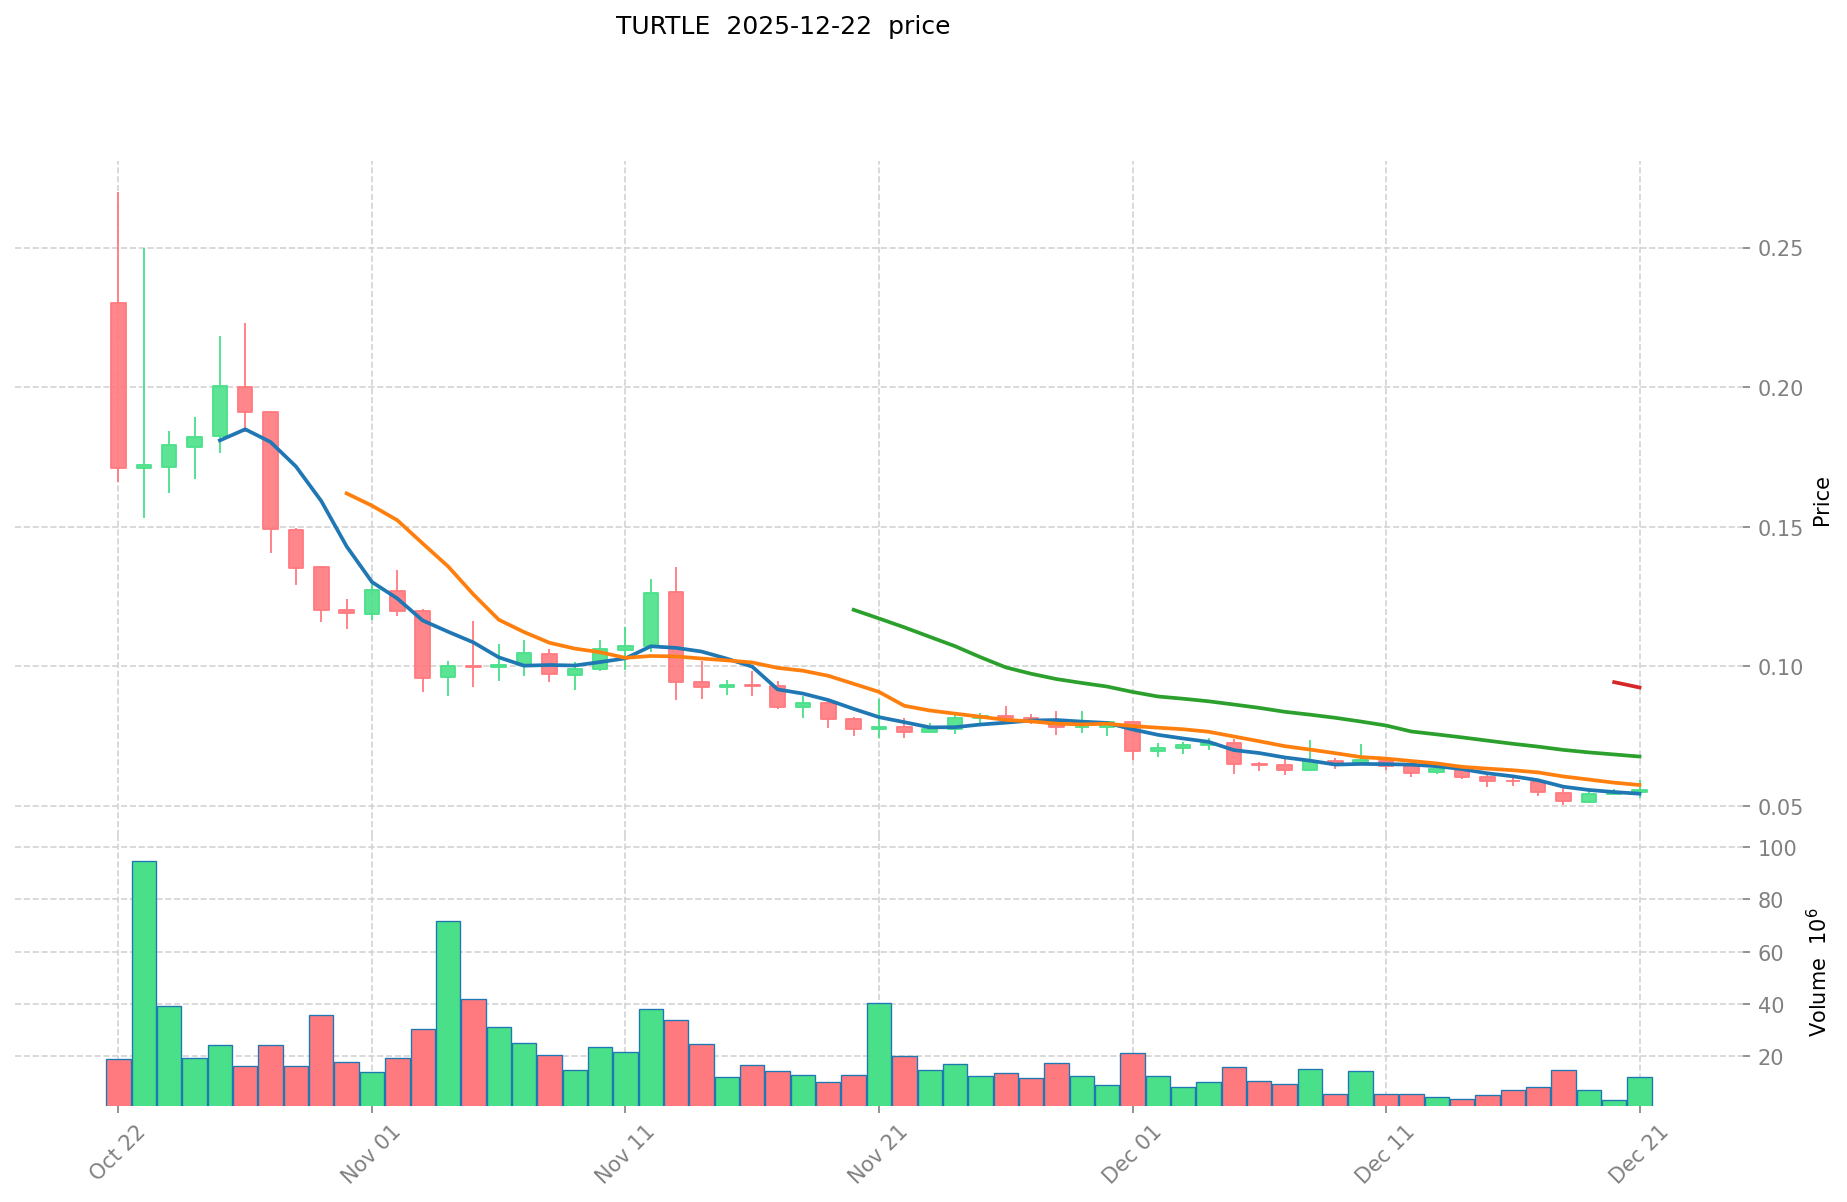
Based on available market data as of December 22, 2025, TURTLE has demonstrated significant price volatility since its market debut on October 22, 2025:
- October 22, 2025: TURTLE reached its all-time high (ATH) of $0.26998, marking the peak of initial market enthusiasm following its launch.
- December 18, 2025: The token hit its all-time low (ATL) of $0.05021, representing a substantial correction from peak valuations.
- Current Period: TURTLE is trading at $0.05659, recovering modestly from its recent lows.
TURTLE Current Market Status
Price Performance Metrics:
- Current Price: $0.05659
- 24-Hour Change: +3.16% (↑$0.001733)
- 7-Day Change: -8.12% (↓$0.005001)
- 30-Day Change: -27.37% (↓$0.021325)
- 1-Hour Change: -0.3% (↓$0.000170)
Market Capitalization and Supply:
- Market Cap: $8,754,473.0
- Fully Diluted Valuation (FDV): $56,590,000.0
- Circulating Supply: 154,700,000 TURTLE (15.47% of total supply)
- Total Supply: 1,000,000,000 TURTLE
- Market Dominance: 0.0017%
Trading Activity:
- 24-Hour Trading Volume: $758,064.18
- Price Range (24H): $0.05279 - $0.0595
- Number of Holders: 327
Network Coverage:
TURTLE operates across multiple blockchain networks including Ethereum (ERC-20), Binance Smart Chain (BEP-20), and Linea, enabling cross-chain accessibility and liquidity distribution.
Visit the current TURTLE market price
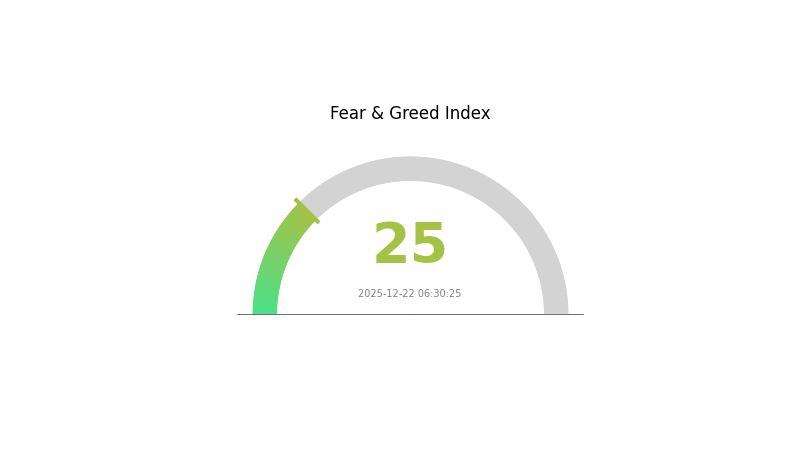
TURTLE Market Sentiment Index
2025-12-22 Fear and Greed Index: 25 (Extreme Fear)
Click to view current Fear & Greed Index
The crypto market is experiencing extreme fear as the Fear and Greed Index drops to 25. This indicates significant market pessimism and heightened investor anxiety. Such extreme fear levels historically present contrarian opportunities for long-term investors, as panic-driven sell-offs often create attractive entry points. However, caution remains essential as market volatility may continue. Monitor key support levels and consider dollar-cost averaging strategies during periods of extreme sentiment swings to mitigate timing risks.
TURTLE Holdings Distribution
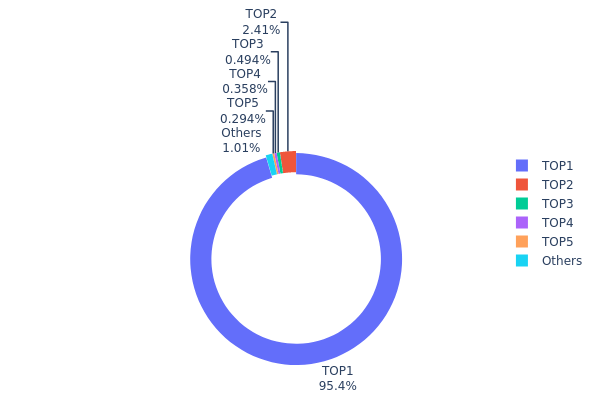
The address holding distribution chart illustrates the concentration of token ownership across blockchain addresses, revealing the structural composition and decentralization degree of TURTLE's on-chain ecosystem. By analyzing the top holders and their respective proportions, this metric provides critical insights into potential market vulnerabilities, liquidity dynamics, and governance concentration risks.
TURTLE exhibits a pronounced concentration pattern, with the top holder commanding 95.43% of total circulating supply, representing an extreme centralization scenario. The second-largest holder maintains only 2.41%, creating a significant disparity that indicates dominant control by a single address. The remaining top five addresses collectively account for approximately 4.57% of holdings, while other addresses hold a negligible 1.03%. This distribution structure suggests that TURTLE operates under substantial concentration risk, where market movements and price discovery mechanisms are heavily influenced by the decisions and actions of the primary stakeholder.
The extreme concentration observed in TURTLE's holder distribution raises material concerns regarding market manipulation potential and price stability. When a single entity controls over 95% of token supply, the market lacks the distributed ownership necessary for organic price discovery and genuine supply-demand dynamics. Such concentration typically correlates with heightened volatility risks and reduced trading liquidity outside controlled channels. The structural imbalance undermines TURTLE's decentralization characteristics and suggests that network participants face asymmetric exposure to the primary holder's operational decisions, including potential large-scale liquidations, strategic allocations, or reallocation events. This holder concentration pattern fundamentally constrains TURTLE's market maturity and institutional adoption potential.
For current TURTLE Holdings Distribution, please visit Gate.com
| Top |
Address |
Holding Qty |
Holding (%) |
| 1 |
0x2e03...7f25b2 |
666000.00K |
95.43% |
| 2 |
0xf977...41acec |
16847.12K |
2.41% |
| 3 |
0x28c6...f21d60 |
3446.30K |
0.49% |
| 4 |
0x8893...60d48f |
2500.00K |
0.35% |
| 5 |
0x1157...8f4101 |
2049.99K |
0.29% |
| - |
Others |
7031.40K |
1.03% |
II. Core Factors Affecting TURTLE's Future Price
Supply Mechanism
-
Token Distribution Model: TURTLE operates with a programmable liquidity model as outlined by the project's core vision. The project's tokenomics are designed to support its primary objective of making liquidity programmable within the ecosystem.
-
Current Market Impact: As of early 2025, market analysts maintain a predominantly positive outlook on TURTLE's price trajectory, with some analysts projecting prices around $0.0726, while others suggest potential year-end valuations reaching $0.07533.
Institutional and Major Holder Dynamics
-
Project Leadership: TURTLE is led by CEO Essi Lagevardi, who has articulated the project's core vision of making liquidity programmable through public statements. This leadership structure represents a key factor in project credibility and strategic direction.
-
Investment Backing: The project has secured funding from top-tier cryptocurrency investors, providing capital support for ecosystem development and operational expansion.
Market Sentiment and Regulatory Environment
-
Market Sentiment Factors: TURTLE's price predictions are significantly influenced by market sentiment driven by news cycles, social media discourse, and investor confidence levels. Positive sentiment indicators currently support bullish price forecasts.
-
Regulatory Dynamics: Regulatory developments, including government policy changes and potential approval frameworks, play a meaningful role in shaping price trajectory and market adoption prospects.
Three、2025-2030 TURTLE Price Forecast
2025 Outlook
- Conservative forecast: $0.02878 - $0.05643
- Neutral forecast: $0.05643 (average expected level)
- Bullish forecast: $0.06772 (requiring sustained market momentum)
2026-2027 Medium-term Outlook
- Market phase expectation: Consolidation with gradual upward bias, as the asset establishes support levels and attracts institutional attention
- Price range forecast:
- 2026: $0.05524 - $0.07263
- 2027: $0.04041 - $0.08688
- Key catalysts: Protocol upgrades, ecosystem expansion, increased adoption on trading platforms such as Gate.com, and growing institutional interest in the asset class
2028-2030 Long-term Outlook
- Base case scenario: $0.0748 - $0.0856 by 2028 (assuming steady adoption and moderate market growth)
- Bullish scenario: $0.08136 - $0.10902 by 2029 (contingent on significant protocol improvements and mainstream recognition)
- Transformative scenario: $0.09519 - $0.13041 by 2030 (under conditions of breakthrough technological advancement and widespread integration into decentralized finance ecosystem)
- 2030-12-31: TURTLE projected at $0.13041 (68% cumulative upside potential from current levels)
| 年份 |
预测最高价 |
预测平均价格 |
预测最低价 |
涨跌幅 |
| 2025 |
0.06772 |
0.05643 |
0.02878 |
0 |
| 2026 |
0.07263 |
0.06207 |
0.05524 |
9 |
| 2027 |
0.08688 |
0.06735 |
0.04041 |
19 |
| 2028 |
0.0856 |
0.07711 |
0.0748 |
36 |
| 2029 |
0.10902 |
0.08136 |
0.06102 |
43 |
| 2030 |
0.13041 |
0.09519 |
0.06949 |
68 |
TURTLE Investment Strategy and Risk Management Report
IV. TURTLE Professional Investment Strategy and Risk Management
TURTLE Investment Methodology
(1) Long-term Holding Strategy
- Target Investors: DeFi protocol participants, liquidity providers, and risk-averse investors seeking exposure to Web3 infrastructure monetization
- Operational Recommendations:
- Accumulate TURTLE during market corrections when price falls below key support levels, particularly during periods of 7-day and 30-day downtrends
- Establish a dollar-cost averaging (DCA) approach to reduce timing risk, given TURTLE's current 24-hour volatility of 3.16%
- Maintain holdings across multiple blockchain networks (Ethereum, BSC, Linea) to diversify smart contract risk
- Store tokens securely using Gate Web3 Wallet for convenient access to DeFi opportunities on supported chains
(2) Active Trading Strategy
- Technical Analysis Considerations:
- Price Action: Monitor support at $0.05021 (all-time low) and resistance at $0.26998 (all-time high reached on October 22, 2025)
- Volume Analysis: Current 24-hour trading volume of $758,064 suggests moderate liquidity; traders should execute positions during peak volume periods
- Trading Execution Points:
- Enter positions during 7-day and 30-day downtrend phases (currently -8.12% and -27.37% respectively) when accumulation signals emerge
- Set profit-taking targets at 15-20% gains above entry prices, given TURTLE's recent price volatility and market positioning
TURTLE Risk Management Framework
(1) Asset Allocation Principles
- Conservative Investors: 1-3% of total crypto portfolio allocation, with preference for long-term holds
- Active Investors: 3-7% of total crypto portfolio allocation, with mixed holding and trading strategies
- Professional Investors: 5-10% allocation with systematic rebalancing quarterly based on DeFi metrics and protocol performance
(2) Risk Hedging Solutions
- Diversification Strategy: Distribute TURTLE holdings across the three supported blockchain networks (Ethereum, BSC, Linea) to mitigate single-chain smart contract vulnerabilities
- Position Sizing: Limit individual trade sizes to 2-3% of total portfolio, with stop-loss orders set at 8-10% below entry prices to protect against unexpected market movements
(3) Secure Storage Solution
- Custodial Wallet Recommendation: Gate Web3 Wallet provides integrated access to TURTLE positions while maintaining security standards for managing BEP-20, ERC-20, and Linea token standards
- Self-Custody Approach: For larger holdings, consider hardware wallet solutions that support multiple blockchain networks where TURTLE is deployed
- Security Best Practices: Enable two-factor authentication on all exchange accounts, maintain private key backups in secure locations, and verify contract addresses before token transfers to prevent phishing attacks
V. TURTLE Potential Risks and Challenges
TURTLE Market Risks
- Liquidity Concentration: With only one exchange listing and relatively modest 24-hour volume of $758,064, TURTLE faces liquidity constraints that could result in significant price slippage during large trades
- Price Volatility: The token has experienced 27.37% depreciation over 30 days and currently trades at $0.05659, recovering only 20.96% from its all-time low, indicating sustained bearish pressure
- Market Capitalization Risk: The fully diluted valuation of $56.59 million with only 15.47% circulating supply suggests significant dilution risk as the remaining 845.3 million tokens enter circulation
TURTLE Regulatory Risks
- DeFi Protocol Regulation: As a Distribution Protocol monetizing Web3 activities, TURTLE may face evolving regulatory scrutiny regarding how it classifies and operates incentive mechanisms across different jurisdictions
- Multi-Chain Compliance: TURTLE's deployment across Ethereum, BSC, and Linea creates jurisdiction-specific regulatory exposure, particularly regarding token classification and revenue-sharing mechanisms
- Token Classification Uncertainty: Regulatory authorities may reassess whether TURTLE functions as a utility token or security, potentially impacting its operational framework and investor protections
TURTLE Technical Risks
- Smart Contract Vulnerability: As a protocol tracking wallet activities and managing validator delegations, TURTLE faces inherent smart contract risks including potential vulnerabilities in activity monitoring and reward distribution mechanisms
- Cross-Chain Bridge Risk: Multi-chain deployment introduces technical risks associated with bridge protocols and inter-chain communication, potentially resulting in token loss or transaction failures
- Validator Infrastructure Risk: TURTLE's validator delegation model creates operational risks if validators experience downtime, attacks, or infrastructure failures affecting the network's ability to track user activities accurately
VI. Conclusion and Action Recommendations
TURTLE Investment Value Assessment
TURTLE presents a novel approach to DeFi monetization by aligning incentives among liquidity providers, developers, venture capitalists, security auditors, and miners through transparent activity tracking. However, current market conditions suggest significant headwinds: the token has declined 27.37% over 30 days, trades well below its all-time high, and faces liquidity constraints with limited exchange availability. The protocol's core mission to provide DeFi safeguarding shows promise, but execution risks remain substantial given nascent adoption and regulatory uncertainty surrounding Web3 activity monetization.
TURTLE Investment Recommendations
✅ Newcomers: Initiate exposure through small, dollar-cost-averaged purchases on Gate.com during confirmed support level bounces, maintaining positions for 6-12 months while monitoring DeFi adoption metrics and protocol governance developments.
✅ Experienced Investors: Implement tactical accumulation during 30+ day declining periods, use technical analysis to identify support zone rebounds near $0.05279 (24-hour low), and establish clear profit-taking targets at 20-30% gains to manage risk exposure.
✅ Institutional Investors: Conduct comprehensive due diligence on Turtle protocol's validator infrastructure, activity tracking mechanisms, and smart contract audit reports; consider position sizing of 5-10% with systematic rebalancing tied to DeFi market metrics and protocol fee data.
TURTLE Participation Methods
- Exchange Trading: Execute purchases on Gate.com with limit orders to control entry pricing and minimize slippage given current liquidity constraints
- Staking Participation: Delegate TURTLE tokens to network validators to earn protocol rewards while supporting network security and consensus mechanisms
- Liquidity Provision: Supply TURTLE paired with other assets to decentralized protocols supporting multi-chain deployments for yield generation, subject to impermanent loss risks
Cryptocurrency investments carry extreme risk. This report does not constitute investment advice. Investors must make decisions based on their individual risk tolerance and should consult professional financial advisors. Never invest more than you can afford to lose.
FAQ
What is the turtle coin prediction?
TurtleCoin price predictions vary by analyst. WalletInvestor provides forecasts for 2022, 2024, and 2026, while TradingBeasts offers 2023 projections. These predictions are based on technical analysis and market trends, though specific price ranges depend on market conditions and adoption rates.
What is TURTLE coin and what is its current price?
TURTLE coin (TRTL) is a decentralized cryptocurrency focused on privacy and community. Its current price is approximately $0.00001891, with a total supply of 133 billion TRTL tokens.
What factors influence TURTLE coin price predictions?
TURTLE price predictions are influenced by whale activity, market trading volume, blockchain adoption trends, and overall crypto market sentiment. Large holder movements and trading activity significantly impact price movements.
Is TURTLE coin a good investment for 2024-2025?
TURTLE coin shows promising potential for 2024-2025 based on current market trends and technical analysis. Strong fundamentals and growing adoption suggest positive outlook. Consider conducting thorough research before investing.
What are the risks associated with TURTLE coin price predictions?
Price prediction risks include market volatility, speculative trading, and regulatory uncertainty. Cryptocurrency markets are highly unpredictable and influenced by sentiment shifts. Predictions carry inherent uncertainty and should not be relied upon as investment guidance.
* The information is not intended to be and does not constitute financial advice or any other recommendation of any sort offered or endorsed by Gate.