Recently in the "charging" programming course, there are also moments of inspiration during the learning process;
I have an idea these days to prepare to write another indicator for "trend lines":
1. Automatically draw a trend line based on the candlestick chart.
2. When the candlestick chart is trending, the market shows the pivot price of the current trend line (support/resistance levels);
3. When the trend line ends, the market displays a reminder that the trend has ended;
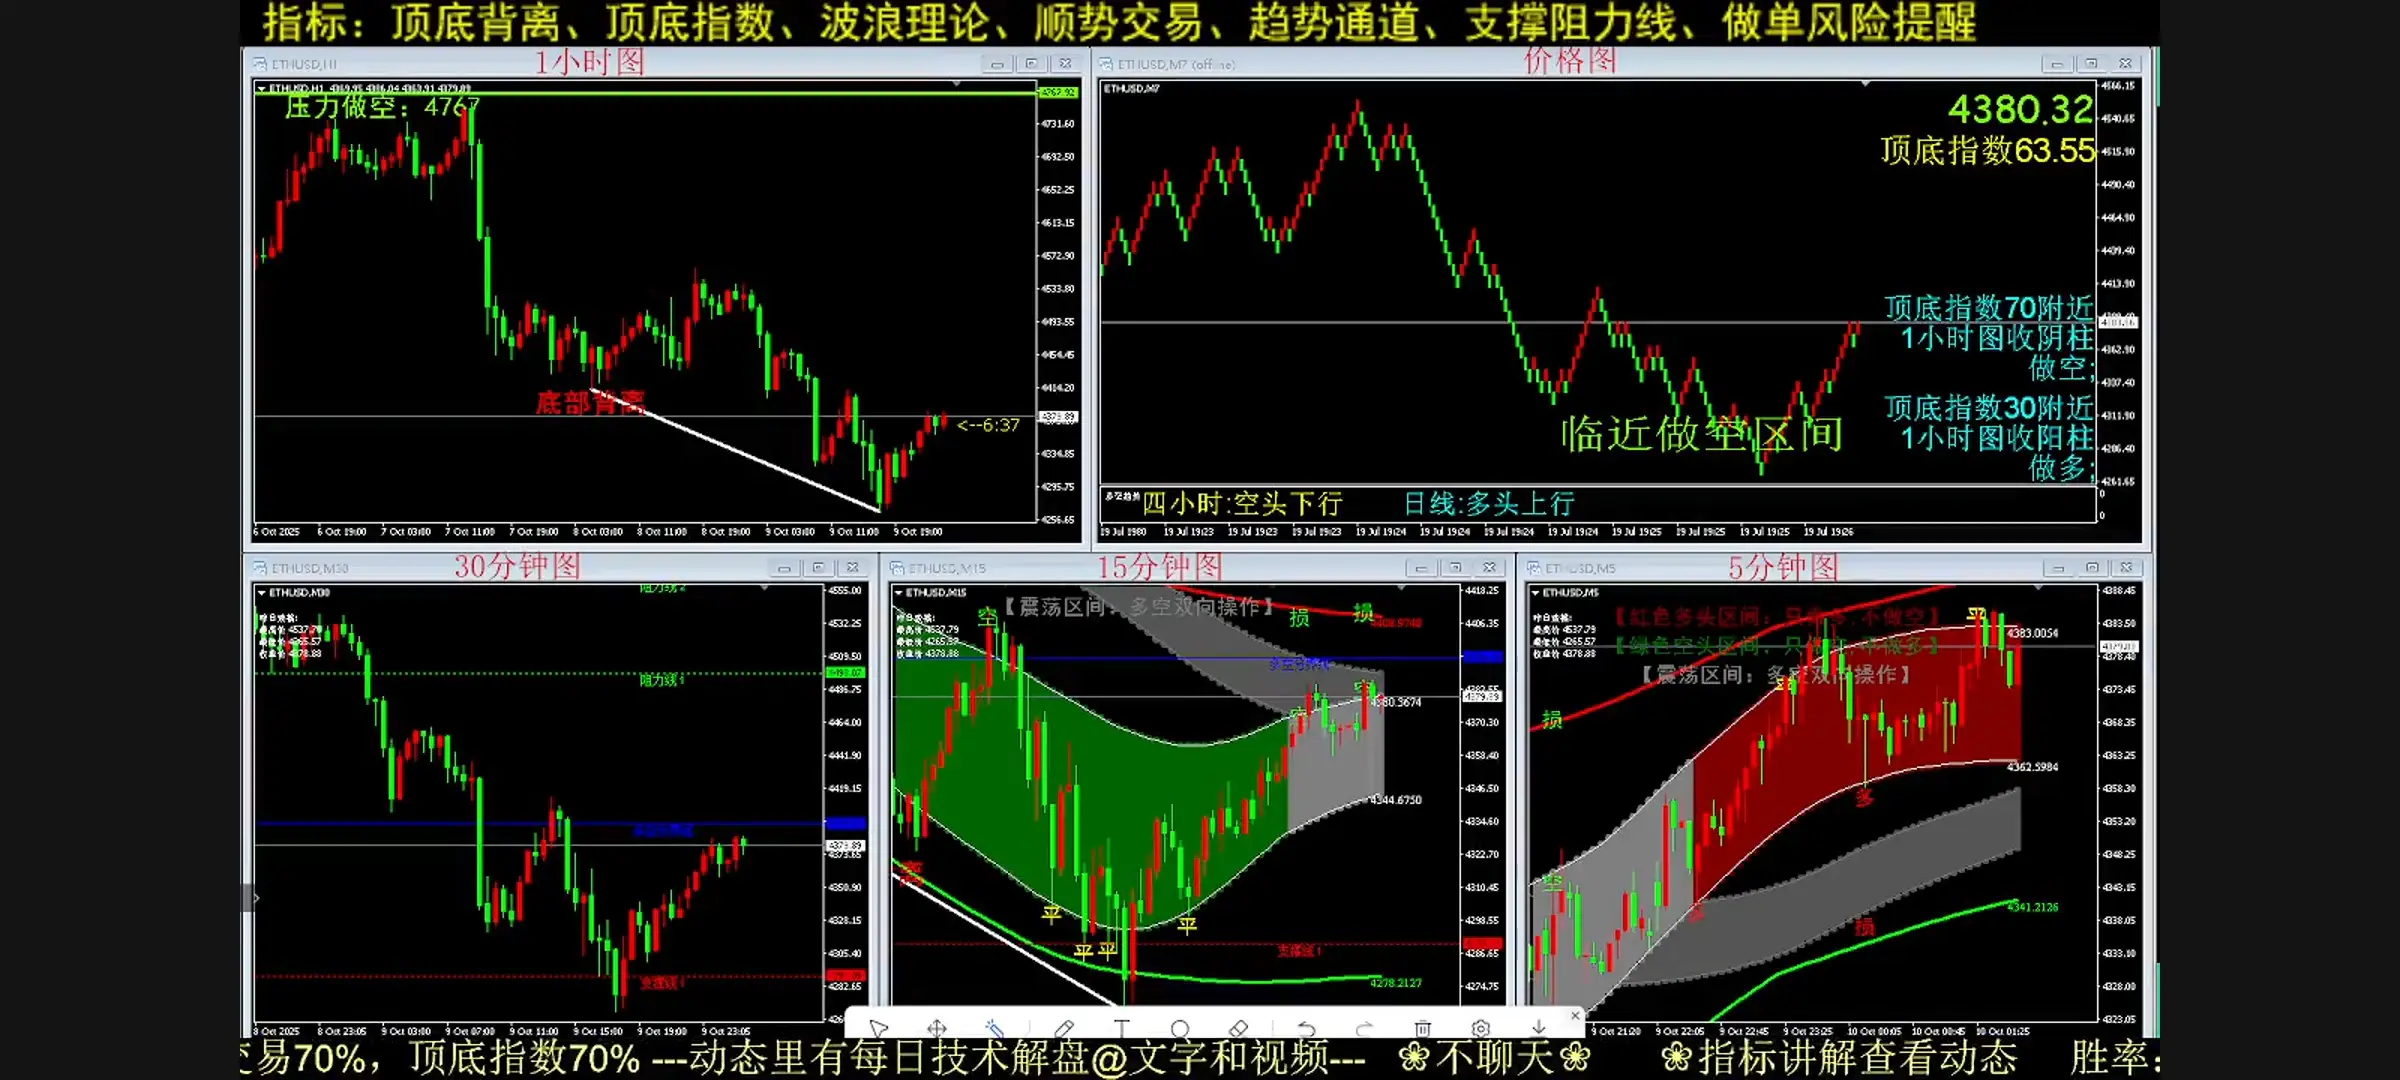
View OriginalI have an idea these days to prepare to write another indicator for "trend lines":
1. Automatically draw a trend line based on the candlestick chart.
2. When the candlestick chart is trending, the market shows the pivot price of the current trend line (support/resistance levels);
3. When the trend line ends, the market displays a reminder that the trend has ended;