2025 ACE Price Prediction: Expert Analysis and Market Forecast for the Next Bull Run

Introduction: ACE's Market Position and Investment Value
Fusionist (ACE) is an independent Web3 game that delivers AAA quality through Unity and HDRP technologies, offering three interconnected game modes for diverse players. Since its launch in November 2023, ACE has established itself in the gaming sector with a focus on fair gameplay and cross-platform accessibility. As of December 2025, ACE has achieved a market capitalization of approximately $35.73 million, with a circulating supply of around 84.11 million tokens, maintaining a price level of $0.2442. This innovative gaming asset is playing an increasingly important role in the Web3 gaming ecosystem through its backend-driven computation system and broad platform compatibility spanning both PC and mobile devices.
This article will provide a comprehensive analysis of ACE's price trajectory from 2025 through 2030, integrating historical performance patterns, market supply and demand dynamics, ecosystem development, and macroeconomic environmental factors to deliver professional price forecasts and practical investment strategies for investors.
Fusionist (ACE) Market Analysis Report
I. ACE Price History Review and Market Status
ACE Historical Price Evolution
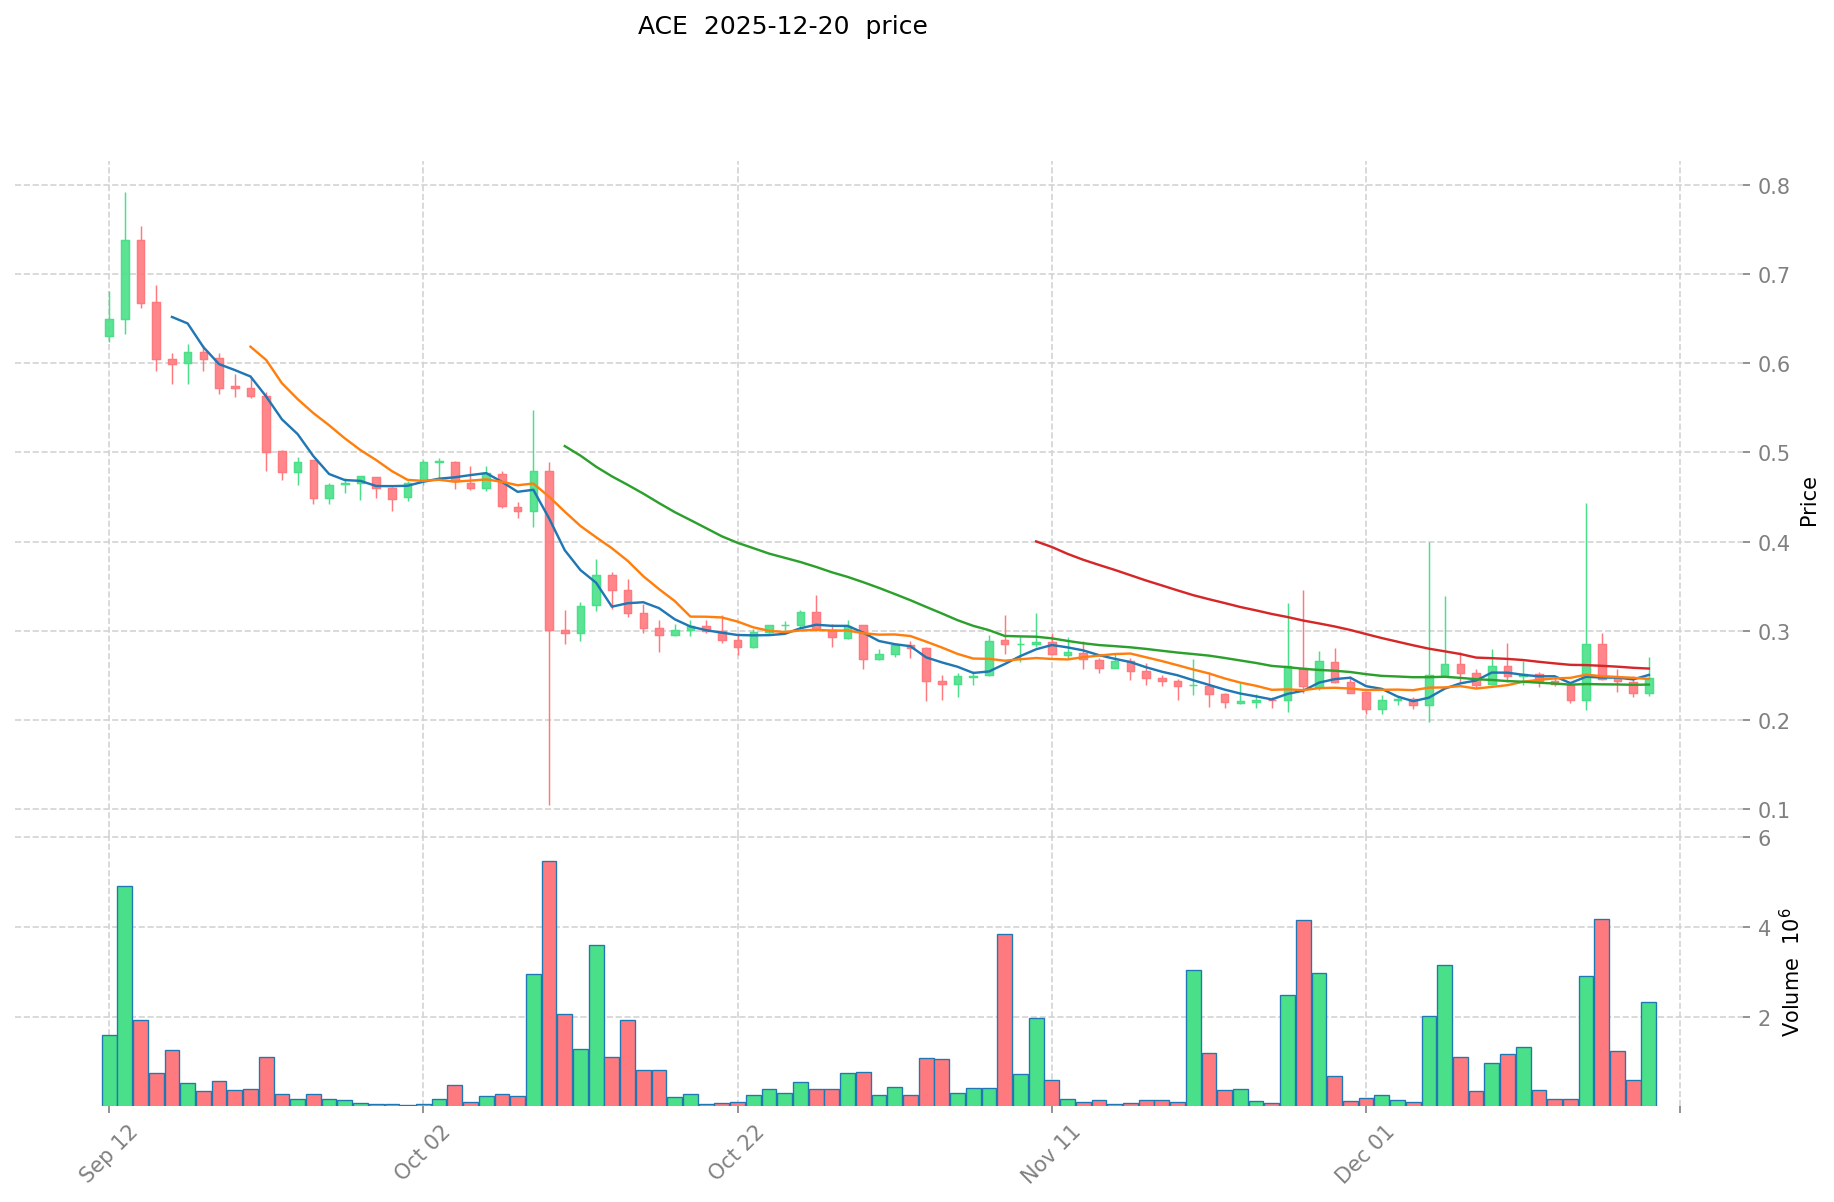
- December 2023: Reached all-time high of $15.659, marking the peak of market enthusiasm during the early growth phase of the project.
- 2024-2025: Experienced significant market correction, with the token declining substantially from its peak valuation.
- October 2025: Hit all-time low of $0.1045, reflecting the extended bear market conditions in the Web3 gaming sector.
ACE Current Market Position
As of December 20, 2025, ACE is trading at $0.2442, representing a 2.78% gain over the past 24 hours. The token has recovered modestly from its recent lows, though it remains significantly below historical highs.
Key Market Metrics:
| Metric | Value |
|---|---|
| Current Price | $0.2442 |
| 24h Trading Range | $0.2373 - $0.2704 |
| Market Cap | $20,538,897.90 |
| Fully Diluted Valuation | $35,728,381.85 |
| 24h Trading Volume | $505,860.88 |
| Circulating Supply | 84,106,871 ACE (57.22% of total) |
| Total Supply | 146,307,870 ACE |
| Maximum Supply | 147,000,000 ACE |
| Market Ranking | #860 |
| Number of Holders | 17,156 |
Performance Analysis:
- 1-Hour Change: -0.92%
- 7-Day Change: +0.37%
- 30-Day Change: +1.46%
- 1-Year Change: -87.9%
The token is currently trading with extreme fear sentiment in the broader market (VIX: 20). Despite the long-term decline from its December 2023 peak, recent short-term movements show stabilization with positive performance over 24-hour and 30-day periods.
Click to view current ACE market price
ACE Market Sentiment Index
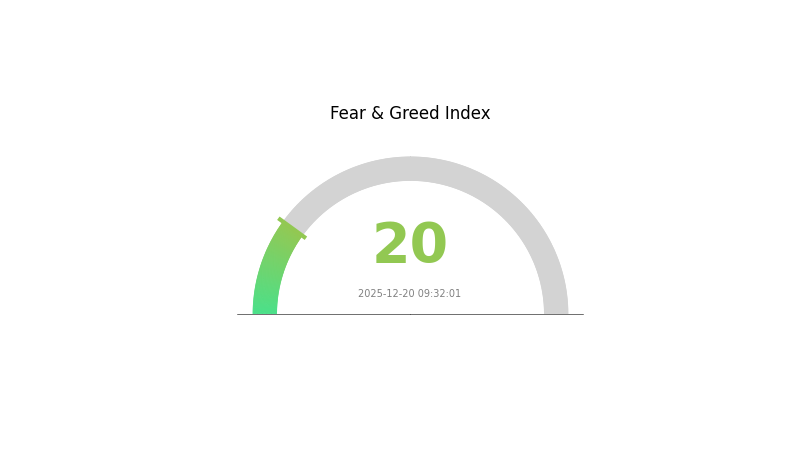
2025-12-20 Fear and Greed Index: 20 (Extreme Fear)
Click to view current Fear & Greed Index
The market is currently experiencing extreme fear with an index reading of 20. This indicates investors are highly anxious about market conditions, presenting potential opportunities for contrarian traders. When fear reaches this level, assets are often oversold, creating attractive entry points for long-term investors. However, exercise caution and conduct thorough research before making investment decisions. Monitor market developments closely and consider dollar-cost averaging to mitigate risks during volatile periods. Stay informed through Gate.com's market analysis tools to make well-informed trading decisions.
ACE Holdings Distribution
The address holdings distribution chart illustrates the concentration of ACE tokens across different wallet addresses, providing critical insights into token ownership structure and decentralization levels. By analyzing the top holders and their respective portfolio percentages, investors and analysts can assess market concentration risk, potential liquidity dynamics, and the overall health of the token's distribution ecosystem.
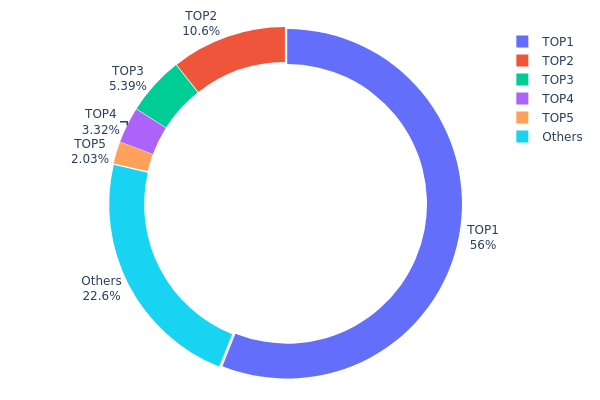
ACE exhibits significant concentration characteristics, with the top holder controlling 56.04% of the total supply, representing a substantial portion of circulating tokens. The top five addresses collectively account for 77.38% of all holdings, indicating pronounced concentration among a limited number of stakeholders. While the remaining addresses hold 22.62% of the token supply, demonstrating some degree of decentralization in the broader holder base, the dominance of the largest address raises concerns regarding potential centralization risks. This distribution pattern suggests that ACE's market dynamics could be substantially influenced by the actions of top holders, particularly the leading address whose outsized position presents elevated exposure to individual decision-making.
The current address distribution reflects a market structure with moderate decentralization challenges. The significant concentration among top-tier holders creates potential vulnerabilities related to price volatility and market manipulation, particularly if major stakeholders execute large transactions. However, the relatively diverse tail composition, with approximately 22.62% distributed among numerous smaller addresses, provides some counterbalance to extreme centralization. This mixed distribution pattern indicates a market that remains somewhat dependent on institutional or major holders' behavior, while still maintaining a foundation of broader token distribution that could support long-term ecosystem sustainability.
Click to view current ACE Holdings Distribution
| Top | Address | Holding Qty | Holding (%) |
|---|---|---|---|
| 1 | 0xa399...14b71c | 13844.52K | 56.04% |
| 2 | 0x8894...e2d4e3 | 2625.40K | 10.62% |
| 3 | 0xe4cb...a43abb | 1331.78K | 5.39% |
| 4 | 0x97b9...b68689 | 819.38K | 3.31% |
| 5 | 0xab78...3ee1bc | 501.10K | 2.02% |
| - | Others | 5581.10K | 22.62% |
II. Core Factors Influencing ACE's Future Price
Technology Development and Ecosystem Construction
-
Endurance 2.0 Mainnet Upgrade: This represents the key catalyst for ACE token appreciation. The successful launch of Endurance 2.0 is expected to unlock positive upward momentum through enhanced technical performance and network capability improvements.
-
Ecosystem Expansion: Steady growth in ecosystem applications is a crucial driver. As the blockchain gaming sector develops and adoption increases within the Fusionist ecosystem, this expansion is projected to support long-term price appreciation.
Macroeconomic Environment
-
Monetary Policy Impact: Global central banks have conducted 153 interest rate cuts in 2024, marking the third-highest level in history. Most central banks are expected to maintain room for further rate cuts in 2025, with accommodative monetary policies supporting liquidity in cryptocurrency markets.
-
U.S. Policy Dynamics: The incoming U.S. administration's policy framework—including potential corporate tax reductions and regulatory approaches—will influence cryptocurrency market sentiment and capital flows. Trade policies and inflation considerations remain important variables affecting risk asset valuations.
Market Sentiment and Price Expectations
Following successful mainnet upgrades and steady ecosystem growth, ACE price is projected to potentially reach the $0.80 to $1.20 range, representing approximately 56-134% growth from current levels. Market sentiment and successful Korean exchange listings could provide additional upward catalysts for price appreciation.
III. 2025-2030 ACE Price Forecast
2025 Outlook
- Conservative Forecast: $0.2174 - $0.2443
- Neutral Forecast: $0.2443 - $0.2825
- Optimistic Forecast: $0.2825 - $0.3249 (requires sustained market momentum and increased institutional adoption)
2026-2028 Mid-term Outlook
- Market Phase Expectation: Gradual recovery and consolidation phase with steady appreciation driven by improving market sentiment and expanding use cases
- Price Range Predictions:
- 2026: $0.2391 - $0.3643
- 2027: $0.2369 - $0.3731
- 2028: $0.2999 - $0.4186
- Key Catalysts: Protocol upgrades, expanding ecosystem partnerships, growing DeFi integration, and increasing mainstream adoption of cryptocurrency assets
2029-2030 Long-term Outlook
- Base Case Scenario: $0.2302 - $0.5487 (assumes steady technological development and moderate market growth)
- Optimistic Scenario: $0.2377 - $0.5035 (assumes strong network effects and significant institutional investment inflows)
- Transformational Scenario: $0.4662 - $0.5487 (assumes breakthrough regulatory frameworks and mass market adoption)
- 2030-12-20: ACE trading at approximately $0.4661 (representing 90% appreciation from current levels under favorable market conditions)
| 年份 | 预测最高价 | 预测平均价格 | 预测最低价 | 涨跌幅 |
|---|---|---|---|---|
| 2025 | 0.32492 | 0.2443 | 0.21743 | 0 |
| 2026 | 0.3643 | 0.28461 | 0.23907 | 16 |
| 2027 | 0.37312 | 0.32445 | 0.23685 | 32 |
| 2028 | 0.41855 | 0.34879 | 0.29996 | 42 |
| 2029 | 0.54865 | 0.38367 | 0.2302 | 57 |
| 2030 | 0.50345 | 0.46616 | 0.23774 | 90 |
Fusionist (ACE) Investment Strategy and Risk Management Report
IV. ACE Professional Investment Strategy and Risk Management
ACE Investment Methodology
(1) Long-term Holding Strategy
- Suitable Investors: Web3 gaming enthusiasts and blockchain technology believers with medium to long-term investment horizons
- Operational Recommendations:
- Accumulate ACE tokens during price dips, leveraging the current market conditions where the token trades significantly below its all-time high of $15.659
- Set a multi-year holding period (3-5 years minimum) to capture potential upside from game ecosystem development and user growth
- Establish dollar-cost averaging (DCA) entry points to mitigate timing risk, given the -87.9% year-over-year decline
(2) Active Trading Strategy
- Technical Analysis Tools:
- Support and Resistance Levels: Monitor the 24-hour trading range ($0.2373 to $0.2704) and the 52-week support near $0.1045 (recent all-time low on October 10, 2025)
- Volume Analysis: Track the 24-hour trading volume of approximately $505,860 to identify liquidity conditions and potential breakout opportunities
- Wave Trading Key Points:
- Enter positions during positive sentiment periods when short-term momentum turns positive (current 24-hour change: +2.78%)
- Exit or take profits when resistance levels are approached, particularly around previous swing highs
ACE Risk Management Framework
(1) Asset Allocation Principles
- Conservative Investors: 1-2% of total portfolio allocation
- Active Investors: 3-5% of total portfolio allocation
- Professional Investors: 5-10% of total portfolio allocation (with strict stop-loss protocols at -15% to -20%)
(2) Risk Hedging Solutions
- Portfolio Diversification: Balance ACE positions with stable cryptocurrencies and traditional assets to reduce volatility exposure, particularly given the -87.9% annual decline
- Stop-Loss Orders: Implement automatic stop-loss orders at 15-20% below entry price to limit downside exposure in volatile market conditions
(3) Secure Storage Solutions
- Hot Wallet Option: Gate Web3 wallet for frequent trading and active management of ACE tokens
- Cold Storage Approach: For long-term holdings exceeding 6-12 months, consider transferring ACE to cold storage wallets to minimize security risks
- Security Precautions: Enable two-factor authentication (2FA) on all exchange accounts, use hardware security keys, maintain backup seed phrases in secure physical locations, and never share private keys or recovery phrases
V. ACE Potential Risks and Challenges
ACE Market Risk
- High Volatility: The token has experienced extreme price fluctuations, declining 87.9% over the past year while trading 98.4% below its all-time high, creating significant liquidation risks for leveraged positions
- Low Liquidity: With 24-hour trading volume of approximately $505,860 and a circulating market cap of $20.5 million, the token faces potential slippage during large transactions
- Market Concentration: As a lower-ranked token (ranked #860), ACE maintains relatively limited market presence and institutional adoption, making it vulnerable to sudden sell-offs
ACE Regulatory Risk
- Gaming Regulation Uncertainty: As a Web3 gaming token, ACE faces evolving regulatory frameworks across jurisdictions concerning gaming mechanics, token economics, and user protections
- Jurisdiction-Specific Restrictions: Certain countries may restrict or prohibit trading in gaming-related tokens, potentially limiting market access and liquidity
- Securities Classification Risk: Regulatory bodies may reclassify ACE or similar gaming tokens, subjecting them to stricter compliance requirements
ACE Technology Risk
- Smart Contract Vulnerabilities: Despite backend-driven computation using KCP and Flatbuffer protocols, unforeseen bugs or exploits could compromise token security or game mechanics
- Platform Dependency: Heavy reliance on blockchain infrastructure (currently on BSC - Binance Smart Chain) exposes ACE to network outages or congestion
- Game Development Execution: Delays in delivering promised game features, modes, or technology upgrades could diminish user engagement and token demand
VI. Conclusion and Action Recommendations
ACE Investment Value Assessment
Fusionist (ACE) represents a speculative investment opportunity in the Web3 gaming sector with significant technical ambitions (AAA-quality graphics via Unity and HDRP) but considerable execution and market risks. The token's 87.9% annual decline and current trading levels near recent lows suggest it has experienced substantial market correction. However, the token maintains active development, cross-platform compatibility, and a growing holder base (17,156 holders). Investment merit depends entirely on conviction in the long-term viability of the Fusionist gaming ecosystem and Web3 gaming adoption broadly. The 57.2% circulation ratio indicates reasonable token distribution, though the fully diluted valuation exceeds current market cap by nearly 1.74x, presenting additional dilution risks.
ACE Investment Recommendations
✅ Beginners: Start with micro-positions (0.5-1% portfolio allocation) using Gate.com's platform, implement strict stop-loss orders at -20%, and conduct thorough research into Fusionist's development roadmap before increasing exposure. Avoid leverage trading entirely.
✅ Experienced Investors: Consider 3-5% portfolio allocation with disciplined DCA strategies during support levels. Use technical analysis to identify entry points within the $0.23-$0.27 range, maintain detailed position tracking, and rebalance quarterly based on game development milestones.
✅ Institutional Investors: Conduct comprehensive due diligence on Fusionist's development team, game adoption metrics, and regulatory compliance. Consider positions only after evaluating on-chain activity, user acquisition trends, and competitive positioning within Web3 gaming. Implement custodial solutions with full audit trails and risk oversight.
ACE Trading Participation Methods
- Direct Spot Trading on Gate.com: Purchase ACE tokens directly through Gate.com's spot trading interface, accessing the $505,860+ daily volume with competitive fee structures
- Limit Order Strategy: Place limit orders at identified support levels ($0.23-$0.24) to accumulate positions without market impact
- Staking or Governance Opportunities: Explore any available yield farming or governance mechanisms within the Fusionist ecosystem to generate additional returns beyond price appreciation
Cryptocurrency investment carries extreme risk. This report does not constitute investment advice. Investors must make decisions based on personal risk tolerance and financial situations. Consultation with professional financial advisors is strongly recommended. Never invest funds that you cannot afford to lose completely.
FAQ
What is the ace price prediction for Binance?
ACE price prediction suggests potential movement between $0.022 to $0.024 in the near term. Market trends, trading volume, and technical indicators will influence price direction. Analysis shows moderate volatility with support and resistance levels guiding trader sentiment.
What is the share price target for Ace in 2030?
Based on current market analysis, ACE's price target for 2030 is projected between ₹3478 to ₹3860, depending on market conditions and adoption rates.
What factors influence ACE coin price movements?
ACE coin price is influenced by market supply and demand, trading volume, investor sentiment, regulatory developments, and broader cryptocurrency market trends. Network adoption and project developments also play significant roles.
Is ACE a good investment for 2024-2025?
ACE shows strong potential for 2024-2025 with growing market momentum and increasing transaction volume. Technical indicators suggest positive price trajectory. Consider your risk tolerance and investment strategy before entering.
What is the current market cap and trading volume of ACE?
The current market cap of ACE is $934,432. The 24-hour trading volume is $413,224, with ACE experiencing a +5.49% increase in the last 24 hours.
Share
Content
Introduction: ACE's Market Position and Investment Value
I. ACE Price History Review and Market Status
II. Core Factors Influencing ACE's Future Price
III. 2025-2030 ACE Price Forecast
IV. ACE Professional Investment Strategy and Risk Management
V. ACE Potential Risks and Challenges
VI. Conclusion and Action Recommendations
FAQ
How to Buy Cryptocurrency


Trending Cryptocurrencies


Is Sidus (SIDUS) a good investment?: Analyzing the Potential and Risks of this Gaming Cryptocurrency

2025 UNA Price Prediction: Bullish Trends and Key Factors Shaping the Token's Future Value
MAVIA vs CHZ: A Comparative Analysis of Two Leading Blockchain Gaming Ecosystems
GOG vs LINK: The Battle for Digital Distribution Supremacy in the Gaming Industry

Is NEXPACE (NXPC) a good investment?: Analyzing the Potential and Risks of this Emerging Cryptocurrency

Is Decimated (DIO) a good investment?: Analyzing the potential and risks of this emerging cryptocurrency
Exploring the World of Web3 and Blockchain Technology

Understanding GameFi: The Future of Gaming Platforms

PEPE Coin Analysis and Future Prospects

Understanding the PEPE Project ($PEPE): A Guide to This Innovative Cryptocurrency

Convert USDT to INR Effortlessly | Live Exchange Rates