2025 ACM Price Prediction: Expert Analysis and Market Forecast for the Year Ahead


Introduction: Market Position and Investment Value of ACM
AC Milan Fan Token (ACM) is a functional token that empowers AC Milan football club fans to participate in club governance decisions through the Socios platform. Since its launch in 2021, ACM has established itself as a unique bridge between sports entertainment and blockchain technology. As of December 2025, ACM has achieved a market capitalization of approximately USD 10.47 million, with a circulating supply of 12.22 million tokens, currently trading at USD 0.5258. This innovative "fan engagement token" is playing an increasingly important role in revolutionizing how sports fans interact with their favorite clubs through decentralized governance and reward mechanisms.
This article will provide a comprehensive analysis of ACM's price dynamics and market trends, combining historical price patterns, market supply and demand dynamics, ecosystem development, and macroeconomic factors to deliver professional price forecasts and practical investment strategies for 2025-2030.
I. ACM Price History Review and Current Market Status
ACM Historical Price Evolution Trajectory
- February 24, 2021: ACM reached its all-time high of $23.20, marking the peak of initial market enthusiasm following the token's launch on March 2, 2021.
- October 11, 2025: ACM hit its all-time low of $0.435368, reflecting sustained downward pressure over the extended market cycle.
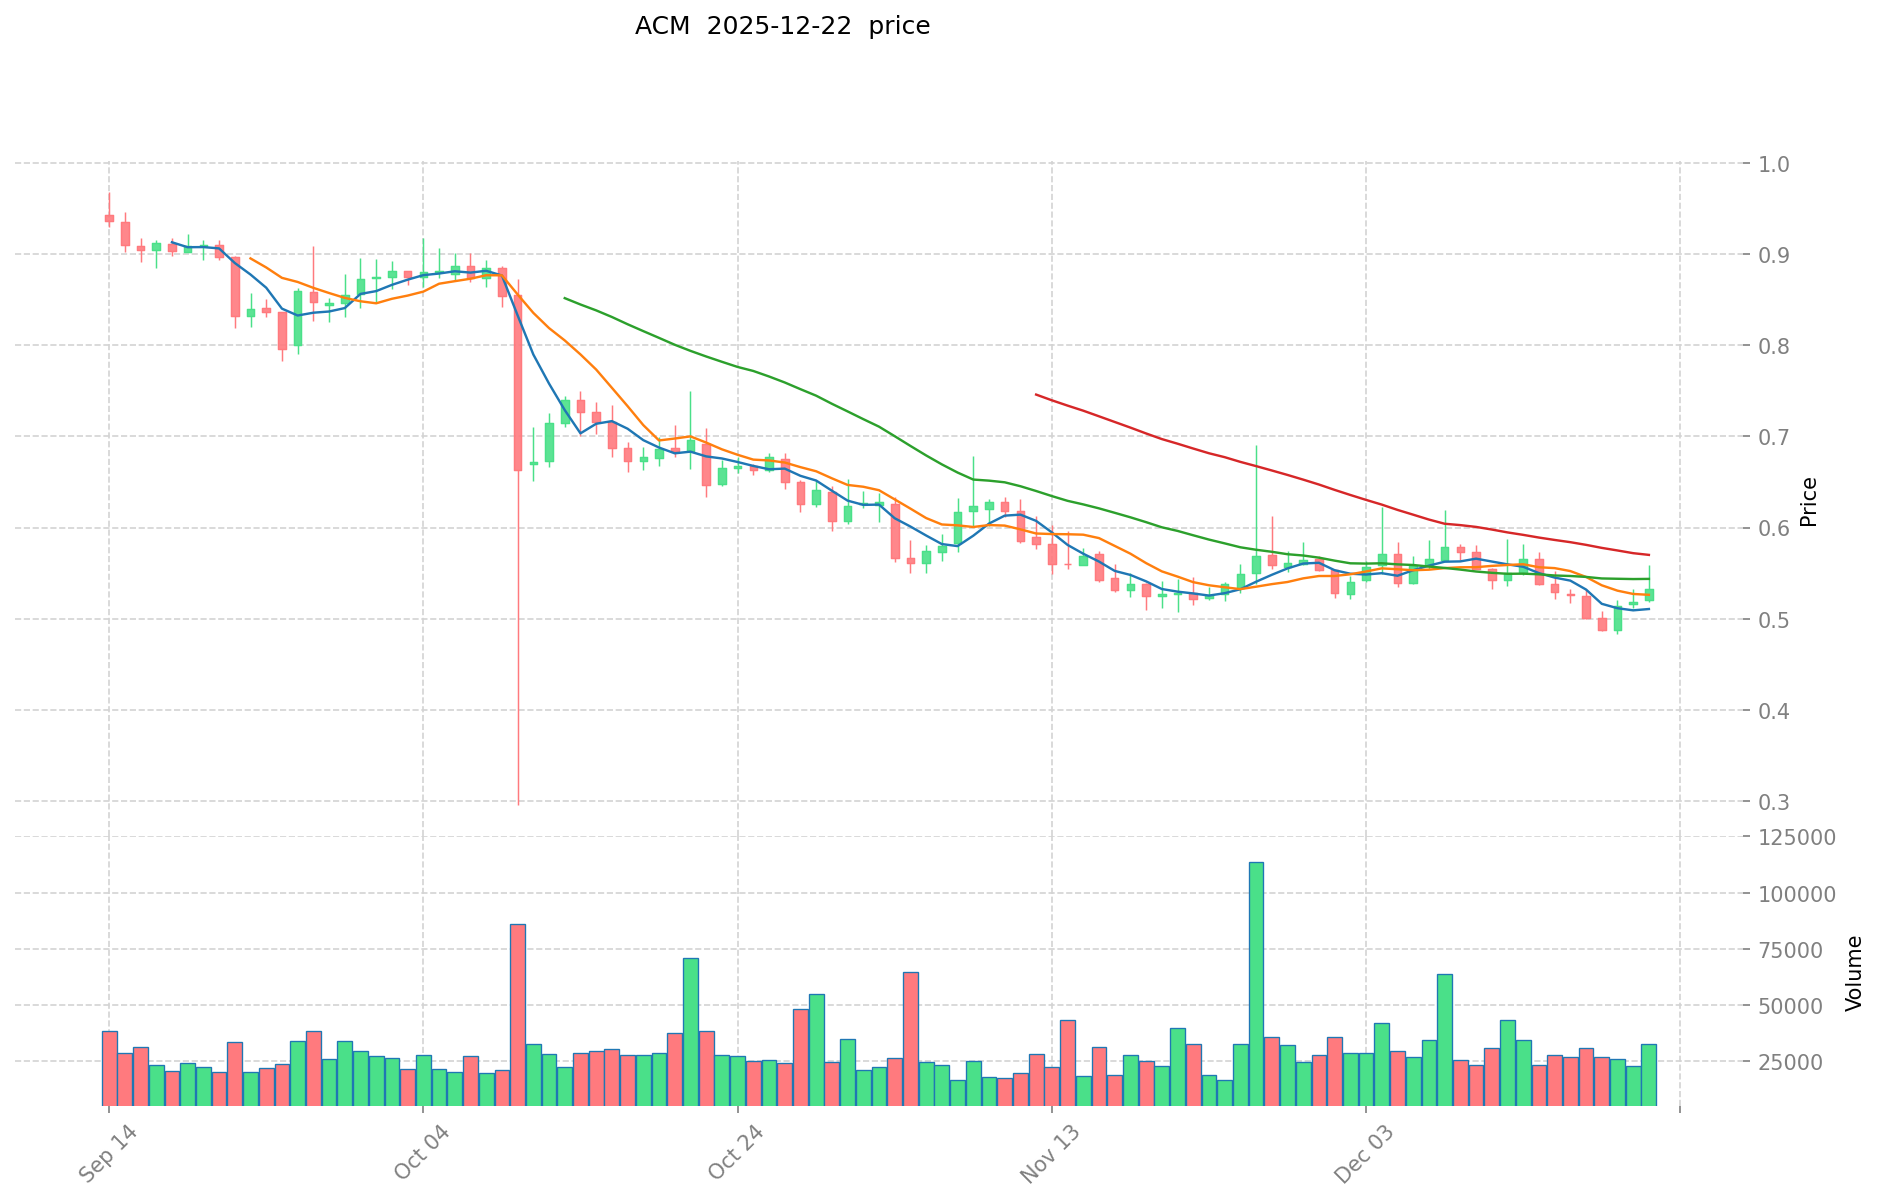
- December 23, 2025: ACM is currently trading at $0.5258, representing a recovery from recent lows but still down significantly from historical peaks.
ACM Current Market Situation
As of December 23, 2025, ACM is trading at $0.5258 with a 24-hour trading volume of $12,079.57. The token exhibits short-term weakness, declining 1.62% over the past 24 hours and 0.19% in the last hour. However, it shows slight positive momentum over the 30-day period with a 0.61% increase.
The token's market capitalization stands at approximately $6.42 million based on circulating supply, with a fully diluted valuation of $10.47 million. The circulating supply comprises 12,219,108 tokens out of a maximum supply of 19,920,000 ACM, representing a circulation ratio of 61.34%.
ACM maintains a market ranking of #1398 among all cryptocurrencies, with a market dominance of 0.00032%. The token currently has 8,417 holders. From a longer-term perspective, ACM has experienced substantial depreciation, declining 68.2% over the past year, reflecting the challenging conditions in the sports and entertainment token sector.
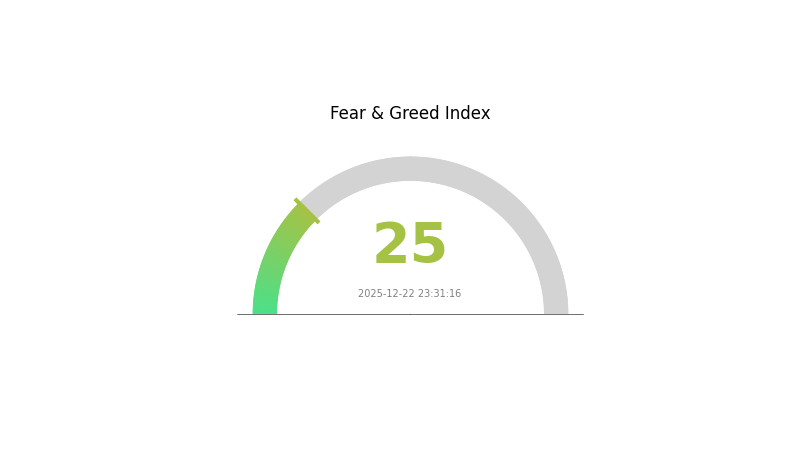
Market sentiment data indicates an "Extreme Fear" environment (VIX reading of 25 as of December 22, 2025), which typically correlates with increased market volatility and risk aversion among investors.
Click to view current ACM market price
ACM 市场情绪指标
2025-12-22 恐惧与贪婪指数:25(Extreme Fear)
Click to view current Fear & Greed Index
The cryptocurrency market is currently experiencing extreme fear, with the Fear and Greed Index at 25. This indicates widespread investor anxiety and pessimistic sentiment across the market. During such periods, risk aversion is heightened and market volatility tends to increase. However, extreme fear often presents contrarian opportunities for long-term investors. Those with higher risk tolerance may consider cautiously accumulating positions at depressed prices. Monitor key support levels closely and ensure proper risk management. Market sentiment can shift rapidly, so stay informed through Gate.com's real-time market data and analysis tools to make well-informed investment decisions.
ACM Holdings Distribution
The address holdings distribution map illustrates the concentration of token ownership across blockchain addresses, revealing the degree of decentralization and potential market influence wielded by major stakeholders. This metric is critical for assessing whether token supply is widely dispersed or concentrated among a limited number of holders, which directly impacts market dynamics, liquidity, and vulnerability to coordinated actions.
ACM exhibits pronounced concentration risk, with the top two addresses commanding 80.46% of total supply—8,326.05K tokens (41.80%) and 7,700.89K tokens (38.66%) respectively. This extreme bifurcation indicates that the majority of circulating ACM tokens are held by just two entities, while the remaining token supply is fragmented across thousands of addresses. The third-largest holder controls only 4.61%, representing a significant drop-off that underscores the dominance of the two leading addresses. This distribution pattern suggests a highly centralized ownership structure where decision-making power and potential market influence are concentrated among a minimal number of stakeholders.
The implications of such concentrated holdings are multifaceted. High concentration levels typically amplify price volatility risk, as large holder positions can materially influence market movements through coordinated or strategic token movements. The current distribution raises concerns regarding true decentralization, as meaningful governance or price discovery mechanisms become compromised when a supermajority of tokens rest with two addresses. Furthermore, while the remaining 9.53% held across other addresses provides some distribution diversification, it remains insufficient to counterbalance the overwhelming concentration at the apex. The structural fragility evident in this distribution pattern suggests that ACM's on-chain stability is significantly dependent on the actions and intentions of its two dominant holders.
Click to view current ACM Holdings Distribution

| Top | Address | Holding Qty | Holding (%) |
|---|---|---|---|
| 1 | 0xF977...41aceC | 8326.05K | 41.80% |
| 2 | 0x6F45...41a33D | 7700.89K | 38.66% |
| 3 | 0xc80A...e92416 | 919.03K | 4.61% |
| 4 | 0x8791...988062 | 613.12K | 3.08% |
| 5 | 0x76eC...78Fbd3 | 461.54K | 2.32% |
| - | Others | 1899.37K | 9.53% |
II. Core Factors Affecting ACM's Future Price
Macroeconomic Environment
-
Monetary Policy Impact: Monetary policy changes will significantly influence ACM price movements. U.S. Treasury performance and yield rate fluctuations play a prominent role in global capital markets. The Federal Reserve is expected to take fewer rate cuts than market expectations, with rates potentially declining to 3.75% by the end of 2026, compared to market consensus expectations of 3.0%.
-
Geopolitical Factors: Financial, regulatory, and political events can trigger ACM price volatility. Geopolitical uncertainties and trade policy changes create market sentiment shifts that directly impact pricing.
-
Market Continuity: Price and volume changes are crucial factors affecting actual market expectations. The sustainability of market trends plays a key role in determining future price direction.
Three、2025-2030 ACM Price Forecast
2025 Outlook
- Conservative Forecast: $0.41-$0.53
- Neutral Forecast: $0.53-$0.72
- Optimistic Forecast: $0.72+ (requires sustained market momentum and positive ecosystem developments)
2026-2028 Mid-term Outlook
- Market Phase Expectation: Gradual recovery and consolidation phase with increasing adoption momentum
- Price Range Forecast:
- 2026: $0.52-$0.86 (18% potential upside)
- 2027: $0.60-$0.85 (40% cumulative growth potential)
- 2028: $0.73-$0.95 (51% cumulative growth potential)
- Key Catalysts: Expanding use cases, increased institutional interest, network upgrades, and improving market sentiment
2029-2030 Long-term Outlook
- Base Scenario: $0.45-$0.90 (steady growth with moderate adoption)
- Optimistic Scenario: $0.90-$0.99 (strong ecosystem expansion and market penetration)
- Transformational Scenario: $0.99+ (breakthrough technological implementations and mainstream integration)
- 2030-12-23: ACM targets $0.88-$0.99 (consolidation within upper-middle range with growth potential)
| 年份 | 预测最高价 | 预测平均价格 | 预测最低价 | 涨跌幅 |
|---|---|---|---|---|
| 2025 | 0.71672 | 0.527 | 0.41106 | 0 |
| 2026 | 0.85817 | 0.62186 | 0.52236 | 18 |
| 2027 | 0.85102 | 0.74001 | 0.59941 | 40 |
| 2028 | 0.94666 | 0.79551 | 0.73187 | 51 |
| 2029 | 0.89722 | 0.87109 | 0.45297 | 65 |
| 2030 | 0.99025 | 0.88415 | 0.45976 | 68 |
AC Milan Fan Token (ACM) Professional Investment Strategy and Risk Management Report
IV. ACM Professional Investment Strategy and Risk Management
ACM Investment Methodology
(1) Long-term Holding Strategy
-
Target Audience: Sports fans and AC Milan supporters seeking governance participation; long-term believers in fan tokenization ecosystems; investors with high risk tolerance for emerging sports-entertainment blockchain projects.
-
Operational Recommendations:
- Accumulate ACM during market downturns to average your entry cost, particularly when price volatility reaches historical lows.
- Participate actively in "fan decision" voting on the Socios platform to maximize the governance utility of your holdings.
- Lock tokens for NFT reward generation once staking mechanisms are fully enabled on the Chiliz Chain network.
(2) Active Trading Strategy
-
Price Analysis Framework:
- 24-Hour Price Movement: Monitor intraday volatility; current 24-hour change of -1.62% suggests consolidation phases.
- 7-Day and 30-Day Trends: Track weekly (-0.44%) and monthly (+0.61%) changes to identify medium-term support and resistance levels.
- Historical Performance Context: Note the 1-year decline of -68.2% against all-time high of $23.2 (reached February 24, 2021) and recent all-time low of $0.435368 (October 11, 2025).
-
Wave Trading Key Points:
- Execute buy orders near the 24-hour low ($0.5196) when volume increases above the daily average of $12,079.57.
- Set take-profit targets at psychological resistance levels or 5-8% gains given the token's current low volatility environment.
- Exit positions before major governance voting events that could create unpredictable price swings.
ACM Risk Management Framework
(1) Asset Allocation Principles
- Conservative Investors: 1-2% of total crypto portfolio allocation; prioritize governance participation over capital appreciation.
- Active Investors: 2-5% of portfolio; implement dollar-cost averaging over 6-12 months.
- Professional Investors: 5-10% of portfolio; combine long-term staking with tactical swing trading around Socios platform announcements.
(2) Risk Hedging Solutions
- Governance Risk Mitigation: Diversify voting participation across multiple fan tokens from different sports clubs to reduce single-project dependency.
- Liquidity Management: Maintain 40% of ACM holdings in easily liquidated form on Gate.com; lock 60% for extended staking periods to optimize NFT reward generation.
(3) Secure Storage Solutions
- Hot Wallet Strategy: Use Gate.com's integrated Web3 wallet for frequent governance participation and reward collection on Socios platform.
- Cold Storage Approach: Transfer long-term holdings to self-custody solutions for amounts exceeding $10,000 equivalent value to minimize exchange counterparty risk.
- Security Critical Points:
- Never share private keys or recovery phrases; Socios platform interactions should only occur through verified official channels.
- Enable two-factor authentication on all Gate.com accounts managing ACM tokens.
- Verify smart contract addresses on Chiliz Chain explorer (scan.chiliz.com) before interacting with governance voting mechanisms.
V. ACM Potential Risks and Challenges
ACM Market Risk
-
Extreme Liquidity Volatility: With only 12,219,108 tokens in circulation against a $6.42M market cap, the token exhibits low trading volume ($12,079.57 in 24 hours), creating significant slippage risk for larger position entries or exits.
-
Severe Historical Depreciation: The -68.2% decline over 12 months and 97.7% loss from all-time high indicates sustained selling pressure and potential loss of retail investor confidence in the fan token model.
-
Execution Risk: Current market cap of $10.47M (fully diluted valuation) is vulnerable to sudden price collapses if AC Milan governance initiatives fail or fan engagement metrics decline.
ACM Regulatory Risk
-
Jurisdiction Uncertainty: Fan tokens operate in a gray regulatory zone in most jurisdictions; classification as securities in major markets could trigger delisting or forced compliance measures affecting token utility.
-
Sports League Compliance: Changes in UEFA, Serie A, or AC Milan's internal policies regarding fan tokens could restrict voting authority or eliminate governance features, fundamentally altering ACM's value proposition.
-
Cross-Border Restrictions: Several countries maintain restrictions on tokenized voting rights and fan participation mechanisms, potentially limiting the addressable market for ACM utility expansion.
ACM Technical Risk
-
Chiliz Chain Dependency: ACM's functionality is entirely dependent on Chiliz Chain's stability and security; vulnerabilities in the Proof-of-Authority sidechain consensus could compromise token transfers or governance voting.
-
Smart Contract Vulnerability: Bugs in "fan decision" voting smart contracts could lead to governance manipulation, token lock-ups, or loss of NFT rewards, with no guarantee of recovery mechanisms.
-
Scalability Constraints: Current 24-hour volume of $12,079.57 suggests the Socios platform may struggle to handle increased transaction volume if adoption accelerates, leading to network congestion and degraded user experience.
VI. Conclusion and Action Recommendations
ACM Investment Value Assessment
AC Milan Fan Token (ACM) represents a speculative bet on the long-term viability of fan tokenization in professional sports. The token has experienced catastrophic value erosion (-68.2% annually, -97.7% from peak), signaling either market rejection of the fan token model or delayed adoption curves. However, the persistent ecosystem development through Socios platform governance, NFT reward mechanisms, and ongoing AC Milan fan engagement suggests potential runway for recovery. Current valuation near all-time lows may present accumulation opportunities for high-risk investors seeking exposure to the intersection of sports, blockchain, and community governance.
ACM Investment Recommendations
✅ Beginners: Allocate maximum 1% of cryptocurrency holdings; focus on understanding governance mechanics through Socios participation before considering larger investments. Use dollar-cost averaging over 6-month periods.
✅ Experienced Investors: Consider 2-5% portfolio allocation contingent on broader confidence in sports fan tokenization trends; implement technical analysis-based swing trading around key support levels ($0.50, $0.55); actively participate in governance votes to maximize utility value.
✅ Institutional Investors: Evaluate ACM as a niche alternative asset class exposure to sports-entertainment blockchain infrastructure; conduct detailed due diligence on Chiliz Chain economic models and Socios platform adoption metrics before committing capital.
ACM Trading Participation Methods
-
Gate.com Spot Trading: Direct ACM/USDT pairs with real-time order book depth and integrated portfolio tracking; use limit orders to control entry prices precisely.
-
Socios Platform Integration: Hold ACM directly in verified wallets for governance participation, accessing time-limited voting events with exclusive NFT rewards for active voters.
-
Long-term Staking Mechanisms: Once activated, pledge ACM holdings through Socios smart contracts to earn non-fungible token rewards while maintaining governance rights.
Cryptocurrency investment carries extreme risk. This report is not investment advice. Investors must make decisions based on personal risk tolerance and should consult qualified financial advisors. Never invest capital you cannot afford to lose completely. Past performance does not guarantee future results.
FAQ
Is ACM a buy sell or hold?
ACM demonstrates strong upside potential based on current market dynamics and technical indicators. We recommend a 'Strong Buy' position for investors with moderate to high risk tolerance seeking growth opportunities in the crypto market.
What is the price prediction for ACM stock?
Based on current market analysis, ACM stock is forecasted at $103.77 for tomorrow. For 2025, ACM is expected to trade between $96.74 and $104.35. Long-term predictions for 2030 suggest a range of $119.69 to $181.75.
What are the future projections for ACM?
ACM is projected to increase by 5% in the next 30 days, potentially reaching $0.5186. This projection is based on current market trends and technical analysis of trading volume and price movements.
Share
Content
Introduction: Market Position and Investment Value of ACM
I. ACM Price History Review and Current Market Status
II. Core Factors Affecting ACM's Future Price
Three、2025-2030 ACM Price Forecast
IV. ACM Professional Investment Strategy and Risk Management
V. ACM Potential Risks and Challenges
VI. Conclusion and Action Recommendations
FAQ
How to Buy Cryptocurrency


Trending Cryptocurrencies


2025 PSG Price Prediction: Expert Analysis and Market Outlook for the Upcoming Year

What Does 'Stonks' Mean ?
Aergo Price Analysis: 112% Surge in 90 Days - What's Next for 2025?

Sahara AI (SAHARA) Price Analysis: Recent Volatility Trends and Market Correlations

why is crypto crashing and will it recover ?

How to convert SOL to USD: Real-time Solana price calculator

What are the major security risks and smart contract vulnerabilities facing HBAR in 2025?

What is SHIB token holdings and fund flow: exchange net inflows, concentration, staking rate, and on-chain lock-up analysis?
What is Kaspa (KAS) vs Bitcoin: Competitive Analysis of Performance, Market Cap, and User Base in 2025?

How to Use On-Chain Data Analysis to Identify BEAT Token Whale Movements and Trading Opportunities

Gate Fun: The No-Code Token Launch Platform for Web3 Creators and Investors