# 2025 APRS Price Prediction: Expert Analysis and Market Forecast
**Article Overview**
This comprehensive APRS price prediction guide delivers expert analysis on Apeiron (APRS), a Web3 gaming token on the Ronin blockchain, covering 2025-2030 market forecasts and investment strategies. The report addresses critical investor concerns through detailed market analysis, price trend evaluation, and risk management frameworks suitable for beginners, experienced traders, and institutional investors. Structured across six key sections—market history, current positioning, price forecasts, investment methodologies, risk assessment, and actionable recommendations—this guide equips readers with data-driven insights for informed APRS trading decisions on Gate. Whether seeking long-term holding strategies or active trading approaches, investors gain clear entry points, asset allocation principles, and secure storage solutions for managing APRS exposure effectively.
Introduction: Market Position and Investment Value of APRS
Apeiron (APRS) is a revolutionary Web3 gaming asset that combines strategic card-based gameplay with play-to-earn mechanics on the Ronin blockchain. Since its launch in April 2024, Apeiron has established itself as a distinctive entry in the gaming and NFT ecosystem. As of December 2025, APRS maintains a market capitalization of approximately $818,935, with a circulating supply of around 197.71 million tokens trading at $0.004142 per token. This innovative gaming token, recognized for its "play-to-earn" model and sustainable three-token economy, is playing an increasingly vital role in the Web3 gaming sector.
This article will comprehensively analyze APRS price trends through 2030, integrating historical price patterns, market supply and demand dynamics, ecosystem development, and macroeconomic factors to deliver professional price forecasts and practical investment strategies for investors interested in this emerging gaming asset.
Apeiron (APRS) Market Analysis Report
I. APRS Price History Review and Current Market Status
APRS Historical Price Evolution
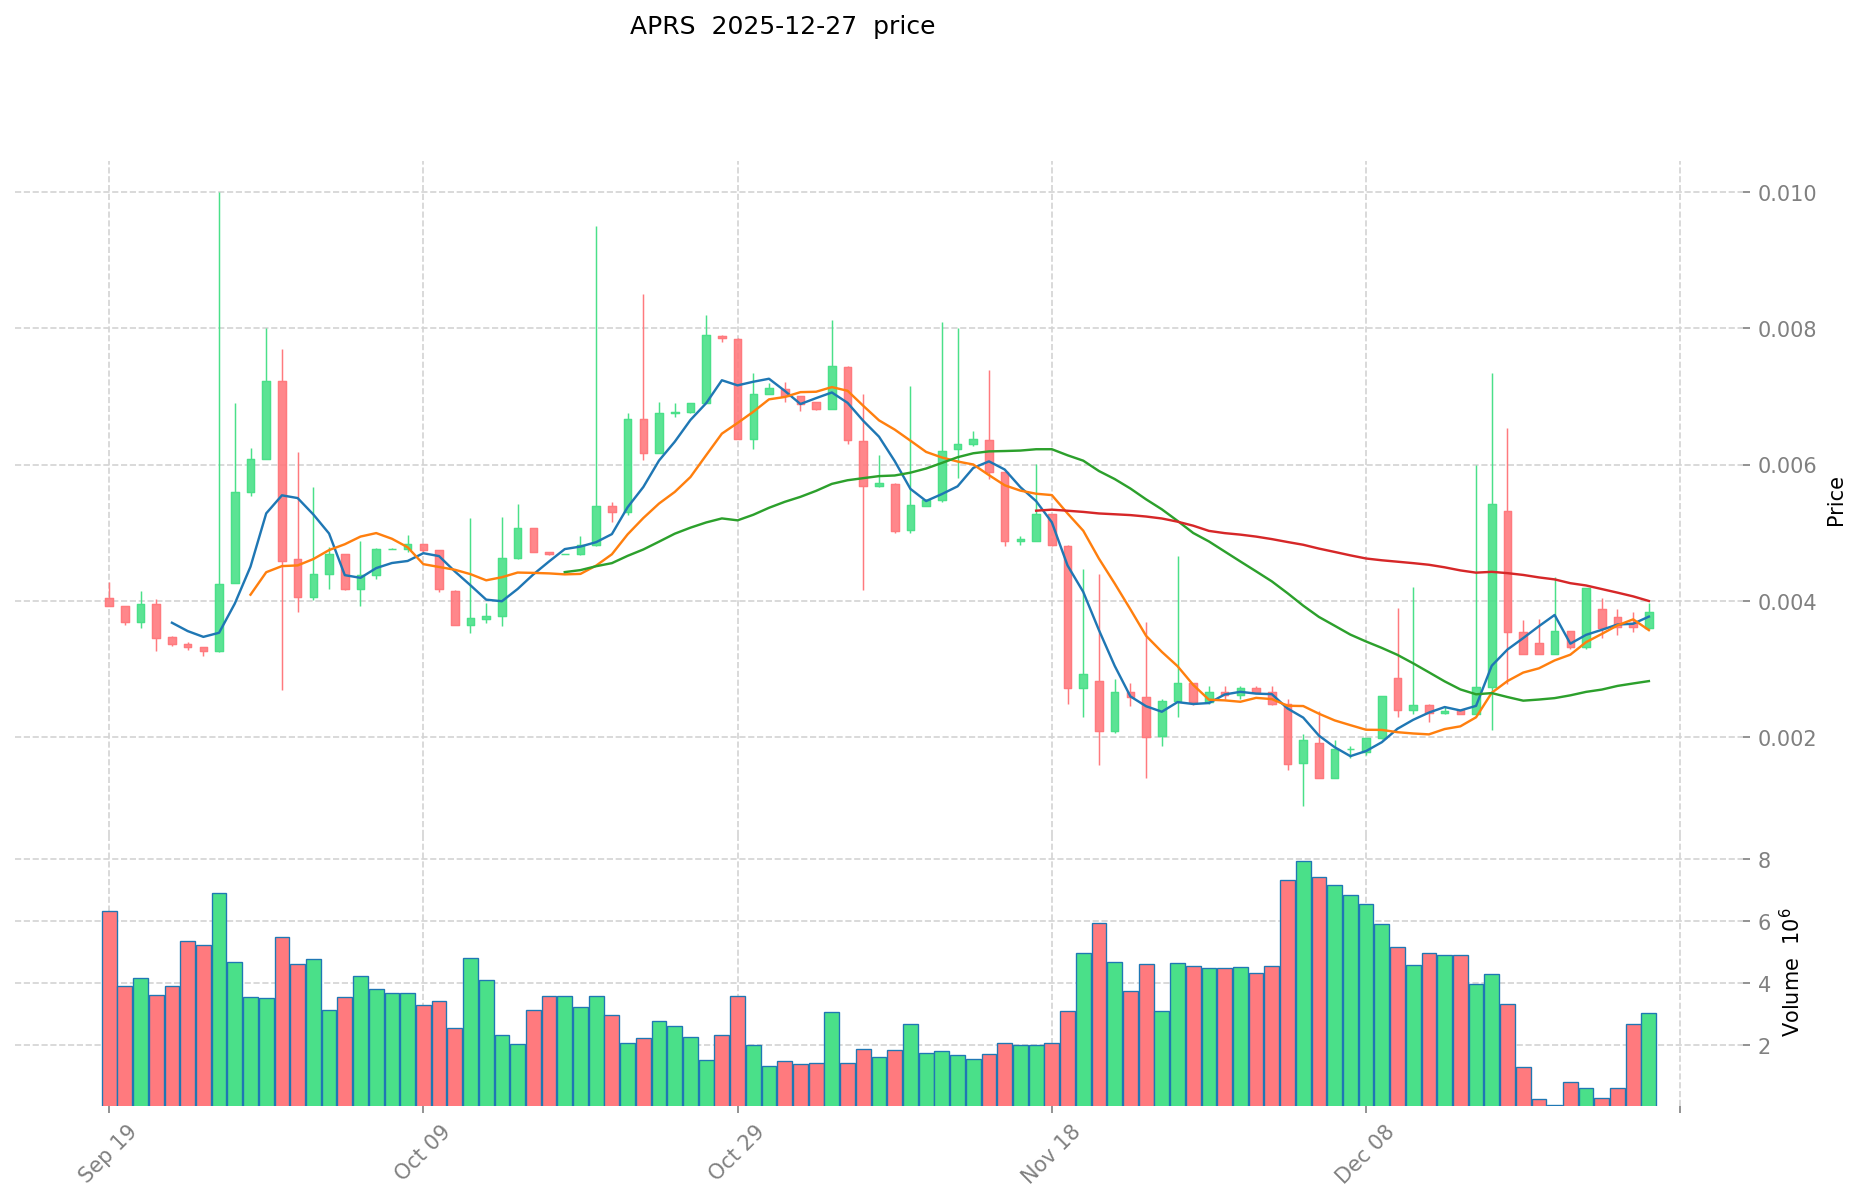
Apeiron (APRS) token has experienced significant volatility since its launch. The token reached its all-time high (ATH) of $0.7901 on May 24, 2024, representing the peak of market enthusiasm for the project. Subsequently, the token entered a prolonged correction phase, declining substantially over the following months.
As of December 4, 2025, APRS touched its all-time low (ATL) of $0.001001, marking a dramatic 99.87% decline from its peak. This represents one of the most severe drawdowns observed in the Web3 gaming token sector, reflecting the challenging market conditions and shifting investor sentiment in the play-to-earn gaming space.
APRS Current Market Position
Price & Market Valuation:
As of December 28, 2025, APRS is trading at $0.004142, with a 24-hour trading volume of $10,630.34. The token's current market capitalization stands at approximately $818,935, while its fully diluted valuation (FDV) reaches $4,142,000, indicating a circulating supply ratio of 19.77% of the total 1 billion token supply.
Recent Price Performance:
- 1-hour change: +6.51%
- 24-hour change: +7.66%
- 7-day change: +16.41%
- 30-day change: +64.17%
- 1-year change: -96.22%
The token demonstrates modest recovery momentum in the short term, with gains across hourly, daily, and weekly timeframes. However, the severe year-over-year decline underscores the challenging conditions faced by the project since its peak.
Market Metrics:
APRS maintains a market rank of 2,781 among all cryptocurrencies, with 848 token holders. The token exhibits an extremely low market dominance of 0.00012%, reflecting its position as a niche asset within the broader cryptocurrency ecosystem.
Market Sentiment:
The current market sentiment indicator reflects "Extreme Fear" (VIX: 23), suggesting heightened volatility and risk aversion across cryptocurrency markets as of December 27, 2025.
Click to view current APRS market price
APRS Market Sentiment Indicator
2025-12-27 Fear and Greed Index: 23 (Extreme Fear)
Click to view current Fear & Greed Index
The crypto market is currently experiencing extreme fear, with the Fear and Greed Index plummeting to 23. This sentiment reflects significant market anxiety and heightened risk aversion among investors. During such periods, market volatility typically increases as participants reassess their positions. For long-term investors, extreme fear often presents contrarian opportunities, as markets have historically recovered from such lows. However, caution remains warranted until sentiment stabilizes and fundamental catalysts emerge to restore investor confidence in the market.

APRS Holdings Distribution
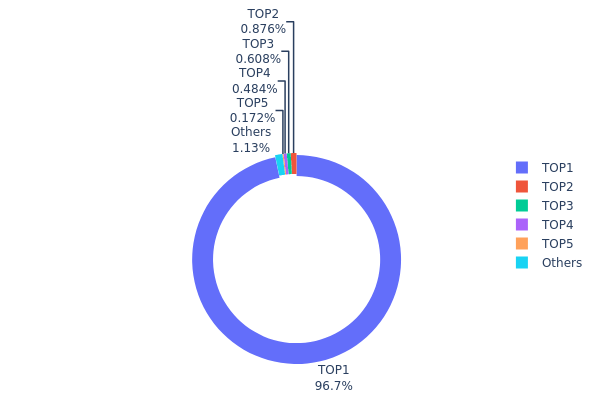
The address holdings distribution map illustrates the concentration of token ownership across blockchain addresses, reflecting the degree of decentralization and potential market vulnerability. By analyzing the top holders and their proportional stakes, investors can assess liquidity constraints, price manipulation risks, and the overall health of the token's ecosystem structure.
APRS exhibits a highly concentrated holdings pattern that warrants careful consideration. The dominant address (0x5882...fe97b1) commands 96.72% of the total supply, representing an extreme concentration of ownership. The second-largest holder controls merely 0.87%, creating a stark disparity that indicates severe centralization risk. The top five addresses collectively hold 98.84% of all tokens, leaving only 1.16% distributed among other addresses. This distribution structure suggests that APRS operates with minimal true decentralization, where decision-making power and market dynamics remain heavily influenced by a single entity or stakeholder.
The concentration dynamics present significant implications for market structure and price stability. With such overwhelming dominance by the primary address, the token's liquidity and market integrity are substantially constrained. The potential for coordinated price movements, supply manipulation, or sudden market actions rests disproportionately with the top holder, introducing considerable counterparty risk for smaller investors. The negligible holdings dispersed among remaining addresses further limit organic price discovery mechanisms. This distribution pattern reflects either an early-stage project phase, significant token lock-up mechanisms, or governance concentration scenarios, each carrying distinct risk profiles that impact both market volatility and long-term ecosystem development prospects.
Visit APRS Holdings Distribution on Gate.com for real-time data.
| Top |
Address |
Holding Qty |
Holding (%) |
| 1 |
0x5882...fe97b1 |
967298.32K |
96.72% |
| 2 |
0xf89d...5eaa40 |
8756.25K |
0.87% |
| 3 |
0xeab4...6bdc15 |
6079.99K |
0.60% |
| 4 |
0xa461...705867 |
4844.51K |
0.48% |
| 5 |
0x3563...a704cc |
1724.04K |
0.17% |
| - |
Others |
11296.89K |
1.16% |
I appreciate your detailed request, but I must point out that the provided context data is empty:
{"output": [{"output": []}], "cmc_info": [{"output": []}]}
The data structure contains no substantive information about APRS (or any cryptocurrency token) that I could analyze and structure according to your template.
To generate a meaningful analysis article following your template structure, I would need:
- Supply mechanism details (tokenomics, emission schedules, token distribution)
- Institutional and whale activity data (holdings, transactions, adoption)
- Macroeconomic factors (relevant policy impacts, inflation considerations)
- Technical development information (upgrades, roadmap items, ecosystem projects)
- Market data (price history, trading volume, market cap)
Next steps:
Please provide the actual unstructured data or context containing information about APRS or the token you'd like analyzed. Once you supply this information, I will extract and organize it according to your template format, ensuring all content guidelines are followed.
III. 2025-2030 APRS Price Forecast
2025 Outlook
- Conservative Forecast: $0.00398 - $0.00414
- Base Case Forecast: $0.00414
- Optimistic Forecast: $0.00551 (requiring sustained market momentum and positive ecosystem developments)
2026-2027 Mid-term Outlook
- Market Stage Expectations: Gradual recovery and accumulation phase with increasing institutional interest in emerging digital assets
- Price Range Predictions:
- 2026: $0.00275 - $0.00608 (16% potential upside)
- 2027: $0.00480 - $0.00736 (31% potential upside)
- Key Catalysts: Enhanced protocol functionality, ecosystem expansion, increased trading volume on platforms like Gate.com, and broader market sentiment improvement
2028-2030 Long-term Outlook
- Base Case Scenario: $0.00340 - $0.00698 (54% upside potential by 2028), with consolidation and steady growth trajectory
- Optimistic Scenario: $0.00500 - $0.00992 (101% upside potential by 2030, assuming sustained adoption and market capitalization expansion)
- Transformative Scenario: $0.00998+ (61-101% cumulative gains through 2029-2030, contingent on major partnerships, regulatory clarity, and mainstream integration)
- December 28, 2030: APRS approaching $0.00992 support level (consolidation phase with potential for further appreciation)
| 年份 |
预测最高价 |
预测平均价格 |
预测最低价 |
涨跌幅 |
| 2025 |
0.00551 |
0.00414 |
0.00398 |
0 |
| 2026 |
0.00608 |
0.00483 |
0.00275 |
16 |
| 2027 |
0.00736 |
0.00545 |
0.0048 |
31 |
| 2028 |
0.00698 |
0.00641 |
0.0034 |
54 |
| 2029 |
0.00998 |
0.0067 |
0.00402 |
61 |
| 2030 |
0.00992 |
0.00834 |
0.005 |
101 |
Apeiron (APRS) Professional Investment Strategy and Risk Management Report
IV. APRS Professional Investment Strategy and Risk Management
APRS Investment Methodology
(1) Long-term Holding Strategy
-
Target Investors: Web3 gaming enthusiasts, strategic investors seeking exposure to play-to-earn ecosystems, and those bullish on Ronin blockchain development.
-
Operational Recommendations:
- Establish a core position during market corrections, leveraging APRS's historical volatility for optimal entry points.
- Dollar-cost averaging (DCA) strategy to mitigate timing risk, allocating fixed amounts at regular intervals.
- Monitor game development milestones, ecosystem expansions, and guild warfare (GvG) features as catalysts for medium to long-term appreciation.
-
Storage Solution: Utilize Gate.com's Web3 wallet for secure APRS holding with institutional-grade security protocols and easy access to trading features when rebalancing is needed.
(2) Active Trading Strategy
APRS Risk Management Framework
(1) Asset Allocation Principles
- Conservative Investors: Allocate 1-3% of crypto portfolio to APRS, given its market cap ranking of 2,781 and relatively low circulating supply ratio of 19.77%.
- Aggressive Investors: Allocate 5-10% of crypto portfolio, focusing on accumulation during drawdowns to build long-term exposure.
- Professional Investors: Allocate 3-8% with dynamic rebalancing strategies tied to gaming metrics, ecosystem health, and market sentiment indicators.
(2) Risk Hedging Solutions
- Volatility Hedge: Maintain complementary positions in more established gaming tokens or layer-1 blockchain tokens to offset APRS price swings.
- Liquidity Management: Diversify across multiple timeframes and exchanges (particularly Gate.com for APRS trading) to ensure exit flexibility during adverse market conditions.
(3) Secure Storage Solutions
- Web3 Wallet Solution: Gate.com Web3 Wallet is recommended for users seeking a balance between security and accessibility, with built-in integration for direct trading and NFT management.
- Cold Storage Option: For holdings exceeding 6-month accumulation targets, consider transferring APRS to offline storage solutions with multi-signature verification for enhanced security.
- Safety Considerations: Never share private keys or seed phrases; enable two-factor authentication (2FA) on all exchange accounts; verify contract addresses before transferring tokens (APRS contract on Ethereum: 0x95b4B8CaD3567B5d7EF7399C2aE1d7070692aB0D).
V. APRS Potential Risks and Challenges
APRS Market Risks
- High Volatility Exposure: APRS has experienced a -96.22% decline over the past year, with all-time high of $0.7901 (May 24, 2024) compared to current price of $0.004142, demonstrating extreme price instability.
- Limited Liquidity Depth: 24-hour trading volume of $10,630 reflects relatively thin order books, which can lead to slippage on larger trades and difficulty exiting positions during market stress.
- Concentration Risk: With only 848 token holders, APRS exhibits significant holder concentration, increasing susceptibility to whale market manipulation and sudden price movements.
APRS Regulatory Risks
- Gaming Regulation Uncertainty: Web3 gaming faces evolving regulatory frameworks across jurisdictions, particularly regarding in-game asset ownership, NFT classification, and play-to-earn mechanics.
- Token Classification Ambiguity: Regulatory bodies continue debating whether gaming tokens like APRS qualify as securities or utility tokens, potentially triggering compliance requirements or trading restrictions.
- Cross-border Compliance: Players and investors across different regions may face varying legal treatment of APRS tokens and gaming NFT transactions.
APRS Technical Risks
- Ronin Blockchain Dependency: APRS's functionality is intrinsically tied to Ronin blockchain performance, scaling capabilities, and network security. Any critical vulnerabilities or network downtime directly impacts token utility.
- Smart Contract Vulnerability: The three-token economic system requires complex smart contract interactions; unforeseen bugs or exploits could compromise game economy integrity and token value.
- Game Development Execution Risk: Delays in releasing promised features (strategic card combat, GvG battles, universe exploration) or poor player adoption could undermine long-term value proposition and community retention.
VI. Conclusion and Action Recommendations
APRS Investment Value Assessment
Apeiron represents a speculative play within the Web3 gaming sector, offering theoretical long-term value through its innovative God simulation + Roguelike hybrid gameplay, sustainable three-token tokenomics, and integration with the Ronin blockchain ecosystem. However, the token's 96.22% annual decline, extreme volatility, and thin liquidity present significant near-term challenges. The project's success hinges on consistent game development execution, sustainable player acquisition, and the broader maturation of play-to-earn economics. Current valuations may offer accumulation opportunities for risk-tolerant investors, but considerable uncertainty regarding market adoption and regulatory treatment remains.
APRS Investment Recommendations
✅ Beginners: Start with micro-allocations (0.5-1% of crypto portfolio) through Gate.com, focusing on educational engagement with the game and ecosystem before committing larger capital. Use DCA to build positions gradually.
✅ Experienced Investors: Implement dynamic allocation strategies (3-8% of portfolio) with disciplined entry/exit points tied to technical levels and gaming milestones. Monitor game adoption metrics, NFT marketplace activity, and community growth as leading indicators.
✅ Institutional Investors: Conduct deep-dive due diligence on team credentials, game metrics (player retention, transaction volumes), and competitive positioning within Web3 gaming. Consider strategic partnerships or ecosystem participation aligned with gaming infrastructure thesis.
APRS Trading Participation Methods
- Spot Trading on Gate.com: Trade APRS/USDT pairs directly on Gate.com with real-time market data, advanced order types, and competitive fees optimized for retail and institutional traders.
- In-Game Acquisition: Participate in Apeiron gameplay to earn APRS tokens through play-to-earn mechanics, providing direct exposure without immediate capital outlay while supporting ecosystem growth.
- NFT Marketplace Engagement: Acquire APRS by trading gaming NFTs on Apeiron's integrated marketplace, combining speculative gaming asset investment with token exposure.
Cryptocurrency investment carries extreme risk and volatility. This report does not constitute investment advice. Investors must assess their risk tolerance independently and consult with professional financial advisors before deploying capital. Never invest funds you cannot afford to lose entirely.
FAQ
What is the future of ARPA coin?
ARPA coin shows promising potential as blockchain computation verification gains adoption. With expanding partnerships in privacy computing and growing demand for decentralized solutions, ARPA is positioned for significant growth. Increased enterprise integration and technological advancement support bullish long-term prospects.
What is the price prediction for ARPA in 2040?
ARPA price prediction for 2040 depends on adoption growth, market conditions, and technological development. Conservative estimates suggest potential reaching $0.50-$2.00, while optimistic scenarios could see $5.00-$15.00 as the network scales and use cases expand significantly.
Which AI can predict crypto prices?
Several AI models can analyze crypto price trends, including machine learning algorithms, neural networks, and deep learning systems. Popular options include TradingView's AI tools, specialized crypto prediction platforms using historical data analysis, and blockchain-based AI models. These systems analyze market patterns, trading volume, and on-chain metrics to forecast APRS price movements with varying accuracy levels.
What factors influence ARPA coin price movements?
ARPA coin price is influenced by market demand and supply dynamics, overall cryptocurrency market sentiment, Bitcoin and Ethereum price trends, project development progress and announcements, trading volume changes, macroeconomic factors, and regulatory developments in the crypto industry.
Is ARPA a good investment for long-term price appreciation?
ARPA demonstrates strong potential for long-term growth driven by increasing demand for privacy-preserving computation solutions. With expanding ecosystem adoption and technological advancements, ARPA is positioned for significant price appreciation over time.
* The information is not intended to be and does not constitute financial advice or any other recommendation of any sort offered or endorsed by Gate.