2025 AT Price Prediction: Expert Analysis and Market Forecast for the Coming Year

Introduction: AT's Market Position and Investment Value
APRO Token (AT) serves as an AI-enhanced oracle powering next-generation ecosystems across Real-World Assets (RWA), artificial intelligence, prediction markets, and decentralized finance (DeFi). Since its launch in 2025, APRO has established itself as a critical infrastructure provider, delivering verified, real-time data across 1,400+ data feeds on 40+ blockchains. As of December 2025, AT has achieved a market capitalization of $91.5 million with a circulating supply of 230 million tokens, trading at approximately $0.0915 per token. This innovative oracle solution, distinguished by its commitment to transparency, scalability, and data integrity across both standard and non-standard assets, is increasingly playing a pivotal role in decentralized data infrastructure.
This comprehensive analysis examines AT's price trajectory through 2025-2030, integrating historical price patterns, market supply-demand dynamics, ecosystem development progress, and macroeconomic factors to provide investors with professional price forecasts and actionable investment strategies.
I. AT Price History Review and Current Market Status
AT Historical Price Evolution Trajectory
-
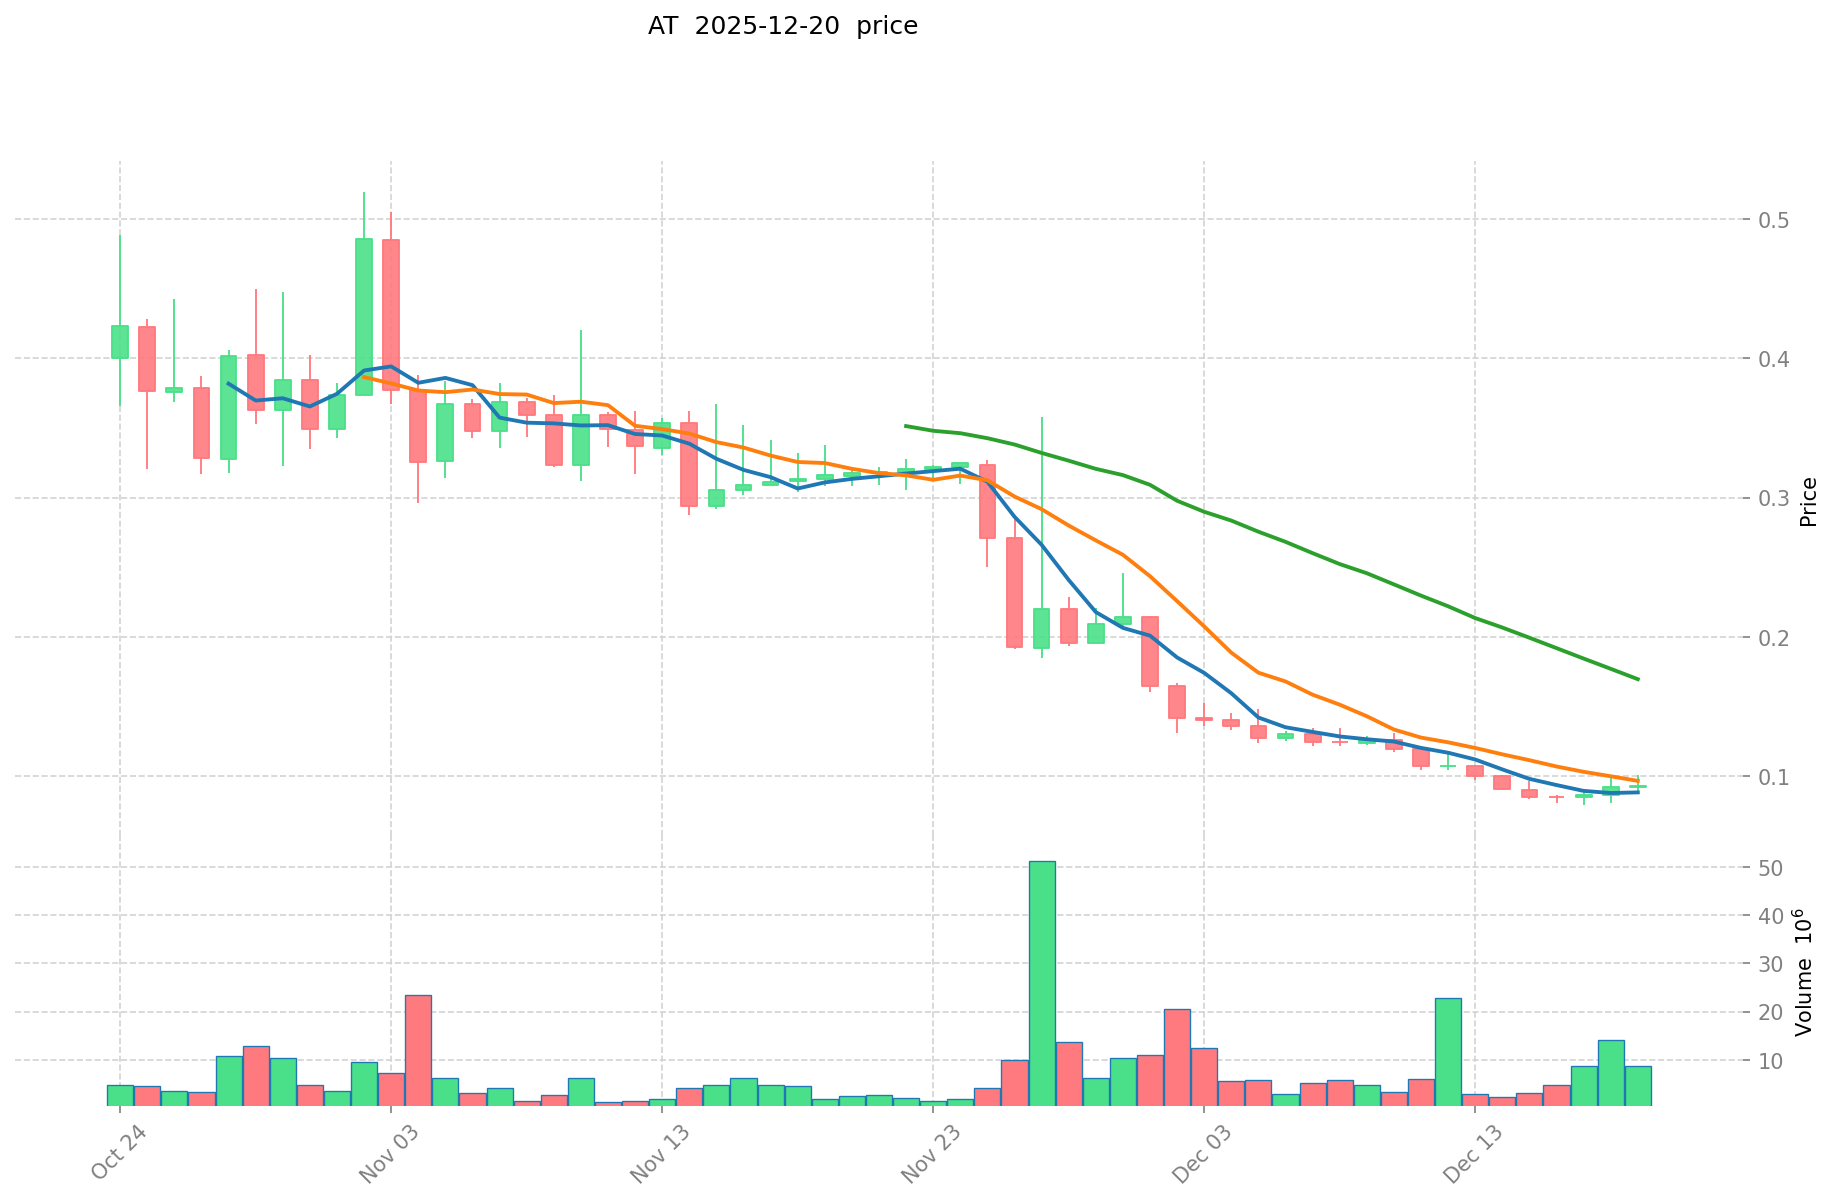
December 2025: AT reached its all-time high (ATH) of $0.5196 on November 2, 2025, reflecting strong market enthusiasm during the token's early trading period. Following this peak, the token experienced significant volatility and correction.
-
December 2025: AT declined sharply to its all-time low (ATL) of $0.07888 on December 17, 2025, representing a substantial drawdown of approximately 84.8% from the ATH, indicating heightened market pressure and profit-taking activities.
AT Current Market Status
As of December 20, 2025, AT is trading at $0.0915, reflecting a 24-hour decline of 3.55% and a 7-day decline of 8.14%. The token has experienced significant downward pressure over the past 30 days, with a monthly decline of 70.87%, demonstrating considerable bearish sentiment in the near term.
AT's market capitalization stands at $21,045,000 USD based on its circulating supply of 230,000,000 tokens, with a fully diluted valuation of $91,500,000. The token maintains a market dominance of 0.0028%, indicating a relatively modest position within the broader cryptocurrency market. With a 24-hour trading volume of $541,750.89 and presence across 20 exchanges, AT demonstrates active market participation despite current price pressures.
The 1-hour price change of -0.51% suggests continued bearish momentum in the immediate term. AT's circulating supply represents 23% of its total supply of 1,000,000,000 tokens, indicating significant potential future dilution as additional tokens enter circulation.
Click to view the current AT market price
AT Market Sentiment Indicator
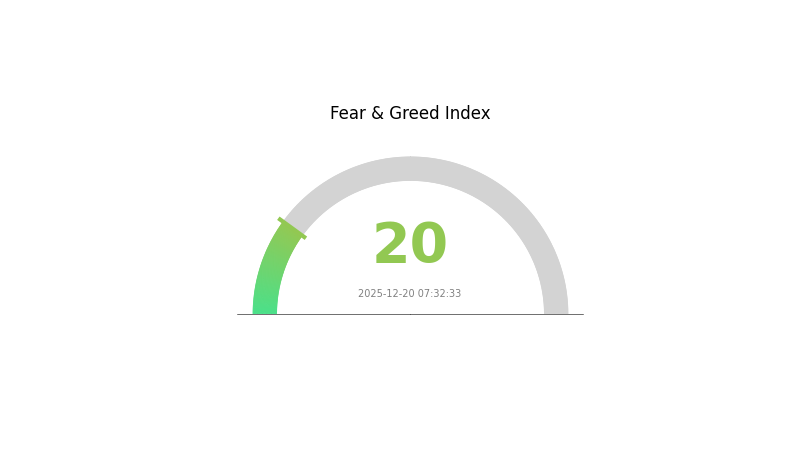
2025-12-20 Fear and Greed Index: 20 (Extreme Fear)
Click to view current Fear & Greed Index
The crypto market is experiencing extreme fear with a reading of 20, signaling a pessimistic sentiment among investors. This level typically indicates panic selling and heightened market uncertainty. Such extreme fear episodes often create contrarian opportunities for long-term investors, as assets may be oversold. However, caution remains warranted as continued negative catalysts could drive prices further down. Traders should monitor key support levels and wait for stabilization signals before entering positions. Market conditions remain highly volatile and risk-averse positioning is recommended.
AT Holdings Distribution
The address holdings distribution represents the concentration of token ownership across the blockchain network, providing critical insights into the decentralization level and potential market manipulation risks. By analyzing the top holders and their respective percentages of total supply, market participants can assess the vulnerability of the asset to price volatility caused by large-scale transactions from major stakeholders.
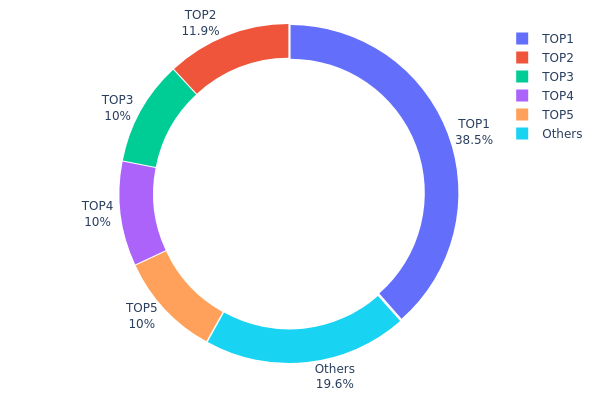
AT currently exhibits significant concentration risk, with the top five addresses controlling 80.43% of the total supply. The largest holder (0xb6f6...1da6e7) alone accounts for 38.50% of all circulating tokens, representing an exceptionally dominant position. The second-largest holder possesses 11.93%, while addresses ranked third through fifth each maintain precisely 10.00% of the supply. This structural composition indicates a highly centralized distribution pattern, where decision-making power and market influence are concentrated among a limited number of stakeholders. The remaining 19.57% dispersed among other addresses demonstrates weak retail participation and limited decentralization.
Such concentration levels pose material risks to market stability and fair price discovery. A single major holder or coordinated action among the top five addresses could potentially trigger significant price movements through large sell-offs or strategic accumulation. The predictable equal holdings of 10% among addresses three through five may suggest organized distribution or strategic allocation rather than organic market acquisition. This configuration undermines the resilience of the AT token ecosystem and raises concerns regarding true decentralization and community governance legitimacy.
Click to view current AT Holdings Distribution
| Top | Address | Holding Qty | Holding (%) |
|---|---|---|---|
| 1 | 0xb6f6...1da6e7 | 385000.12K | 38.50% |
| 2 | 0x8894...e2d4e3 | 119331.71K | 11.93% |
| 3 | 0x3763...ef9bae | 100000.00K | 10.00% |
| 4 | 0x4bf1...ae8669 | 100000.00K | 10.00% |
| 5 | 0x2ea8...cfc3cb | 100000.00K | 10.00% |
| - | Others | 195668.17K | 19.57% |
II. Core Factors Influencing AT's Future Price
Macroeconomic Environment
-
Monetary Policy Impact: Federal Reserve policy decisions will influence the US dollar, stock indices, and commodities. Core US inflation is expected to decline to 2% in the first half of 2025, supported by dollar strength and declining import prices. Changes in interest rates represent a key factor affecting AT's price movements.
-
Geopolitical Factors: Macroeconomic drivers including geopolitical shifts, demographic changes, and rising capital costs will continue to reshape global investment opportunities and risk landscapes through 2026. Trade conflicts and currency fluctuations may lead to market volatility that impacts AT's valuation.
-
Inflation Hedge Properties: In an inflationary environment, tokenized assets like AT demonstrate potential value preservation characteristics similar to traditional commodities and gold, serving as an alternative store of value for investors concerned about currency depreciation.
Three、2025-2030 AT Price Forecast
2025 Outlook
- Conservative Forecast: $0.073 - $0.09125
- Neutral Forecast: $0.09125 - $0.10038
- Optimistic Forecast: $0.10038 (requiring sustained market momentum and positive ecosystem developments)
2026-2028 Mid-term Outlook
- Market Stage Expectation: Gradual recovery and consolidation phase with incremental growth trajectory
- Price Range Forecast:
- 2026: $0.0709 - $0.10252
- 2027: $0.05454 - $0.13189
- 2028: $0.07394 - $0.15019
- Key Catalysts: Ecosystem expansion, increased adoption metrics, market sentiment recovery, and potential regulatory clarity in major jurisdictions
2029-2030 Long-term Outlook
- Base Case Scenario: $0.12621 - $0.1395 (assuming steady market development and moderate institutional interest)
- Optimistic Scenario: $0.13073 - $0.18112 (assuming accelerated platform adoption and broader market recovery)
- Transformative Scenario: $0.18112+ (under conditions of mainstream institutional adoption, significant protocol upgrades, and macroeconomic tailwinds)
- 2030-12-20: AT trading at $0.13618 average valuation (representing 48% cumulative growth from 2025 baseline)
| 年份 | 预测最高价 | 预测平均价格 | 预测最低价 | 涨跌幅 |
|---|---|---|---|---|
| 2025 | 0.10038 | 0.09125 | 0.073 | 0 |
| 2026 | 0.10252 | 0.09581 | 0.0709 | 4 |
| 2027 | 0.13189 | 0.09917 | 0.05454 | 8 |
| 2028 | 0.15019 | 0.11553 | 0.07394 | 26 |
| 2029 | 0.1395 | 0.13286 | 0.12621 | 45 |
| 2030 | 0.18112 | 0.13618 | 0.13073 | 48 |
APRO Token (AT) Investment Analysis Report
IV. AT Professional Investment Strategy and Risk Management
AT Investment Methodology
(1) Long-term Holding Strategy
- Suitable for: Investors with confidence in decentralized oracle infrastructure and institutional-grade data solutions
- Operational Recommendations:
- Accumulate AT during market downturns, particularly when prices fall below historical support levels, given the project's backing by established institutional investors like Polychain Capital and Franklin Templeton
- Dollar-cost averaging (DCA) approach to mitigate volatility, especially considering the 70.87% decline over the past 30 days
- Regular portfolio rebalancing to maintain target allocation weights
(2) Active Trading Strategy
- Technical Analysis Tools:
- Moving averages (MA): Use 20-day and 50-day moving averages to identify trend reversals and support/resistance levels
- Relative Strength Index (RSI): Monitor overbought/oversold conditions with standard 30/70 thresholds to time entry and exit points
- Wave Operation Key Points:
- Capitalize on volatility cycles created by oracle infrastructure news and ecosystem partnerships
- Monitor trading volume trends (current 24-hour volume: $541,750.89) for confirmation of price movements
AT Risk Management Framework
(1) Asset Allocation Principles
- Conservative Investors: 1-3% of total portfolio allocation
- Active Investors: 3-7% of total portfolio allocation
- Professional Investors: 7-15% of total portfolio allocation
(2) Risk Hedging Solutions
- Stablecoin pairing strategy: Maintain 40-50% of AT holdings in stablecoin reserves to capitalize on buying opportunities during price dips
- Diversification across oracle and DeFi ecosystem tokens: Reduce single-asset concentration risk by maintaining exposure to complementary decentralized infrastructure projects
(3) Secure Storage Solutions
- Hot wallet recommendation: Gate.com Web3 Wallet for frequent trading and active portfolio management with easy liquidity access
- Cold storage approach: Transfer long-term holdings to secure self-custody solutions to minimize exchange counterparty risks
- Security precautions: Enable two-factor authentication, use hardware security keys, never share private keys or recovery phrases, and regularly audit wallet permissions
V. AT Potential Risks and Challenges
AT Market Risks
- Price volatility exposure: AT has experienced extreme price fluctuations, declining 70.87% in 30 days and 8.89% annually, indicating high market sensitivity
- Liquidity concentration: With only 20 exchange listings and relatively modest 24-hour trading volume, liquidity may be insufficient for large institutional trades
- Market sentiment dependency: The oracle market remains highly speculative, with sentiment shifts rapidly reversing price trends
AT Regulatory Risks
- Data verification compliance: As an oracle providing real-world asset (RWA) and financial data across 40+ blockchains, APRO faces evolving regulatory scrutiny regarding data accuracy and financial reporting standards
- Jurisdictional uncertainty: Operating across multiple jurisdictions creates compliance complexity, particularly regarding securities classification of oracle services
- Cross-chain regulatory fragmentation: Different blockchain ecosystems may implement divergent oracle data requirements and compliance frameworks
AT Technical Risks
- Scalability limitations: Managing 1,400+ data feeds across 40+ blockchains presents ongoing technical challenges for data integrity and consistency
- Smart contract vulnerabilities: Oracle contracts carry inherent risks from code exploits or logic errors that could compromise data delivery
- Network dependency: System reliability depends on continuous operation of distributed validator networks and data source availability
VI. Conclusion and Action Recommendations
AT Investment Value Assessment
APRO Token (AT) represents exposure to the growing oracle infrastructure sector, a critical component of DeFi, RWA, and AI-enabled ecosystems. The project benefits from credible institutional backing and operates in a high-demand market vertical. However, significant price deterioration (down 70.87% in 30 days), limited liquidity, and nascent regulatory frameworks present substantial near-term risks. The token's value proposition remains tied to successful ecosystem adoption and the realization of use cases across supported blockchains.
AT Investment Recommendations
✅ Beginners: Start with minimal allocation (0.5-1%) through Gate.com's spot trading, focusing on understanding oracle technology fundamentals before increasing exposure. Consider DCA purchases over 3-6 months to average entry costs.
✅ Experienced Investors: Implement 3-5% portfolio allocation with hybrid strategies combining long-term accumulation during weakness with tactical trading around technical support/resistance levels. Monitor ecosystem developments and partnership announcements closely.
✅ Institutional Investors: Evaluate 5-10% allocations within decentralized infrastructure mandates after conducting thorough due diligence on smart contract audits, validator network security, and regulatory compliance frameworks.
AT Trading Participation Methods
- spot trading on Gate.com: Direct purchase and sale of AT tokens at market prices with real-time execution
- Gate.com staking Programs: Earn yield through platform-provided staking opportunities if available, generating passive income alongside price appreciation
- Strategic Accumulation: Build positions systematically during periods of elevated market pessimism when valuations appear disconnected from fundamental developments
Cryptocurrency investment carries extreme risk. This report does not constitute investment advice. Investors should make decisions based on personal risk tolerance and financial circumstances. Always consult qualified financial advisors before making investment decisions. Never invest more than you can afford to lose completely.
FAQ
What will AT&T stock be worth in 5 years?
Based on current market analysis, AT&T stock is projected to trade between $24.36 and $25.33 in 2025, with an average price around $25.10. For 2030 predictions, more comprehensive market data would be needed for accurate forecasting.
What is the price prediction for ATA in 2025?
ATA is projected to reach $0.5834 during an upward trend in 2025, with a potential downside of $0.01800 if momentum weakens. Predictions are based on market analysis and subject to change.
What is the price prediction for AT&T?
AT&T stock is predicted to decline 10.87% over the next three months, with price expected to range between $21.30 and $22.97. Current technical signals indicate a sell position with medium risk level.
Share
Content
Introduction: AT's Market Position and Investment Value
I. AT Price History Review and Current Market Status
II. Core Factors Influencing AT's Future Price
Three、2025-2030 AT Price Forecast
IV. AT Professional Investment Strategy and Risk Management
V. AT Potential Risks and Challenges
VI. Conclusion and Action Recommendations
FAQ
How to Buy Cryptocurrency


Trending Cryptocurrencies


2025 AT Price Prediction: Expert Analysis and Market Forecast for the Year Ahead

What is ANLOG: Understanding the Analog-to-Digital Conversion Process in Modern Electronics

2025 KAON Price Prediction: Analyzing Market Trends and Potential Growth Factors

Is VELA AI (VELAAI) a good investment?: Analyzing the potential and risks of this emerging AI cryptocurrency
2025 VANA Price Prediction: Assessing the Future Value of this Emerging Cryptocurrency

2025 DEAI Price Prediction: Analyzing Market Trends and Potential Growth Factors

Exploring the World of Web3 and Blockchain Technology

Understanding GameFi: The Future of Gaming Platforms

PEPE Coin Analysis and Future Prospects

Understanding the PEPE Project ($PEPE): A Guide to This Innovative Cryptocurrency

Convert USDT to INR Effortlessly | Live Exchange Rates