2025 ATS Price Prediction: Expert Forecast and Market Analysis for Altitude Token's Future Value


Introduction: ATS Market Position and Investment Value
Alltoscan (ATS) is an innovative Web3 infrastructure platform that empowers builders to decentralize the future. Since its launch in 2022 as a multichain block explorer, it has established strategic partnerships with nearly 40 major blockchain networks including BNB Chain, Avalanche, Polygon, and Floki. As of December 2025, ATS has achieved a market capitalization of approximately $8.27 million with a circulating supply of 62.54 million tokens, trading at around $0.1323 per token. This emerging asset is playing an increasingly vital role in advancing multichain DeFi wallet solutions and Web3 infrastructure development.
This article will provide a comprehensive analysis of ATS's price trends from 2025 through 2030, integrating historical price patterns, market supply and demand dynamics, ecosystem development progress, and macroeconomic conditions to deliver professional price forecasts and practical investment strategies for stakeholders.
Alltoscan (ATS) Market Analysis Report
I. ATS Price History Review and Current Market Status
ATS Historical Price Evolution Trajectory
- April 2024: ATS reached its all-time high (ATH) of $2.5165, marking a significant peak in the project's market performance.
- April 2025: ATS touched its all-time low (ATL) of $0.04001, indicating substantial price correction from previous highs.
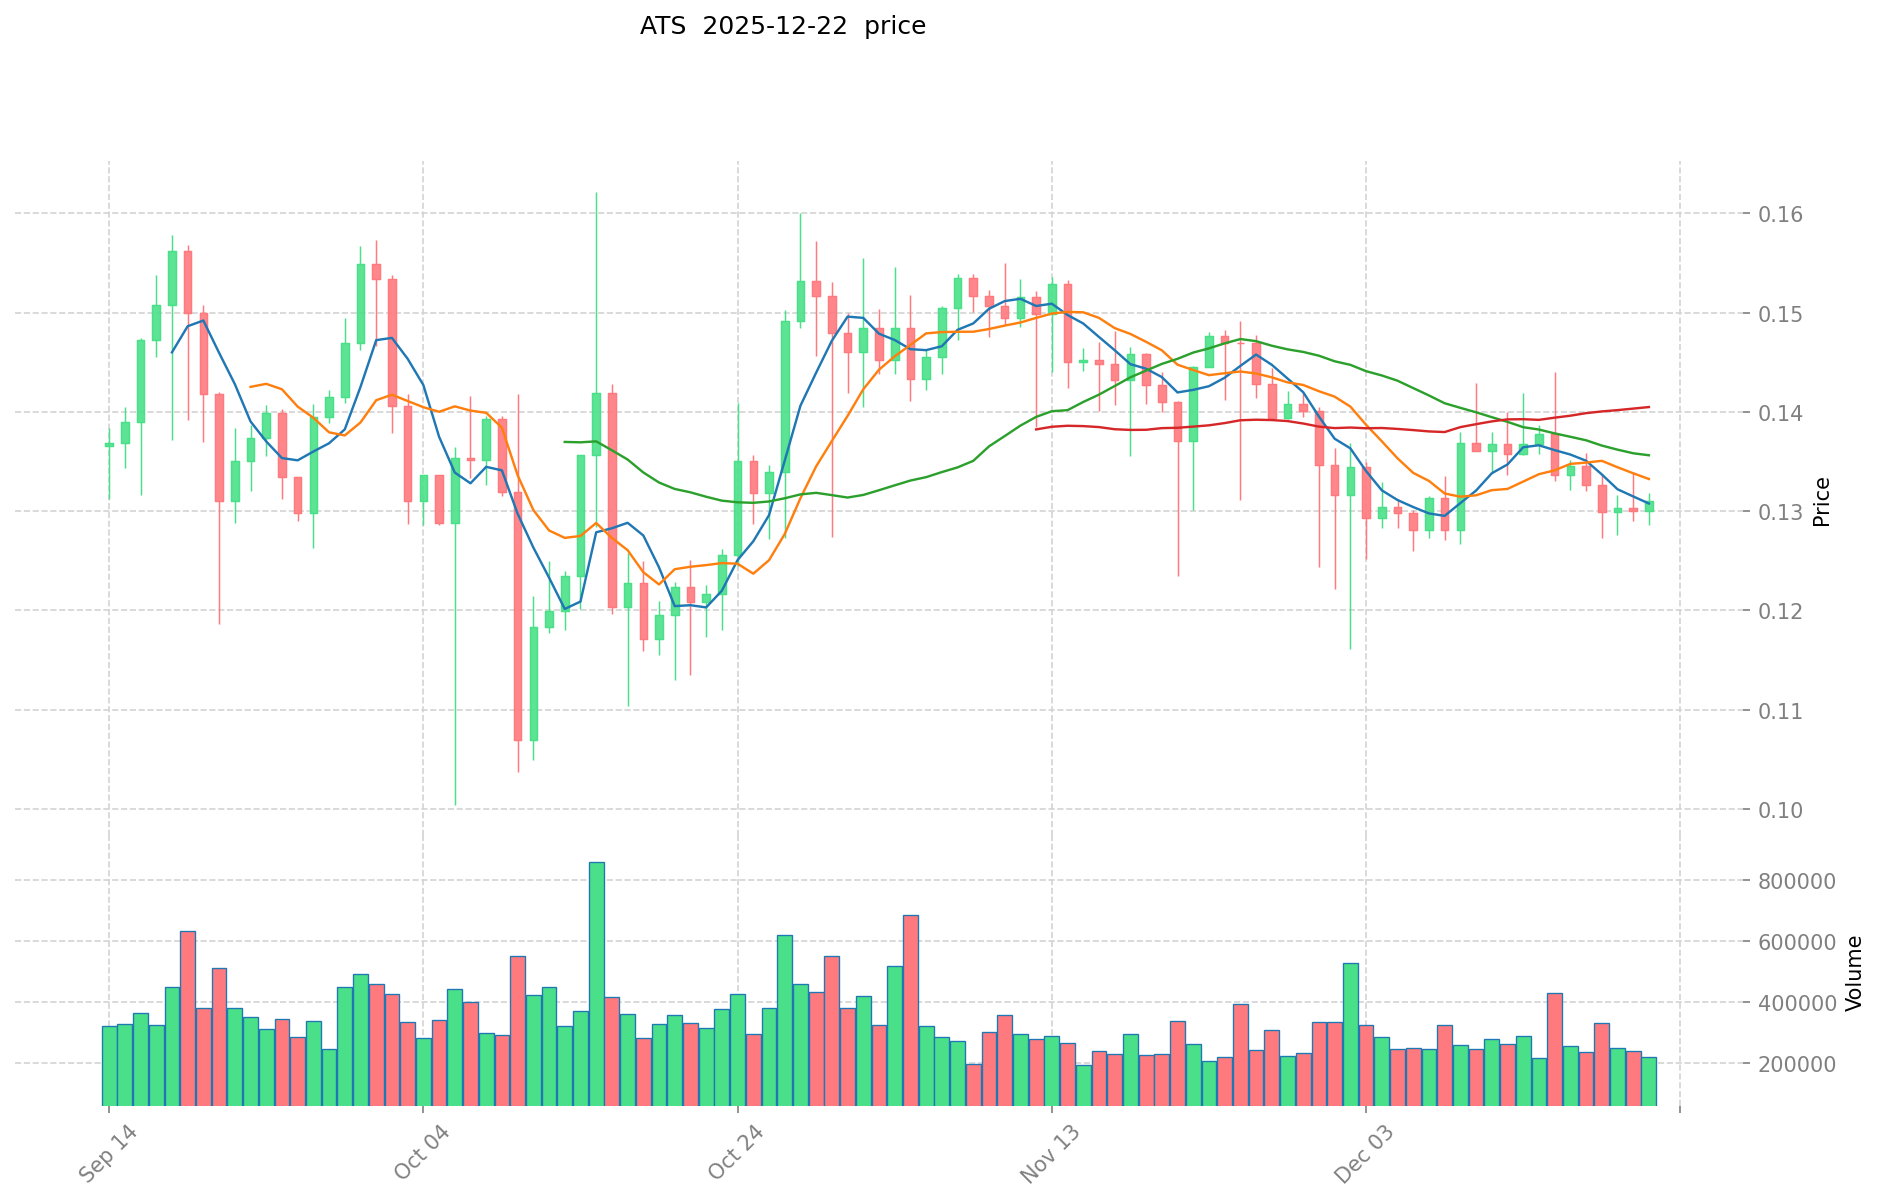
- December 2025: ATS has recovered to $0.13231, demonstrating a 33.08% year-to-date gain despite recent consolidation patterns.
ATS Current Market Status
As of December 22, 2025, ATS is trading at $0.13231, reflecting a 1.78% increase over the past 24 hours. The token has demonstrated moderate volatility in the short term, with the 24-hour trading range between $0.12957 and $0.13347. Over a 7-day period, ATS has experienced a 6.65% decline, while the 30-day performance shows minimal change at -0.04%. The 1-hour price movement indicates a modest positive momentum of 0.13%.
The fully diluted market capitalization stands at $13,231,000, with a circulating supply of 62,536,054 ATS tokens out of a maximum supply of 100,000,000 tokens. The circulating supply ratio is 62.54%, indicating that approximately 37.46% of tokens remain in reserve. The 24-hour trading volume is $28,531.35, reflecting moderate market activity. ATS currently ranks 1,274th among all digital assets and maintains a market dominance of 0.00040%.
The total number of token holders reaches 2,862, demonstrating a growing but still developing community base. The project was published on April 14, 2024, at an initial price of $0.25, representing the foundation for its market entry. Currently, ATS is available for trading on Gate.com and operates on the BEP20 standard on the BSC (Binance Smart Chain) network.
Click to view current ATS market price
ATS Market Sentiment Index
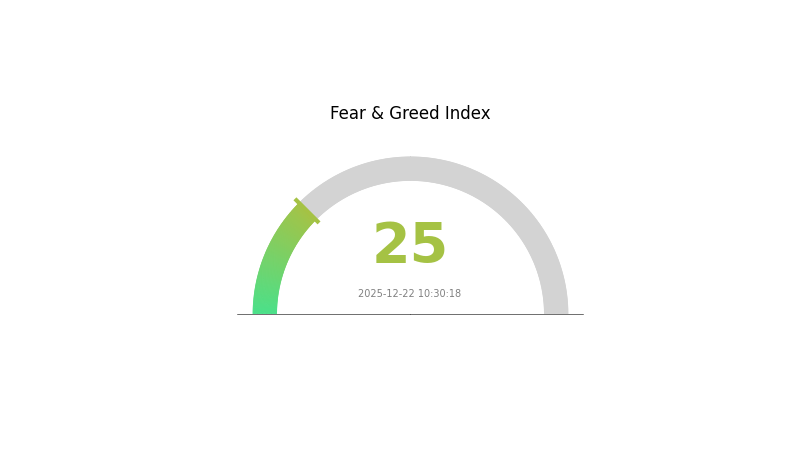
2025-12-22 Fear and Greed Index: 25 (Extreme Fear)
Click to view the current Fear & Greed Index
The cryptocurrency market is currently experiencing extreme fear, with the Fear and Greed Index reading 25. This level typically signals significant market pessimism and heightened investor anxiety. During such periods, assets are often heavily oversold, creating potential opportunities for contrarian investors. However, extreme fear also indicates elevated risk and volatility. Traders should exercise caution and consider their risk tolerance carefully. Market conditions at this level have historically preceded rebounds, but timing remains uncertain. It's advisable to maintain disciplined risk management strategies and avoid emotional decision-making when market sentiment is this bearish.
ATS Holdings Distribution
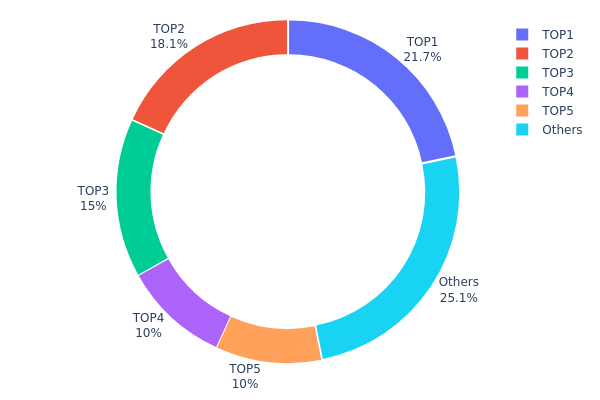
An address holdings distribution chart illustrates the concentration of token ownership across the top wallet addresses and remaining holders. This metric serves as a critical indicator for assessing the degree of decentralization, potential market manipulation risks, and the overall health of token distribution within the ecosystem.
The current ATS holdings distribution reveals a moderate to significant concentration pattern among major stakeholders. The top five addresses collectively control approximately 74.84% of the total supply, with the leading address (0xc22d...5d318e) commanding 21.69% and the second-largest holder (0xd9cb...28e10b) maintaining 18.14% of circulating tokens. While no single entity possesses an overwhelming majority that would constitute extreme centralization, the combined holdings of the top three addresses account for 54.83% of the token supply, indicating a relatively concentrated ownership structure. The remaining 25.16% distributed among other addresses suggests a tail of smaller holders, though the specific composition of this "Others" category warrants further investigation into whether this represents genuine retail distribution or additional concentrated holdings obscured within the aggregated figure.
From a market structure perspective, this distribution pattern presents both opportunities and risks. The concentrated holdings among top addresses create potential liquidity considerations and could theoretically enable significant price movements if major holders execute substantial transactions. However, the non-negligible presence of secondary holders and the moderate fragmentation below the top tier provide some degree of resistance against unilateral market manipulation. The 25.16% allocation to dispersed addresses suggests ongoing participation by smaller stakeholders, which contributes to a more resilient market structure. Overall, ATS demonstrates a moderate decentralization profile—neither excessively concentrated nor particularly distributed—reflecting a typical post-launch distribution pattern where early stakeholders and institutional participants maintain substantial positions alongside emerging community engagement.
Click to view current ATS Holdings Distribution
| Top | Address | Holding Qty | Holding (%) |
|---|---|---|---|
| 1 | 0xc22d...5d318e | 21694.77K | 21.69% |
| 2 | 0xd9cb...28e10b | 18140.25K | 18.14% |
| 3 | 0xdf3b...ae047f | 15000.00K | 15.00% |
| 4 | 0x0d07...b492fe | 10018.60K | 10.01% |
| 5 | 0xf9ef...d85657 | 10000.00K | 10.00% |
| - | Others | 25146.37K | 25.16% |
II. Core Factors Impacting ATS Future Price
Supply Mechanism
-
Total Supply and Circulation: ATS has a total supply of 100 million tokens, with current circulating supply of 62,536,054 ATS (62.54% of total). This large-scale token distribution directly influences price dynamics and market capitalization potential.
-
Holder Distribution: The top 5 wallet addresses collectively hold approximately 76.69% of tokens (21.69%, 20.00%, 15.00%, 10.00%, and 9.66% respectively), while other holders account for 23.65%. This concentrated distribution pattern affects price volatility and market movements.
-
Current Impact: With significant token allocation already in circulation, future price movements will be influenced by the release schedules of remaining tokens and the market's absorption capacity.
Macroeconomic Environment
-
Cryptocurrency Market Trends: ATS price movements are substantially affected by overall cryptocurrency market sentiment and trends. Market demand, investor confidence, and broader digital asset adoption rates serve as key drivers for ATS valuation.
-
Adoption Rate Acceleration: Rapid increases in adoption rates are projected to drive sustained market value expansion, directly supporting price appreciation potential in the medium to long term.
Price Forecast Outlook
Market analysis indicates the following price targets for ATS:
-
2025-2026: Conservative estimates range from $0.07699 to $0.13748, while neutral predictions range from $0.13748 to $0.15000. Market analysis suggests 2026 targets may reach $0.50 to $0.75 per token, indicating significant growth potential.
-
2027: Projected price range of $0.15873 to $0.20385.
-
2028: Projected price range of $0.14466 to $0.23369.
Note: As of November 21, 2025, ATS was trading at $0.1378, representing a 94.52% decline from historical highs. The token ranked 1,280th in market capitalization with a market value of approximately $8,617,468. Recent price action showed a 3.61% decline over the past 24 hours, an 8.98% decline over the past week, but a 14.28% gain over the past 30 days.
Disclaimer: This analysis is for informational purposes only. Cryptocurrency markets are highly volatile and unpredictable. Past performance does not guarantee future results. Investors should conduct thorough research and consider their risk tolerance before making any investment decisions. Consider trading ATS on Gate.com for secure and reliable execution.
Three. ATS Price Forecast for 2025-2030
2025 Outlook
- Conservative Prediction: $0.09028 - $0.13277
- Neutral Prediction: $0.13277
- Optimistic Prediction: $0.19119 (requiring sustained market momentum and increased adoption)
2026-2028 Medium-term Outlook
- Market Stage Expectation: Gradual accumulation phase with progressive price discovery, supported by increasing institutional interest and ecosystem development.
- Price Range Forecast:
- 2026: $0.09881 - $0.21057
- 2027: $0.13412 - $0.23657
- 2028: $0.13531 - $0.30234
- Key Catalysts: Mainstream adoption acceleration, technological upgrades, regulatory clarity, and strengthened market infrastructure development.
2029-2030 Long-term Outlook
- Base Case Scenario: $0.16440 - $0.29284 in 2029, progressing to $0.24738 - $0.40130 in 2030 (assuming steady ecosystem growth and moderate market expansion)
- Optimistic Scenario: $0.29284 - $0.40130 by 2030 (assuming breakthrough adoption metrics and positive macroeconomic conditions)
- Transformative Scenario: Price exceeding $0.40130 (contingent on revolutionary technological breakthroughs and widespread institutional adoption)
- 2030-12-31: ATS displaying cumulative growth of approximately 107% from current baseline (reflecting sustained bullish trajectory across the forecast period)
| 年份 | 预测最高价 | 预测平均价格 | 预测最低价 | 涨跌幅 |
|---|---|---|---|---|
| 2025 | 0.19119 | 0.13277 | 0.09028 | 0 |
| 2026 | 0.21057 | 0.16198 | 0.09881 | 22 |
| 2027 | 0.23657 | 0.18628 | 0.13412 | 40 |
| 2028 | 0.30234 | 0.21142 | 0.13531 | 59 |
| 2029 | 0.29284 | 0.25688 | 0.1644 | 94 |
| 2030 | 0.4013 | 0.27486 | 0.24738 | 107 |
Alltoscan (ATS) Professional Investment Strategy and Risk Management Report
IV. ATS Professional Investment Strategy and Risk Management
ATS Investment Methodology
(1) Long-term Holding Strategy
- Target Investors: Early adopters of Web3 infrastructure, DeFi enthusiasts, and builders seeking exposure to multichain ecosystem solutions
- Operational Recommendations:
- Establish a core position during price consolidation periods below $0.15, leveraging the project's 62.54% circulating supply ratio for potential upside
- Dollar-cost averaging (DCA) approach through regular purchases on Gate.com to mitigate volatility exposure
- Set a 2-3 year holding horizon aligned with Alltoscan's infrastructure development roadmap focused on multichain wallet solutions
(2) Active Trading Strategy
- Technical Analysis Framework:
- Support/Resistance Levels: Monitor key levels at $0.1296 (24-hour low) and $0.1335 (24-hour high) for intraday range-bound trading
- Volume Analysis: Track 24-hour volume of 28,531.35 ATS against historical averages to confirm trend validity before position entry
- Wave Trading Key Points:
- Capitalize on the -6.65% 7-day correction as potential accumulation opportunity before reversal confirmation
- Utilize the 1-year +33.08% performance trend as evidence of underlying bullish momentum during consolidation phases
ATS Risk Management Framework
(1) Asset Allocation Principles
- Conservative Investors: 1-2% of diversified crypto portfolio
- Active Investors: 3-5% of total crypto holdings
- Professional Investors: 5-10% with hedging instruments for volatility management
(2) Risk Hedging Solutions
- Volatility Hedging: Use stablecoin pairs (USDT) on Gate.com to lock in gains during strong upside moves
- Portfolio Diversification: Combine ATS holdings with established layer-1 blockchain tokens to reduce single-asset risk exposure
(3) Secure Storage Solutions
- Hot Wallet Option: Gate.com Web3 Wallet for active trading and DeFi participation with multichain support
- Cold Storage Protocol: Transfer significant holdings to hardware security solutions for long-term custody
- Security Best Practices: Enable two-factor authentication on Gate.com, use hardware wallets for holdings exceeding $5,000 USD equivalent, never share private keys or seed phrases, and verify contract address (0x75d8bb7fbd4782a134211dc350ba5c715197b81d on BSC) before transactions
V. ATS Potential Risks and Challenges
ATS Market Risk
- Liquidity Risk: With only one exchange listing (Gate.com) and 2,862 token holders, ATS faces concentration risk that could limit exit opportunities during market downturns
- Price Volatility: Historical drawdown from $2.5165 ATH (April 2024) to current $0.1323 represents 94.7% decline, indicating extreme volatility susceptibility
- Market Cap Concentration: Total market cap of $13.23M remains relatively small, making the token vulnerable to large institutional or whale-driven sell-offs
ATS Regulatory Risk
- Emerging Project Status: Limited regulatory clarity surrounding multichain infrastructure tokens and cross-chain wallet services could change as global crypto frameworks evolve
- Compliance Uncertainty: DeFi-focused solutions may face increased scrutiny from financial regulators in major jurisdictions regarding custody and asset management features
- Jurisdiction-Specific Restrictions: Token availability and trading may be restricted in certain countries as regulatory frameworks mature
ATS Technology Risk
- Execution Risk: The pivot from block explorer to multichain wallet DeFi solutions represents a significant scope change requiring sustained technical delivery
- Smart Contract Risk: Any vulnerabilities in the ATS token contract or integrated DeFi protocols could result in loss of user funds and project reputation damage
- Competition: Established multichain wallets and DeFi aggregators with larger development teams and user bases pose continuous competitive threats to market adoption
VI. Conclusion and Action Recommendations
ATS Investment Value Assessment
Alltoscan presents a speculative investment opportunity within the Web3 infrastructure sector, supported by its established 40+ partnership network across major blockchain ecosystems (BNB Chain, Avalanche, Polygon). The project's 1-year positive return of +33.08% demonstrates resilience despite the 94.7% decline from historical highs, suggesting selective investor confidence in its long-term infrastructure vision. However, the severe concentration risk (single exchange listing, 2,862 holders), minimal market capitalization, and unproven execution of its multichain wallet pivot warrant significant caution. The token's early-stage status combined with nascent regulatory environment creates both substantial upside potential and downside risk concentration.
ATS Investment Recommendations
✅ Beginners: Start with micro-allocations (0.5-1% of crypto portfolio) on Gate.com only after conducting thorough due diligence on the project's partnerships and development progress; treat as speculative exploration rather than core holding
✅ Experienced Investors: Execute scaled entry using DCA methodology across 3-6 month periods during price consolidation below $0.15; maintain strict stop-loss discipline at 25-30% below entry to manage tail risk
✅ Institutional Investors: Evaluate meaningful positions only upon confirmation of mainnet multichain wallet deployment and significant user adoption metrics; require comprehensive smart contract audits and regulatory compliance assessment before substantial allocation
ATS Trading Participation Methods
- Gate.com Spot Trading: Direct purchase and sale of ATS tokens using fiat or stablecoin pairs with Gate.com's low trading fees and high liquidity
- Gate.com Web3 Wallet Integration: Hold ATS in native Web3 wallet to participate in potential DeFi protocols and earn opportunities as Alltoscan ecosystem expands
- Strategic Accumulation: Use current price weakness and historical -6.65% weekly decline as tactical accumulation window for conviction-based long-term holders with 2+ year investment horizon
Cryptocurrency investments carry extreme risk. This report does not constitute investment advice. Investors should make decisions based on their personal risk tolerance and financial situation. Consult with professional financial advisors before making investment decisions. Never invest capital you cannot afford to lose completely.
FAQ
Is ATS a good stock to buy?
ATS has a consensus Buy rating with strong analyst support. Market analysis indicates positive momentum, making it an attractive investment opportunity for those seeking exposure to this asset.
Is ATS a good buy?
ATS shows strong potential as a buy opportunity. With increasing market adoption, growing trading volume, and positive technical indicators, ATS presents attractive entry points for investors seeking exposure to this asset class.
What will AT&T stock be worth in 5 years?
Based on current forecasts, AT&T stock is projected to reach approximately $26.58 per share by January 2026, representing a 10.19% increase. For a full 5-year outlook, analysts expect continued growth driven by dividend yields and 5G infrastructure expansion, with potential valuations ranging higher as the company strengthens its competitive position.
What are the long-term prospects for ATS?
ATS will evolve into a strategic partner by 2026, offering smarter automation and seamless talent integration. Its role will expand beyond software to enhance recruitment efficiency and connectivity.
Share
Content
Introduction: ATS Market Position and Investment Value
I. ATS Price History Review and Current Market Status
Supply Mechanism
Macroeconomic Environment
Price Forecast Outlook
Three. ATS Price Forecast for 2025-2030
IV. ATS Professional Investment Strategy and Risk Management
V. ATS Potential Risks and Challenges
VI. Conclusion and Action Recommendations
FAQ
How to Buy Cryptocurrency


Trending Cryptocurrencies


Latest Analysis and Investment Outlook for Chainlink Price in June 2025

LMWR vs AAVE: Understanding the Linguistic Debate Between Language Minority Ways of Reading and African American Vernacular English

Is Vaulta (A) a good investment?: Analyzing the potential and risks of this emerging cryptocurrency

2025 DCB Price Prediction: Analyzing Market Trends and Potential Growth Factors

Is Decubate (DCB) a good investment?: Analyzing the Potential and Risks of this Emerging Cryptocurrency

Is Debox (BOX) a Good Investment?: Analyzing Growth Potential and Risks in the Web3 Storage Market

XRP Price Forecast for 2025-2026: Is It a Good Time to Invest?

Quant Price Forecast 2023-2031: Is QNT a Smart Long-Term Investment?

What is QUACK: A Comprehensive Guide to Understanding This Emerging Technology and Its Applications in Modern Computing

What is VINU: A Comprehensive Guide to Virtual Integrated Network Utilities

What is SHDW: A Comprehensive Guide to Shadow's Revolutionary Blockchain Infrastructure