2025 BENJI Price Prediction: Expert Analysis and Market Forecast for the Year Ahead


Introduction: BENJI's Market Position and Investment Value
Basenji (BENJI) is a community-focused token launched on the L2 Base blockchain, designed to establish the strongest community within the space with high-quality content creation for onchain enjoyment. Since its launch in April 2024, BENJI has attracted significant attention from the decentralized finance community. As of December 2025, BENJI's market capitalization stands at approximately $3.601 million, with a circulating supply of 1 billion tokens and a current price hovering around $0.003601. This emerging asset, known as a "community-driven decentralized initiative," is playing an increasingly important role in the Base ecosystem development.
This article will comprehensively analyze BENJI's price movements and trends through 2030, integrating historical patterns, market supply-demand dynamics, ecosystem development, and macroeconomic conditions to provide investors with professional price forecasts and practical investment strategies. Whether you are a long-term believer in the Base ecosystem or a short-term trader seeking opportunities, understanding BENJI's market trajectory will be essential for making informed investment decisions on platforms like Gate.com.
I. BENJI Price History Review and Current Market Status
BENJI Historical Price Evolution
Basenji (BENJI) launched on April 3, 2024, with an initial price of $0.0000035. The token experienced significant price appreciation in its early months, reaching its all-time high (ATH) of $0.09 on June 20, 2024, representing an extraordinary gain from its launch price. Following this peak, BENJI entered a prolonged decline phase throughout the remainder of 2024 and into 2025. The token recently hit its all-time low (ATL) of $0.0034 on December 19, 2025, marking a substantial 96.22% decline from its historical peak.
BENJI Current Market Situation
As of December 24, 2025, BENJI is trading at $0.003601, with a 24-hour trading volume of $14,314.87. The token has a circulating supply of 1 billion BENJI against a maximum supply of 1 billion, giving it a fully diluted market capitalization of $3,601,000. The market dominance of BENJI stands at 0.00011%, reflecting its minimal presence within the broader cryptocurrency market.
In terms of short-term price performance, BENJI has shown mixed signals over various timeframes: the token gained 0.25% over the past hour, but declined 5.21% in the 24-hour period. Over longer horizons, the token shows continued weakness, with a 0.5% decline over seven days, 9.44% over thirty days, and a devastating 87.28% loss over the past year. The token currently holds a market ranking of 1,741 among all cryptocurrencies.
The token maintains an active holder base of 110,970 addresses and is available for trading on 3 exchanges. Current market sentiment remains extremely fearful (VIX: 24), which may be influencing broader cryptocurrency market dynamics.
Click to view current BENJI market price

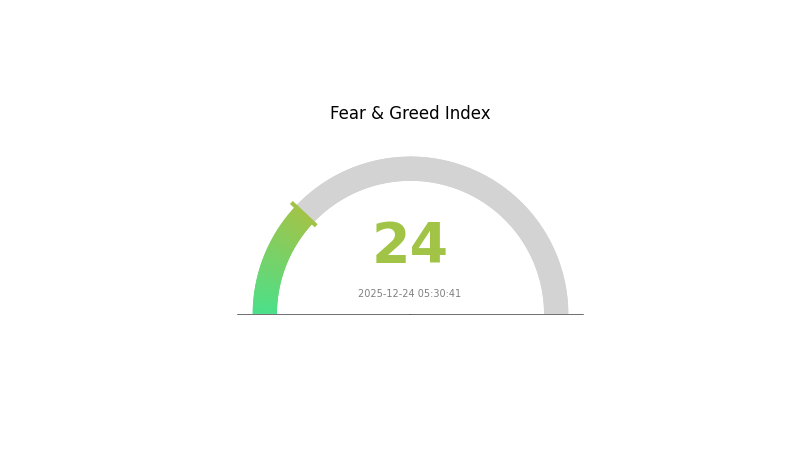
BENJI Market Sentiment Index
2025-12-24 Fear and Greed Index: 24 (Extreme Fear)
Click to view current Fear & Greed Index
The cryptocurrency market is currently experiencing extreme fear, with the Fear and Greed Index at 24. This indicates significant market pessimism and heightened risk aversion among investors. Such extreme fear periods often present contrarian buying opportunities for long-term investors, as assets become oversold. However, caution is warranted as further downside remains possible. Monitor key support levels and maintain proper risk management. Consider dollar-cost averaging into positions during sustained fearful conditions. Stay informed through Gate.com's real-time market data and sentiment analysis tools to navigate this volatile market environment effectively.
BENJI Holdings Distribution
The address holdings distribution map illustrates the concentration of token ownership across the blockchain network by tracking the top holders and their respective proportions of total supply. This metric serves as a critical indicator of decentralization and market structure, revealing potential risks associated with wealth concentration and the vulnerability of the network to coordinated actions by major stakeholders.
BENJI's current holdings distribution demonstrates moderate concentration characteristics. The top five addresses collectively hold approximately 23.32% of the total supply, with the largest holder commanding 8.97% and the second-largest controlling 7.74%. While this concentration level is not uncommon in emerging tokens, the remaining 76.68% distributed among other addresses indicates a relatively fragmented ownership structure. This distribution pattern suggests that BENJI has achieved a reasonable degree of decentralization, with no single entity maintaining overwhelming control of the token supply.
The current address distribution presents a balanced market structure that mitigates certain systematic risks. With the majority of tokens dispersed among numerous holders, the likelihood of coordinated price manipulation or sudden large-scale liquidations remains relatively contained. However, the top five addresses still retain sufficient holdings to influence short-term price movements through strategic transactions. This concentration level is typical for tokens in the growth phase, where institutional participation and early supporters maintain significant positions. The dominance of smaller holders creates a foundation for healthy market dynamics, though continued monitoring of these top addresses remains essential to assess whether concentration increases or decreases over time.
View current BENJI Holdings Distribution
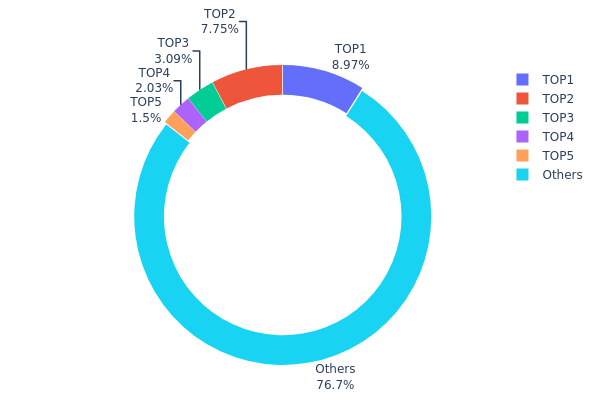
| Top | Address | Holding Qty | Holding (%) |
|---|---|---|---|
| 1 | 0x9b0c...ba8d46 | 89736.74K | 8.97% |
| 2 | 0x1690...b961b0 | 77473.64K | 7.74% |
| 3 | 0x0d07...b492fe | 30900.51K | 3.09% |
| 4 | 0x51c7...502a7f | 20267.83K | 2.02% |
| 5 | 0xb489...46a4d0 | 15000.00K | 1.50% |
| - | Others | 766621.27K | 76.68% |
II. Core Factors Influencing BENJI's Future Price
Market Sentiment and Adoption
-
Investor Confidence Impact: Market sentiment and investor confidence directly influence BENJI price movements. When positive news emerges regarding BENJI's widespread adoption or major technological breakthroughs, it typically triggers optimistic market sentiment, driving BENJI prices upward.
-
Adoption News: Positive developments and adoption announcements can significantly drive up BENJI's value, as market participants react favorably to news of expanded use cases and integration opportunities.
Three, 2025-2030 BENJI Price Forecast
2025 Outlook
- Conservative Forecast: $0.00314 - $0.00361
- Neutral Forecast: $0.00361
- Optimistic Forecast: $0.00455 (requires sustained market sentiment and positive ecosystem developments)
2026-2027 Medium-term Outlook
- Market Stage Expectation: Gradual recovery and consolidation phase with emerging bullish signals
- Price Range Forecast:
- 2026: $0.00290 - $0.00494 (13% upside potential)
- 2027: $0.00374 - $0.00482 (25% upside potential)
- Key Catalysts: Protocol upgrades, increased adoption metrics, market sentiment recovery, and improved liquidity conditions on major platforms like Gate.com
2028-2030 Long-term Outlook
- Base Case: $0.00359 - $0.00630 (assumes moderate ecosystem growth and market normalization by 2028)
- Optimistic Case: $0.00494 - $0.00784 (requires sustained institutional interest and broader market expansion through 2029-2030)
- Transformative Case: $0.00658+ (contingent on breakthrough developments in utility expansion, major partnership announcements, and mainstream adoption acceleration)
- 2025-12-24: BENJI consolidating within current range with attention on 2026 directional catalysts
| 年份 | 预测最高价 | 预测平均价格 | 预测最低价 | 涨跌幅 |
|---|---|---|---|---|
| 2025 | 0.00455 | 0.00361 | 0.00314 | 0 |
| 2026 | 0.00494 | 0.00408 | 0.0029 | 13 |
| 2027 | 0.00482 | 0.00451 | 0.00374 | 25 |
| 2028 | 0.0063 | 0.00467 | 0.00359 | 29 |
| 2029 | 0.00658 | 0.00548 | 0.00532 | 52 |
| 2030 | 0.00784 | 0.00603 | 0.00494 | 67 |
Basenji (BENJI) Professional Investment Strategy and Risk Management Report
IV. BENJI Professional Investment Strategy and Risk Management
BENJI Investment Methodology
(1) Long-term Holding Strategy
- Target Investor Profile: Community-focused participants, content creators, and long-term believers in the Base L2 ecosystem
- Operational Recommendations:
- Accumulate during market downturns, taking advantage of the -87.28% year-over-year decline to establish core positions
- Participate actively in community engagement and content creation initiatives to strengthen conviction in the project's mission
- Maintain positions through volatility cycles, understanding that BENJI is in an early stage of ecosystem development on Base
(2) Active Trading Strategy
-
Price Action Monitoring:
- Monitor 24-hour price movements: Current volatility of -5.21% demonstrates short-term trading opportunities
- Track resistance levels near the all-time high of $0.09 and support levels near recent lows of $0.0034
-
Trading Entry Points:
- Consider entry opportunities after significant pullbacks, as the token has declined substantially from its June 2024 peak
- Use the 7-day and 30-day price trends (-0.5% and -9.44% respectively) to identify consolidation phases
BENJI Risk Management Framework
(1) Asset Allocation Principles
- Conservative Investors: 1-2% of portfolio allocation maximum
- Active Investors: 2-5% of portfolio allocation
- Experienced Traders: 5-10% of portfolio allocation
(2) Risk Hedging Strategies
- Portfolio Diversification: Balance BENJI holdings with established assets to mitigate community token concentration risk
- Position Sizing: Implement strict position limits given the token's market cap of $3.6 million and current liquidity of $14,314.87 in 24-hour volume
(3) Secure Storage Solutions
- Self-Custody Best Practices: Store BENJI tokens in personal wallets to maintain full control of assets; ensure private keys are never shared
- Security Protocols: Enable multi-signature authentication where available, use hardware wallet backup solutions, and maintain offline backups of critical access credentials
- Critical Security Warnings: Never disclose seed phrases to anyone; avoid storing keys on internet-connected devices; verify contract addresses before any transaction
V. BENJI Potential Risks and Challenges
BENJI Market Risks
- High Volatility: The token has experienced an 87.28% decline over one year and a 5.21% drop in 24 hours, indicating extreme price volatility unsuitable for risk-averse investors
- Limited Liquidity: With only $14,314.87 in 24-hour volume and listed on only 3 exchanges, significant price slippage may occur during large trades
- Market Concentration: Approximately 110,970 token holders create potential concentration risk; whale movements could significantly impact price discovery
BENJI Regulatory Risks
- Evolving Regulatory Environment: As community tokens on L2 solutions continue to develop, regulatory frameworks around Base and community-driven projects remain uncertain
- Compliance Uncertainty: Changes in how regulators classify community tokens could impact trading availability across platforms
- Jurisdictional Restrictions: Trading availability may change in different geographic regions as regulatory clarity emerges
BENJI Technical Risks
- Smart Contract Exposure: As a token deployed on Base EVM, BENJI carries risks associated with smart contract vulnerabilities and potential exploits
- Layer 2 Dependencies: BENJI relies on Base's operational stability; any technical issues or security incidents on Base could impact token functionality
- Low Exchange Presence: Limited exchange listings (3 total) create dependency risk; delisting from any major platform could severely impact liquidity
VI. Conclusion and Action Recommendations
BENJI Investment Value Assessment
Basenji represents a community-driven project with an ambitious vision to establish a strong creator-focused ecosystem on Base L2. However, the token faces significant headwinds: an 87.28% yearly decline, minimal trading volume, and limited exchange exposure. The project's long-term value depends critically on successful execution of its community-building strategy and content creation platform. Current market conditions suggest this is a high-risk, speculative investment suitable only for participants with substantial risk tolerance and deep conviction in the Base ecosystem's growth trajectory.
BENJI Investment Recommendations
✅ Beginners: Start with minimal allocation (0.5-1% of portfolio) only after thoroughly researching the project's roadmap and community. Treat this as a speculative position and never invest capital you cannot afford to lose completely.
✅ Experienced Investors: Limit positions to 2-5% of portfolio. Consider accumulating during market weakness if you maintain conviction in the project's fundamentals, but maintain strict stop-loss discipline given the high volatility profile.
✅ Institutional Investors: Conduct comprehensive due diligence on smart contract security, team credentials, and regulatory compliance before any allocation. Implement portfolio-level risk limits to manage concentration exposure to emerging L2 ecosystem tokens.
BENJI Trading Participation Methods
- Gate.com Spot Trading: Trade BENJI directly against major trading pairs on Gate.com for immediate market participation with competitive liquidity
- Dollar-Cost Averaging: Implement systematic purchasing over extended periods to reduce timing risk and average purchase costs across market cycles
- Community Participation: Engage with content creation initiatives and community governance to develop deeper project understanding before committing significant capital
Cryptocurrency investments carry extreme risk. This report does not constitute investment advice. Investors must make decisions based on their individual risk tolerance and should consult professional financial advisors. Never invest more capital than you can afford to lose completely. Always conduct independent research and verify information from primary sources before making investment decisions.
FAQ
How much is Benji base price?
The base price of Benji (BENJI) is $0.003872, with a market cap of $3.92 million and a circulating supply of 1 billion tokens.
What factors could influence Benji's price in the future?
Benji's price may be influenced by block reward halvings, protocol updates, hard forks, market demand, and overall cryptocurrency trends. Community adoption and trading volume also play significant roles in price movements.
What is the historical price performance of Benji coin?
Benji coin reached an all-time high of $0.104985 on June 9, 2024. The token has experienced significant price fluctuations throughout its trading history, reflecting market volatility in the crypto sector.
What are the risks associated with investing in Benji?
Investing in Benji involves price volatility, regulatory uncertainties, and market risks. Conduct thorough research before investing. Performance is not guaranteed.
Share
Content
Introduction: BENJI's Market Position and Investment Value
I. BENJI Price History Review and Current Market Status
II. Core Factors Influencing BENJI's Future Price
Three, 2025-2030 BENJI Price Forecast
IV. BENJI Professional Investment Strategy and Risk Management
V. BENJI Potential Risks and Challenges
VI. Conclusion and Action Recommendations
FAQ
How to Buy Cryptocurrency


Trending Cryptocurrencies


Top Layer 2 projects worth following in 2025: From Arbitrum to zkSync

Pepe Unchained: Pepe Meme Coin evolves into a Layer-2 ecosystem

2025 Layer-2 Solution: Ethereum Scalability and Web3 Performance Optimization Guide

How Layer 2 Changes the Crypto Assets Experience: Speed, Cost, and Mass Adoption

What is Layer 2 in crypto assets? Understand the scaling solution for Ethereum
Pepe Unchained (PEPU): Building the New Era of Meme Coins on Layer 2

What are MERL compliance and regulatory risks in 2026?

Top 4 Coins with the Best Mining Profitability

How does Merlin Chain (MERL) community drive ecosystem growth with 70% activity rate on Twitter, Telegram, and Reddit?

What is the COINX price volatility analysis: historical trends, support resistance levels, and correlation with BTC in 2026?

Top Platforms for Learning and Earning in Cryptocurrency