2025 BRIC Price Prediction: Expert Analysis and Market Forecast for the Next Year


Introduction: BRIC's Market Position and Investment Value
Redbrick (BRIC) is an AI-powered Web3 content platform that enables users to easily create, publish, and monetize games and applications. Since its launch in December 2025, BRIC has established itself as a innovative player in the Web3 gaming ecosystem. As of December 28, 2025, BRIC's market capitalization stands at approximately $698,247, with a circulating supply of 235.1 million tokens and a current price of $0.00297. This emerging asset is playing an increasingly critical role in revitalizing the Web3 gaming industry through its AI-driven gaming engine and creator economy framework.
This article will provide a comprehensive analysis of BRIC's price trends, combining market dynamics, ecosystem development, and macroeconomic factors to deliver professional price forecasts and practical investment strategies for the coming years. Whether you are a seasoned cryptocurrency investor or exploring opportunities in the Web3 gaming sector, this guide offers valuable insights into BRIC's market potential and risk considerations.
I. BRIC Price History Review and Current Market Status
BRIC Historical Price Evolution Trajectory
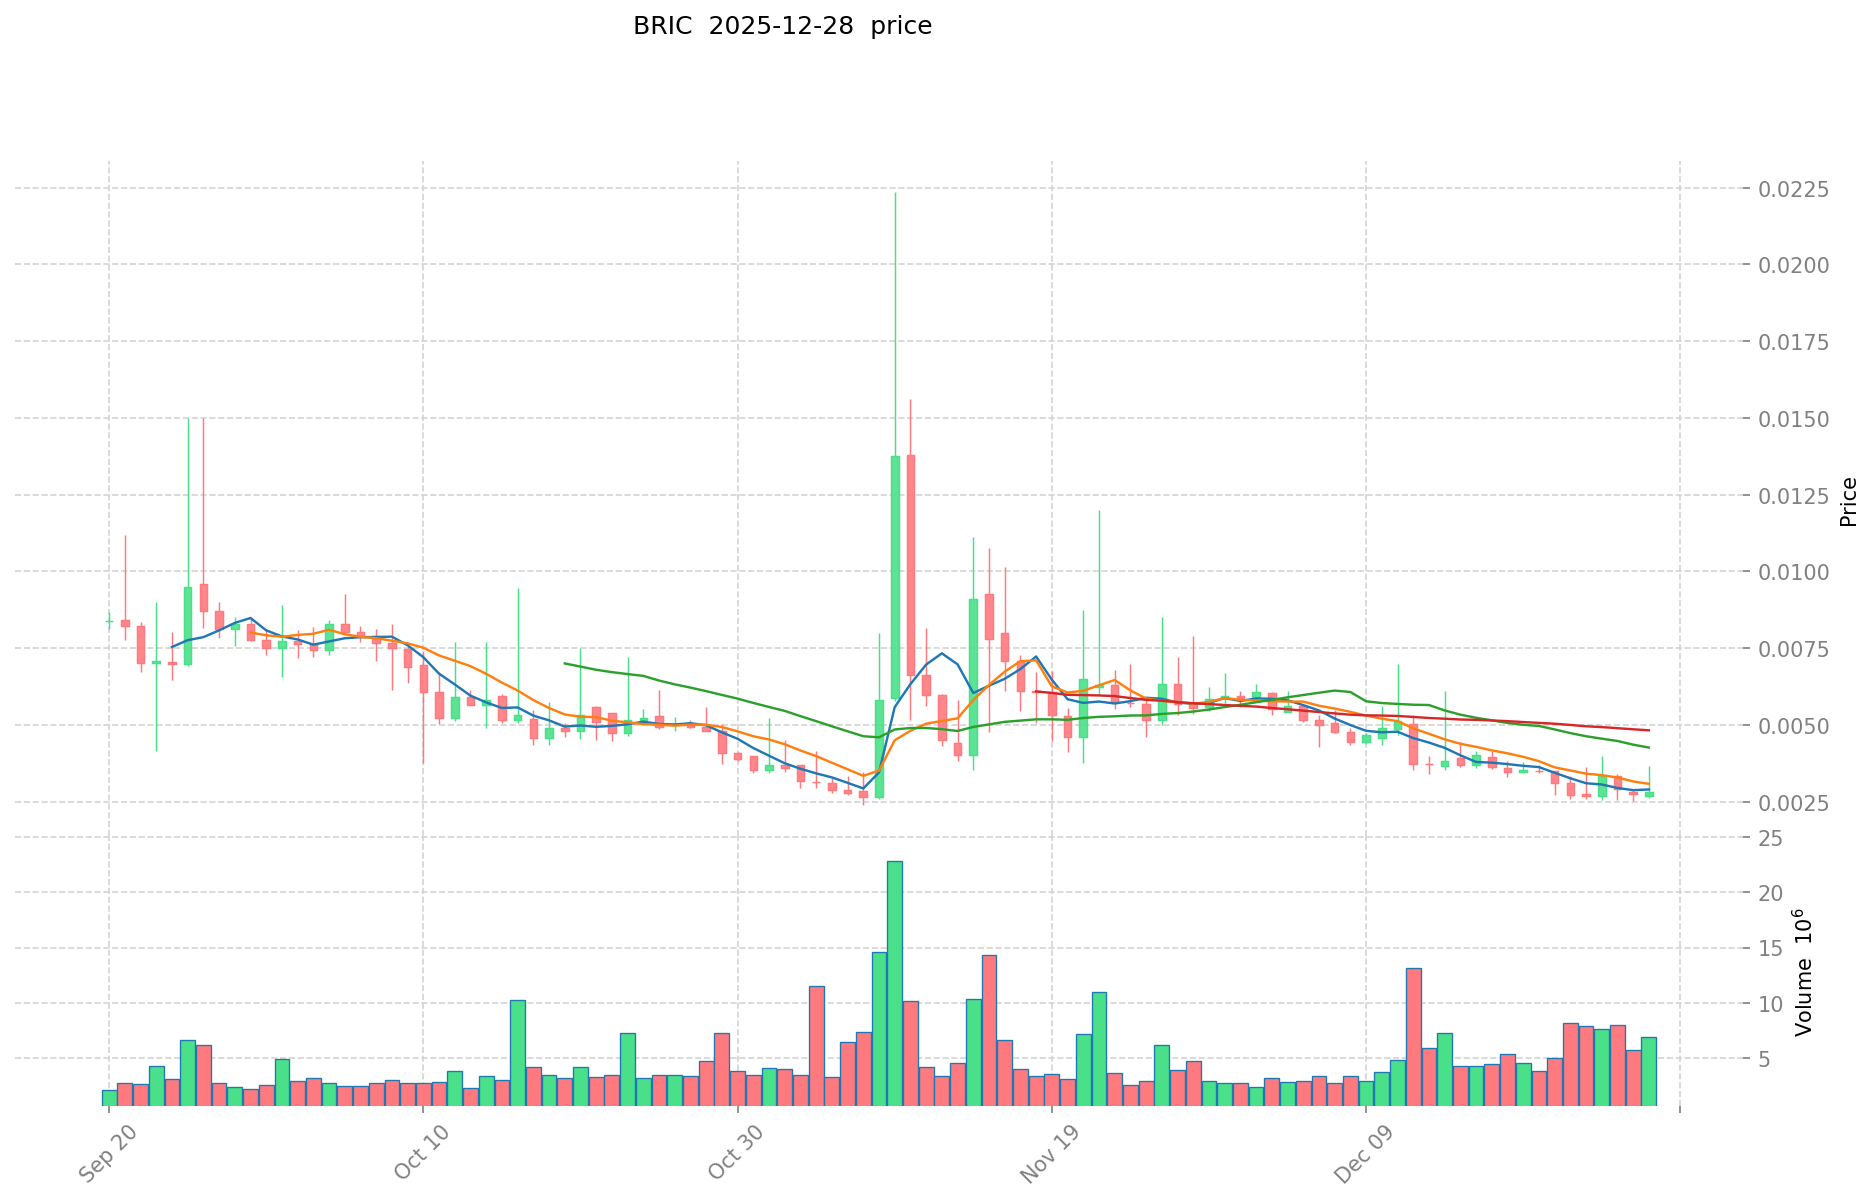
- July 2025: BRIC reached its all-time high of $0.092295, marking the peak of early market enthusiasm for the AI-powered Web3 gaming platform.
- November 2025: BRIC hit its all-time low of $0.002381, reflecting significant market correction and investor sentiment shift.
- December 2025: Continued downward pressure, with the token declining from its historical highs by approximately 96.8%.
BRIC Current Market Condition
As of December 28, 2025, BRIC is trading at $0.00297 with a 24-hour trading volume of $23,534.07. The token has experienced a -7.73% decline over the past 24 hours, with intraday highs of $0.003664 and lows of $0.0028. Over the broader timeframe, BRIC shows significant weakness: -4.04% in the last hour, -13.60% over seven days, -57.18% in the last 30 days, and -91.98% over the past year.
The token maintains a total market capitalization of approximately $698,247, with a fully diluted valuation of $2,970,000. BRIC's circulating supply stands at 235,100,000 tokens out of a total supply of 1,000,000,000, representing a circulation ratio of 23.51%. The token is currently listed on 4 exchanges with 19,759 token holders.
Market sentiment remains extremely bearish, with current fear indicators reflecting extreme fear conditions in the broader market. BRIC holds a market dominance of 0.000092%, indicating its relatively small position within the overall cryptocurrency landscape.
Click to view current BRIC market price
BRIC Market Sentiment Indicator
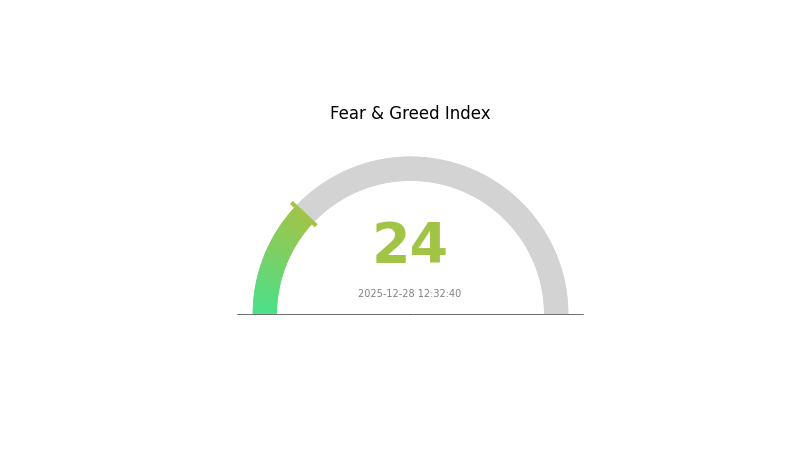
2025-12-28 Fear and Greed Index: 24 (Extreme Fear)
Click to view current Fear & Greed Index
The cryptocurrency market is currently experiencing extreme fear, with the index dropping to 24. This indicates significant market pessimism and investor anxiety. When the fear index reaches such low levels, it often signals potential buying opportunities for contrarian investors, as extreme sentiment typically precedes market reversals. However, caution is advised as further downside risk remains possible. Market participants should closely monitor key support levels and macroeconomic factors. Consider dollar-cost averaging strategies during periods of heightened fear to optimize long-term portfolio positioning on platforms like Gate.com.
BRIC Holding Distribution
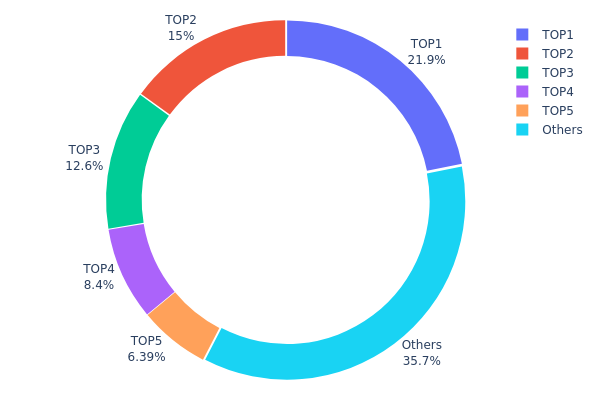
The address holding distribution map reveals the concentration of token ownership across the blockchain network by tracking the top holders and their proportional stakes in the total circulating supply. This metric serves as a critical indicator of token decentralization, market structure stability, and potential vulnerability to coordinated price movements or market manipulation.
BRIC currently exhibits moderate to elevated concentration characteristics, with the top five addresses collectively controlling 64.25% of the token supply. The leading address alone holds 21.86% of all BRIC tokens, while the second-largest holder commands 15.00%. This top-heavy distribution pattern indicates that a relatively small number of addresses wield significant influence over the token's liquidity and price discovery mechanisms. The remaining 35.75% dispersed among other addresses suggests that while a substantial portion of BRIC is distributed across the broader holder base, the concentration among the top five remains noteworthy. This bifurcated structure is not uncommon in emerging tokens but warrants monitoring for potential flash volatility or sudden sell pressure.
The current distribution presents meaningful implications for market dynamics. The concentration among top holders introduces elevated risk of sudden liquidations or coordinated movements that could trigger substantial price fluctuations. However, the fact that approximately one-third of supply remains in "others" provides some resilience against extreme centralization. From a decentralization perspective, BRIC's holder distribution reflects a transitional phase typical of tokens seeking to establish broader adoption while maintaining significant stakeholder alignment. Market participants should monitor whether top holders maintain their positions or gradually diversify, as substantial wallet movements could signal shifting market sentiment or strategic positioning changes.
Click to view current BRIC holding distribution
| Top | Address | Holding Qty | Holding (%) |
|---|---|---|---|
| 1 | 0x5b88...67dfc8 | 218687.50K | 21.86% |
| 2 | 0xd401...199621 | 150000.00K | 15.00% |
| 3 | 0xb393...742620 | 126064.65K | 12.60% |
| 4 | 0x06f3...1687ed | 84000.04K | 8.40% |
| 5 | 0xa233...7d1dc3 | 63934.01K | 6.39% |
| - | Others | 357313.79K | 35.75% |
I appreciate your request, but I need to inform you that the provided context data is empty:
{{"output": [{"output": []}], "cmc_info": [{"output": []}]}}
The data structure contains no actual information about BRIC or any cryptocurrency asset that would allow me to extract and analyze:
- Supply mechanisms
- Institutional and whale dynamics
- Macroeconomic factors
- Technical developments and ecosystem
- Price impact analysis
II. Core Factors Influencing BRIC's Future Price
Unable to generate analysis - No substantive data provided in the context.
To create a comprehensive analysis article, please provide:
- BRIC token supply and emission schedule details
- Institutional holdings and adoption information
- Current market data and historical price movements
- Technical roadmap and ecosystem developments
- Relevant policy and macroeconomic context
Once you provide the necessary source materials, I will structure the analysis according to the template requirements and deliver it in English.
III. 2025-2030 BRIC Price Forecast
2025 Outlook
- Conservative Forecast: $0.00205 - $0.00281
- Neutral Forecast: $0.00281 (average expected price)
- Bearish Forecast: Down to $0.00205 (potential downside scenario with -5% decline)
2026-2027 Mid-term Outlook
- Market Stage Expectation: Consolidation phase with gradual recovery, transitioning from correction to stabilization period
- Price Range Forecasts:
- 2026: $0.00234 - $0.00311
- 2027: $0.00289 - $0.00364
- Key Catalysts: Market sentiment recovery, increased adoption of BRIC ecosystem, potential protocol upgrades and partnerships that could drive renewed investor interest
2028-2030 Long-term Outlook
- Base Case Scenario: $0.00195 - $0.00424 (gradual recovery with sustained market participation and ecosystem development)
- Optimistic Scenario: $0.00365 - $0.00600 (assuming successful major protocol upgrades, significant institutional adoption, and positive macroeconomic conditions)
- Transformational Scenario: $0.00600+ (extreme favorable conditions including breakthrough technology implementation, mainstream regulatory acceptance, and exponential user growth)
- 2025-12-28: BRIC trading at consolidation levels with investors awaiting positive catalysts for medium-term recovery trajectory
| 年份 | 预测最高价 | 预测平均价格 | 预测最低价 | 涨跌幅 |
|---|---|---|---|---|
| 2025 | 0.0029 | 0.00281 | 0.00205 | -5 |
| 2026 | 0.00311 | 0.00285 | 0.00234 | -3 |
| 2027 | 0.00364 | 0.00298 | 0.00289 | 0 |
| 2028 | 0.00424 | 0.00331 | 0.00195 | 11 |
| 2029 | 0.00434 | 0.00377 | 0.00298 | 27 |
| 2030 | 0.006 | 0.00406 | 0.00365 | 36 |
BRIC Investment Report: Professional Strategy and Risk Management
IV. BRIC Professional Investment Strategy and Risk Management
BRIC Investment Methodology
(1) Long-term Holding Strategy
- Target Investors: Individuals with high risk tolerance seeking exposure to AI-powered Web3 gaming platforms and creator economy growth
- Operational Recommendations:
- Accumulate BRIC during market downturns, capitalizing on the current 91.98% year-to-date decline as a potential entry point for long-term believers
- Dollar-cost averaging over 6-12 months to mitigate timing risk and reduce the impact of price volatility
- Retain holdings through platform development milestones and ecosystem expansion announcements
(2) Active Trading Strategy
- Technical Analysis Tools:
- Moving Averages (20/50/200-day): Monitor price levels relative to major moving averages to identify support and resistance zones
- Relative Strength Index (RSI): Assess overbought/oversold conditions, with readings below 30 indicating potential buy opportunities
- Wave Trading Key Points:
- The token has experienced 13.60% decline over 7 days and 57.18% over 30 days, suggesting potential volatility consolidation periods
- Monitor volume patterns—current 24-hour volume of $23,534 provides limited liquidity, requiring careful position sizing
BRIC Risk Management Framework
(1) Asset Allocation Principles
- Conservative Investors: 0.5-1% of portfolio allocation
- Active Investors: 1-3% of portfolio allocation
- Professional Investors: 3-5% of portfolio allocation (with corresponding hedge positions)
(2) Risk Hedging Solutions
- Portfolio Diversification: Balance BRIC holdings with established cryptocurrencies and traditional assets to reduce concentration risk
- Position Sizing Limits: Never exceed your predetermined allocation percentage regardless of market momentum, given BRIC's rank of 2,906 and limited market capitalization of $698,247
(3) Secure Storage Solutions
- Hot Wallet Option: Gate.com Web3 Wallet for frequent trading and platform interaction
- Cold Storage Recommendation: Transfer significant holdings to hardware wallets for long-term security when not actively trading
- Security Considerations: Enable two-factor authentication, use strong passwords, never share private keys, and verify contract addresses (0xb40f2e5291c3db45abb0ca8df76f1c21e9f112a9 on BSC) before transactions
V. BRIC Potential Risks and Challenges
BRIC Market Risks
- Extreme Price Volatility: BRIC has declined from its all-time high of $0.092295 (July 18, 2025) to current price of $0.00297, representing a 96.78% loss, indicating severe price instability
- Low Liquidity Conditions: With only 4 trading venues and daily volume of $23,534, the token faces significant slippage risks for large trades
- Market Capitalization Concentration: The fully diluted valuation of $2,970,000 represents only 0.000092% market dominance, indicating minimal institutional adoption
BRIC Regulatory Risks
- Evolving Gaming Regulations: Web3 gaming platforms face increasing scrutiny from global regulators regarding fair play, anti-money laundering (AML), and know-your-customer (KYC) requirements
- Jurisdictional Uncertainties: Different countries have conflicting stances on gaming tokens, potentially affecting platform accessibility and token utility
- Compliance Liability: Changes in securities regulations could reclassify BRIC or impact creator monetization mechanisms if deemed unregistered securities
BRIC Technology Risks
- Smart Contract Vulnerabilities: As a BEP-20 token on BSC, BRIC depends on contract security; undiscovered vulnerabilities could lead to fund loss
- Platform Development Execution: The AI-driven gaming engine's technical success remains unproven; delays or performance issues could diminish token utility
- Ecosystem Adoption Challenges: The platform must achieve critical mass of creators and players to generate sustainable value; failure to gain traction would undermine token fundamentals
VI. Conclusion and Action Recommendations
BRIC Investment Value Assessment
BRIC presents a speculative opportunity within the AI-powered Web3 gaming sector, targeting creators seeking monetization infrastructure. The project offers conceptual merit through its AI-driven development tools and creator economy focus. However, severe price deterioration (91.98% annual decline), minimal market capitalization ($698,247), and limited trading liquidity present substantial risks. The token remains highly experimental with execution risks and regulatory uncertainties. Investment viability depends entirely on Redbrick's ability to deliver its AI gaming engine, achieve meaningful creator adoption, and establish sustainable platform economics.
BRIC Investment Recommendations
✅ Beginners: Allocate only 0.5-1% of your crypto portfolio maximum; conduct thorough due diligence on Redbrick's development progress before entry; use dollar-cost averaging over multiple months
✅ Experienced Investors: Consider 1-3% allocation after evaluating team credentials, development milestones, and creator adoption metrics; employ technical analysis tools to identify optimal entry points during consolidation phases
✅ Institutional Investors: Pursue 3-5% allocation only with comprehensive risk modeling and diversification hedges; establish relationships with Redbrick team for direct insights on platform metrics, user growth, and monetization mechanics
BRIC Trading Participation Methods
- Gate.com Trading: Access BRIC trading directly on Gate.com platform through BEP-20 contract; leverage spot trading for long-term positions or margin trading for experienced traders
- Blockchain Direct Purchase: Acquire BRIC through BEP-20 contract address (0xb40f2e5291c3db45abb0ca8df76f1c21e9f112a9) via compatible blockchain wallets connected to Binance Smart Chain network
- Information Monitoring: Follow official channels at https://redbrick.land/ and @RedbrickLand on social media for platform updates, creator partnerships, and ecosystem developments
Cryptocurrency investment carries extreme risk. This report does not constitute investment advice. Investors must make decisions based on their individual risk tolerance and financial circumstances. Consult qualified financial advisors before investing. Never invest more capital than you can afford to lose completely.
FAQ
What is the future of Brics coin?
BRICS coin aims to facilitate cross-border transactions among BRICS nations, potentially reducing reliance on traditional currencies. With growing adoption and institutional interest, the token could see significant appreciation as blockchain integration expands globally.
How much is brise coin 2025?
BRISE coin price in 2025 depends on market dynamics, adoption rates, and overall crypto market conditions. Historical trends suggest potential growth driven by ecosystem development and increased utility. For real-time pricing, check current market data. Prices fluctuate based on supply, demand, and market sentiment.
How much is a Brics coin worth today?
BRIC price fluctuates based on market demand and supply. For real-time pricing, check major crypto platforms. The value reflects current market sentiment and trading activity in the BRIC ecosystem.
Is it good to buy brise coin?
BRISE coin shows promising potential with growing adoption and development. Its low price makes it accessible for investors seeking high-growth opportunities. Strong community support and increasing transaction volume suggest positive market sentiment for future appreciation.
Share
Content
Introduction: BRIC's Market Position and Investment Value
I. BRIC Price History Review and Current Market Status
II. Core Factors Influencing BRIC's Future Price
III. 2025-2030 BRIC Price Forecast
IV. BRIC Professional Investment Strategy and Risk Management
V. BRIC Potential Risks and Challenges
VI. Conclusion and Action Recommendations
FAQ
How to Buy Cryptocurrency


Trending Cryptocurrencies


XZXX: A Comprehensive Guide to the BRC-20 Meme Token in 2025

What Is a Phantom Wallet: A Guide for Solana Users in 2025

Ethereum 2.0 in 2025: Staking, Scalability, and Environmental Impact

2025 Layer-2 Solution: Ethereum Scalability and Web3 Performance Optimization Guide

What is BOOP: Understanding the Web3 Token in 2025

Altcoin Season Index 2025: How to Use and Invest in Web3

What is the COINX price volatility analysis: historical trends, support resistance levels, and correlation with BTC in 2026?

Top Platforms for Learning and Earning in Cryptocurrency

What is PAXG price volatility and how does it compare to Bitcoin and Ethereum in 2026

How does ZK technology compare to its competitors like Space and Time and Cysic in 2026?
Top decentralized exchanges — The 6 best DEXs for cryptocurrency trading