2025 COS Price Prediction: Expert Analysis and Market Forecast for the Decentralized Storage Token


Introduction: Market Position and Investment Value of COS
Contentos (COS) is committed to building a better content ecosystem through decentralized income distribution, making all prices and values transparent while directly returning value to users. Since its launch in 2019, the project has been leveraging blockchain technology to enable digital content confirmation, certification, transaction, and distribution. As of December 2025, COS has achieved a market cap of approximately $12.22 million with a circulating supply of around 5.18 billion tokens, currently trading at $0.001234 per token. This digital content infrastructure asset is increasingly playing a key role in revolutionizing content creation and distribution mechanisms.
This article will provide a comprehensive analysis of COS price trends from 2025 to 2030, integrating historical patterns, market supply and demand dynamics, ecosystem development, and macroeconomic factors to deliver professional price forecasts and practical investment strategies for investors.
I. COS Price History Review and Current Market Status
COS Historical Price Evolution Trajectory
- July 2019: Project launch, initial price at $0.020659, marking the beginning of Contentos ecosystem.
- July 2019: All-time high (ATH) reached at $0.084685, representing the peak valuation during early market enthusiasm.
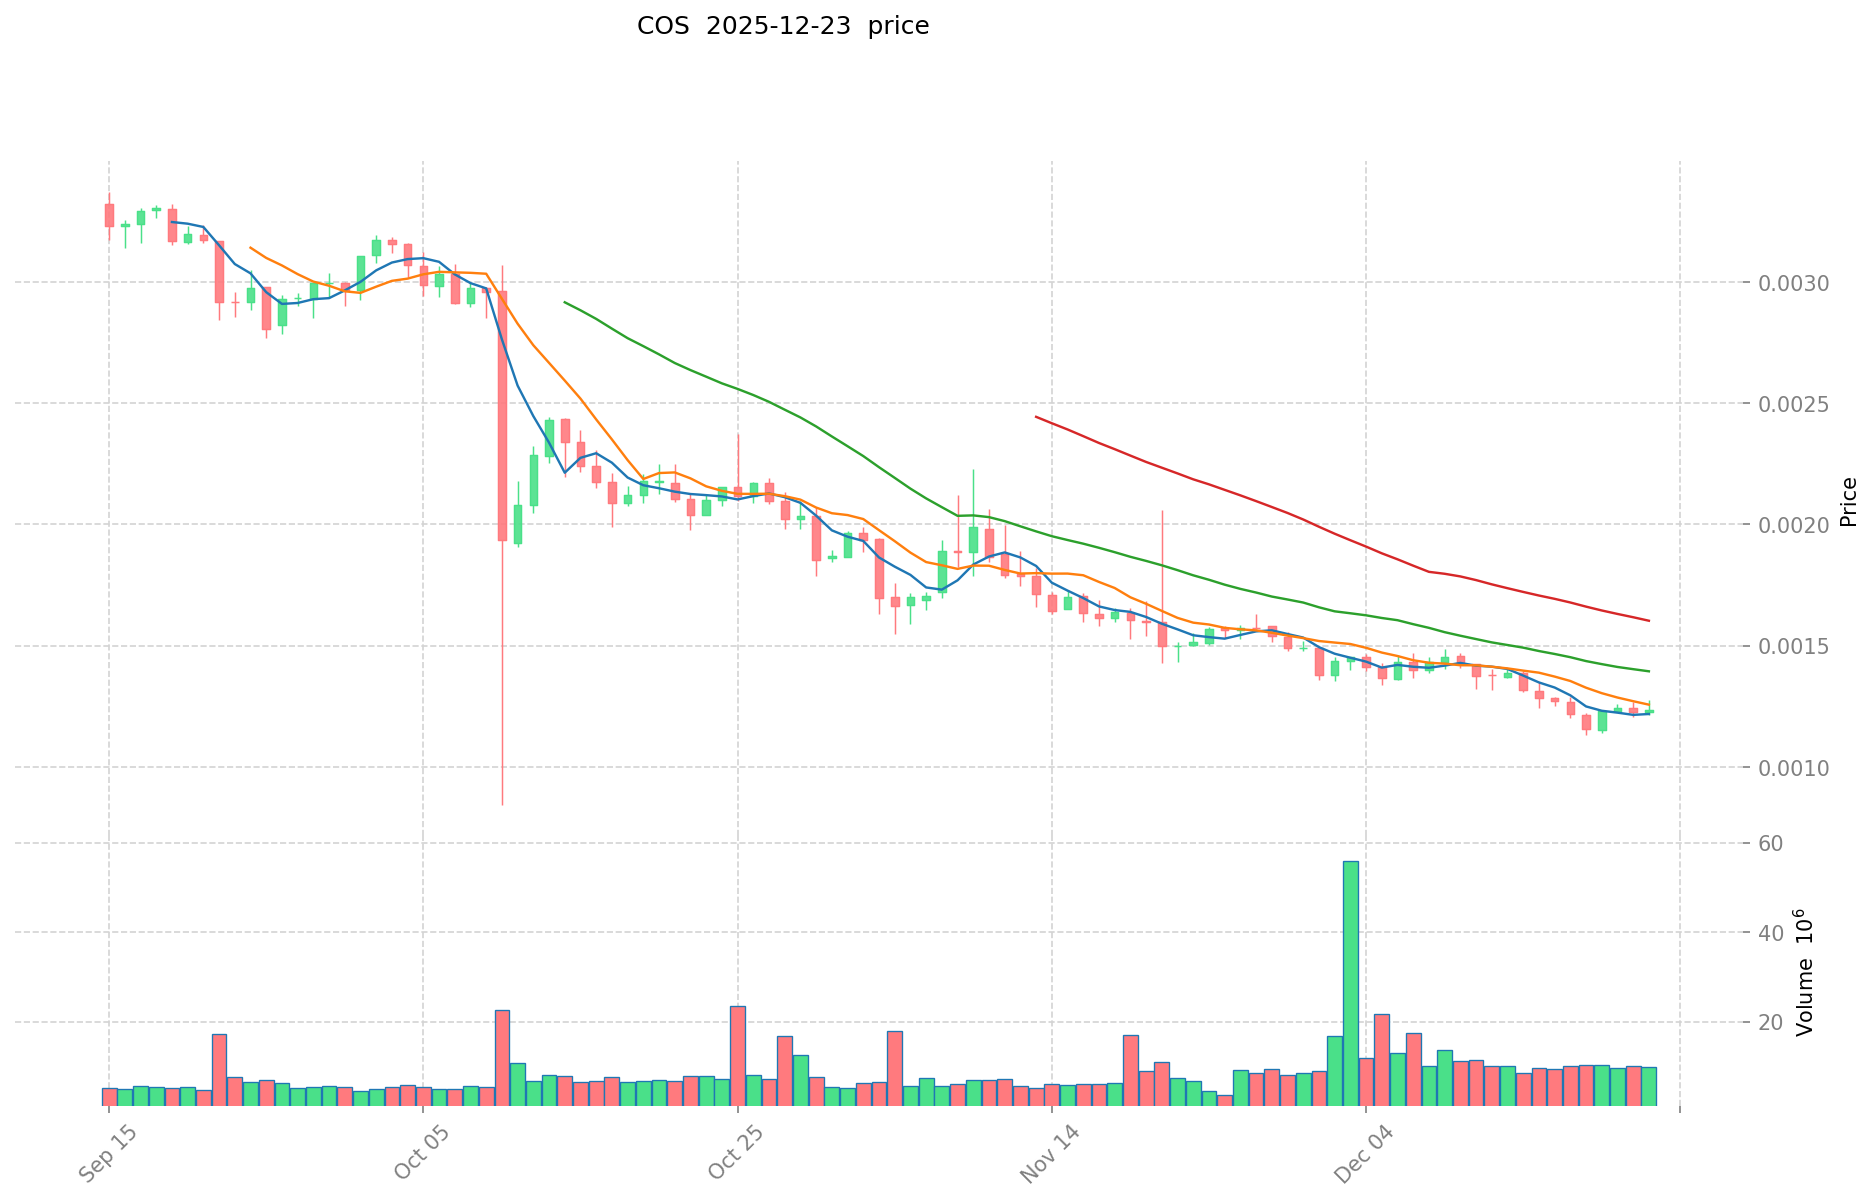
- December 2025: All-time low (ATL) recorded at $0.00114031 on December 19, 2025, reflecting significant long-term depreciation.
COS Current Market Performance
As of December 23, 2025, Contentos (COS) is trading at $0.001234 with a market capitalization of $6,387,750.13 and a fully diluted valuation of $12,217,186.03. The token ranks 1,401st by market cap with a market dominance of 0.00037%.
Price Movement Analysis:
- 1-hour change: +0.32% ($0.000003936204146731)
- 24-hour change: -0.56% ($0.000006949316170555)
- 7-day change: -4.2% ($0.000054100208768267)
- 30-day change: -17.99% ($0.000270694549445190)
- 1-year change: -83.88% ($0.006421086848635236)
Supply Metrics:
- Circulating supply: 5,176,458,774 COS (52.19% of total supply)
- Total supply: 9,900,474,904 COS
- Maximum supply: Unlimited
- Current holders: 10,931
Market Activity:
- 24-hour trading volume: $12,447.29
- 24-hour price range: $0.001214 to $0.001277
- Trading across 13 exchanges, including Gate.com
View current COS market price
COS Market Sentiment Indicator
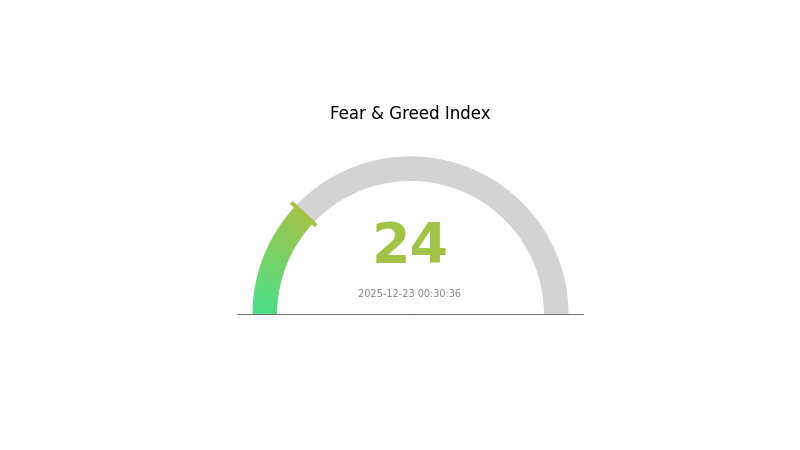
2025-12-23 Fear and Greed Index: 24 (Extreme Fear)
Click to view current Fear & Greed Index
The crypto market is currently experiencing extreme fear, with the index standing at 24. This represents a significant risk-off sentiment among investors, suggesting heightened anxiety about market conditions. During such extreme fear periods, experienced traders often view it as a potential buying opportunity, as assets may be undervalued. However, cautious investors should conduct thorough research before entering positions. Market volatility remains elevated, making risk management essential. Monitor market developments closely on Gate.com for real-time data and trading opportunities.
COS Holdings Distribution
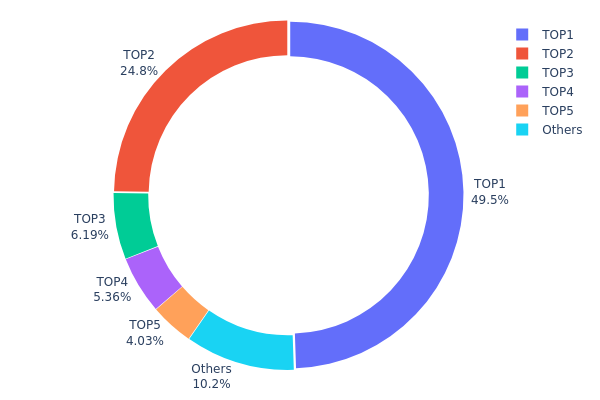
The address holdings distribution map illustrates the concentration of COS tokens across the blockchain network by tracking the top holders and their respective positions. This metric reveals the degree of token centralization, identifies major stakeholders, and provides insights into potential market concentration risks and governance dynamics.
The current holdings data demonstrates a notably high degree of concentration among the top holders. The leading address controls approximately 49.46% of total COS supply, while the second-largest holder accounts for 24.77%, collectively representing nearly 74.23% of all circulating tokens. This level of concentration is substantial and warrants careful consideration. The top five addresses collectively hold 89.78% of the token supply, leaving only 10.22% distributed among all remaining addresses. Such extreme concentration suggests limited token distribution and raises concerns regarding decentralization and market structure integrity.
This pronounced holdings concentration presents several implications for market dynamics and stability. The dominance of a small number of addresses creates potential vulnerabilities to market manipulation, as large holders possess significant influence over price discovery and liquidity conditions. The substantial holdings by the top two addresses indicate either institutional accumulation, protocol treasury reserves, or exchange custody positions, each carrying distinct implications for token velocity and selling pressure. The skewed distribution undermines the decentralized ethos of blockchain networks and potentially amplifies systemic risks during periods of elevated volatility or unexpected liquidation events.
View the current COS Holdings Distribution
| Top | Address | Holding Qty | Holding (%) |
|---|---|---|---|
| 1 | 0x0000...001004 | 2918017.38K | 49.46% |
| 2 | 0xf977...41acec | 1461769.19K | 24.77% |
| 3 | 0x4368...26f042 | 364998.14K | 6.18% |
| 4 | 0x8894...e2d4e3 | 316043.06K | 5.35% |
| 5 | 0x5a52...70efcb | 237442.11K | 4.02% |
| - | Others | 600874.50K | 10.22% |
II. Core Factors Influencing COS Future Price
Supply Mechanism
- Market Demand: COS price is fundamentally driven by market demand dynamics
- Production Costs: Production costs represent a key factor affecting price volatility
- Historical Patterns: Previous supply changes have demonstrated significant impact on price trends
- Current Impact: Subsequent supply adjustments will directly influence future price movements
Institutional and Large-Holder Dynamics
- Institutional Holdings: Top holders include address 0x0000...001004 with 2,918,022.18K COS (49.46% of tracked holdings), address 0x4368...26f042 with 364,998.14K COS (6.18%), and address 0x8894...e2d4e3 with 251,762.00K COS (4.26%)
Three、2025-2030 COS Price Forecast
2025 Outlook
- Conservative Forecast: $0.00063 - $0.00123
- Neutral Forecast: $0.00123
- Bullish Forecast: $0.00165 (requires sustained market recovery and increased institutional adoption)
2026-2027 Mid-term Outlook
- Market Stage Expectation: Gradual recovery phase with increased adoption and ecosystem expansion. COS is expected to consolidate gains while building foundational infrastructure for long-term growth.
- Price Range Predictions:
- 2026: $0.00118 - $0.00214 (17% upside potential)
- 2027: $0.00158 - $0.00220 (45% cumulative growth)
- Key Catalysts: Ecosystem development milestones, strategic partnerships, increased user base engagement, and market sentiment normalization following 2025 consolidation.
2028-2030 Long-term Outlook
- Base Case: $0.00142 - $0.00269 by 2028, reaching $0.00250 - $0.00323 by 2030 (assumes steady adoption and consistent protocol upgrades)
- Bullish Case: $0.00291 by 2029 with 90% total growth (assumes accelerated mainstream adoption and major institutional inflows)
- Transformational Case: $0.00323 by 2030 with 112% cumulative appreciation (assumes breakthrough technological advancement, significant regulatory clarity, and widespread enterprise integration)
Note: All price predictions represent technical analysis and market modeling. Actual performance may vary significantly based on macroeconomic conditions, regulatory developments, and competitive dynamics within the cryptocurrency sector. Users are advised to conduct thorough research on Gate.com and other major trading platforms before making investment decisions.
| 年份 | 预测最高价 | 预测平均价格 | 预测最低价 | 涨跌幅 |
|---|---|---|---|---|
| 2025 | 0.00165 | 0.00123 | 0.00063 | 0 |
| 2026 | 0.00214 | 0.00144 | 0.00118 | 17 |
| 2027 | 0.0022 | 0.00179 | 0.00158 | 45 |
| 2028 | 0.00269 | 0.002 | 0.00142 | 61 |
| 2029 | 0.00291 | 0.00235 | 0.00145 | 90 |
| 2030 | 0.00323 | 0.00263 | 0.0025 | 112 |
Contentos (COS) Professional Investment Strategy and Risk Management Report
IV. COS Investment Methodology and Risk Management
COS Investment Approaches
(1) Long-term Holding Strategy
- Suitable for: Content ecosystem believers and community-oriented investors
- Operation recommendations:
- Accumulate during market downturns when sentiment is negative
- Hold through ecosystem development cycles and community growth phases
- Store COS on secure cold storage solutions for extended holding periods
(2) Active Trading Strategy
- Technical analysis tools:
- Support and resistance levels: Monitor price bounces at 0.001214 (24h low) and 0.001277 (24h high)
- Volume analysis: Track the 24-hour trading volume of 12,447.29 COS to identify breakout opportunities
- Wave operation key points:
- Execute trades during high liquidity windows on Gate.com
- Maintain strict stop-loss orders at 5-10% below entry positions
COS Risk Management Framework
(1) Asset Allocation Principles
- Conservative investors: 1-3% of portfolio allocation
- Active investors: 3-7% of portfolio allocation
- Professional investors: 7-15% of portfolio allocation
(2) Risk Hedging Solutions
- Portfolio diversification: Balance COS holdings with established cryptocurrency assets and traditional investments
- Position sizing: Never allocate more than your risk tolerance threshold to any single micro-cap asset
(3) Secure Storage Solutions
- Cold storage method: Transfer COS to hardware wallets for holdings exceeding 3 months
- Exchange custody: Maintain smaller trading positions on Gate.com for active trading
- Security considerations: Enable two-factor authentication on all exchange accounts; never share private keys or recovery phrases; verify smart contract addresses before transfers
V. COS Potential Risks and Challenges
COS Market Risk
- Extreme price volatility: COS has declined 83.88% over the past year, indicating severe downward pressure and liquidity risks
- Low market capitalization: With a market cap of $6.39 million and fully diluted valuation of $12.22 million, COS remains highly vulnerable to sudden price movements
- Limited trading liquidity: Average 24-hour volume of $12,447 creates significant slippage risk for larger trades
COS Regulatory Risk
- Blockchain content regulation: Global regulatory scrutiny on decentralized content platforms may impact ecosystem operations
- Jurisdiction uncertainty: Regulatory changes across different countries could affect platform accessibility and token utility
- Compliance challenges: Content distribution platforms face evolving compliance requirements around copyright, data privacy, and content moderation
COS Technical Risk
- Smart contract vulnerabilities: Blockchain-based systems carry inherent smart contract risks that could lead to fund loss
- Ecosystem adoption challenges: The success of COS depends on achieving critical mass adoption on the Contentos platform
- Network scalability: Current infrastructure may face performance constraints as transaction volume increases
VI. Conclusion and Action Recommendations
COS Investment Value Assessment
Contentos operates in the decentralized content ecosystem space with a mission to democratize content monetization and establish immutable reputation systems. The project shows ambition in addressing content creator compensation and rights verification through blockchain technology. However, the token faces significant headwinds: an 83.88% year-over-year decline, minimal market capitalization of $6.39 million, and extremely low trading liquidity. These metrics suggest either substantial recovery potential for believers in the vision or heightened risk of further depreciation. The project requires successful platform adoption and ecosystem growth to justify current or higher valuations.
COS Investment Recommendations
✅ Beginners: Start with minimal positions (0.5-1% of portfolio) only if you have conviction in decentralized content platforms; use Gate.com for purchasing and immediate transfer to cold storage
✅ Experienced investors: Consider small speculative allocations during extreme oversold conditions; implement strict technical analysis-based entry and exit points; maintain disciplined risk management with position sizing
✅ Institutional investors: Conduct thorough due diligence on ecosystem adoption metrics and competitive positioning; evaluate team execution capability; consider participation only as a small exploratory allocation in blockchain infrastructure portfolios
COS Trading Participation Methods
- Direct purchase on Gate.com: Register an account, complete KYC verification, and execute spot trades against available trading pairs
- staking and ecosystem participation: Engage with the Contentos platform to earn rewards and ecosystem incentives
- DCA strategy: Use dollar-cost averaging to accumulate positions over time, reducing timing risk in volatile markets
Cryptocurrency investments carry extreme risk. This report does not constitute investment advice. Investors should make decisions based on their individual risk tolerance and financial situation. It is strongly recommended to consult with professional financial advisors before making significant investment decisions. Never invest more capital than you can afford to lose completely.
FAQ
Can Coti reach $10?
Yes, COTI could potentially reach $10, but this would likely occur only in the distant future, after 2030. Current market conditions and projections suggest a longer timeline for achieving this price level.
What is the current price of Coti (COS) and what are the historical price trends?
The current price of Coti (COS) is $0.021, with a 3.12% increase in the last 24 hours. Historical trends show price fluctuations driven by market conditions and trading volume changes.
What factors could drive Coti's price up or down in the future?
Coti's price could rise with increased adoption, successful protocol upgrades, growing trading volume, and positive market sentiment. It may decline due to reduced demand, technical issues, competitive threats, or bearish market conditions.
What is Coti's market cap and how does it compare to other cryptocurrencies?
COTI's market cap is $52.30 million, ranking it below major cryptocurrencies like Bitcoin and Ethereum, positioning it as a mid-tier digital asset in the broader crypto market.
What are the risks and challenges that could impact Coti's price prediction?
Market volatility and regulatory changes are primary risks affecting Coti's price prediction. Technological adoption rates and competition in the DeFi space also significantly influence price movements. These factors collectively shape Coti's future price trajectory.
Share
Content
Introduction: Market Position and Investment Value of COS
I. COS Price History Review and Current Market Status
II. Core Factors Influencing COS Future Price
Three、2025-2030 COS Price Forecast
IV. COS Investment Methodology and Risk Management
V. COS Potential Risks and Challenges
VI. Conclusion and Action Recommendations
FAQ
How to Buy Cryptocurrency


Trending Cryptocurrencies


How Will HOLO Price Evolve by 2030 Based on Current Market Trends?

2025 TCT Price Prediction: Navigating the Future of Cryptocurrency Investments
2025 TRUST Price Prediction: Expert Analysis and Market Forecast for the Coming Year

NKN (NKN) price soaring: What is the driving force behind the 2025 craze?

Aergo Price Analysis: 112% Surge in 90 Days - What's Next for 2025?

Canada Bitcoin Price: 2025 Market Analysis and Investment Outlook
What is HBAR price volatility in 2025: support and resistance levels analyzed

Is EVAA Protocol (EVAA) a good investment?: A Comprehensive Analysis of Price Potential, Risk Factors, and Future Prospects

What are the major security risks and smart contract vulnerabilities facing HBAR in 2025?

What is SHIB token holdings and fund flow: exchange net inflows, concentration, staking rate, and on-chain lock-up analysis?
What is Kaspa (KAS) vs Bitcoin: Competitive Analysis of Performance, Market Cap, and User Base in 2025?