2025 CTA Price Prediction: Expert Analysis and Future Market Outlook

Introduction: CTA's Market Position and Investment Value
Cross The Ages (CTA), a utility token powering a free-to-play gaming ecosystem built on digital trading cards as non-fungible tokens (NFTs), has established itself as a notable player in the gaming and blockchain sectors since its launch in 2024. As of December 2025, CTA maintains a market capitalization of approximately $7.91 million with a circulating supply of 500 million tokens, trading at around $0.01582 per token. This innovative asset is playing an increasingly important role in enabling in-game activities, NFT minting and merging, tournament access, and governance participation within the Cross The Ages metaverse ecosystem.
This article will comprehensively analyze CTA's price trajectory and market dynamics, integrating historical performance data, market supply-demand dynamics, and ecosystem development factors to provide investors with professional price forecasts and practical investment strategies for informed decision-making.
Cross The Ages (CTA) Market Analysis Report
I. CTA Price History Review and Current Market Status
CTA Historical Price Evolution
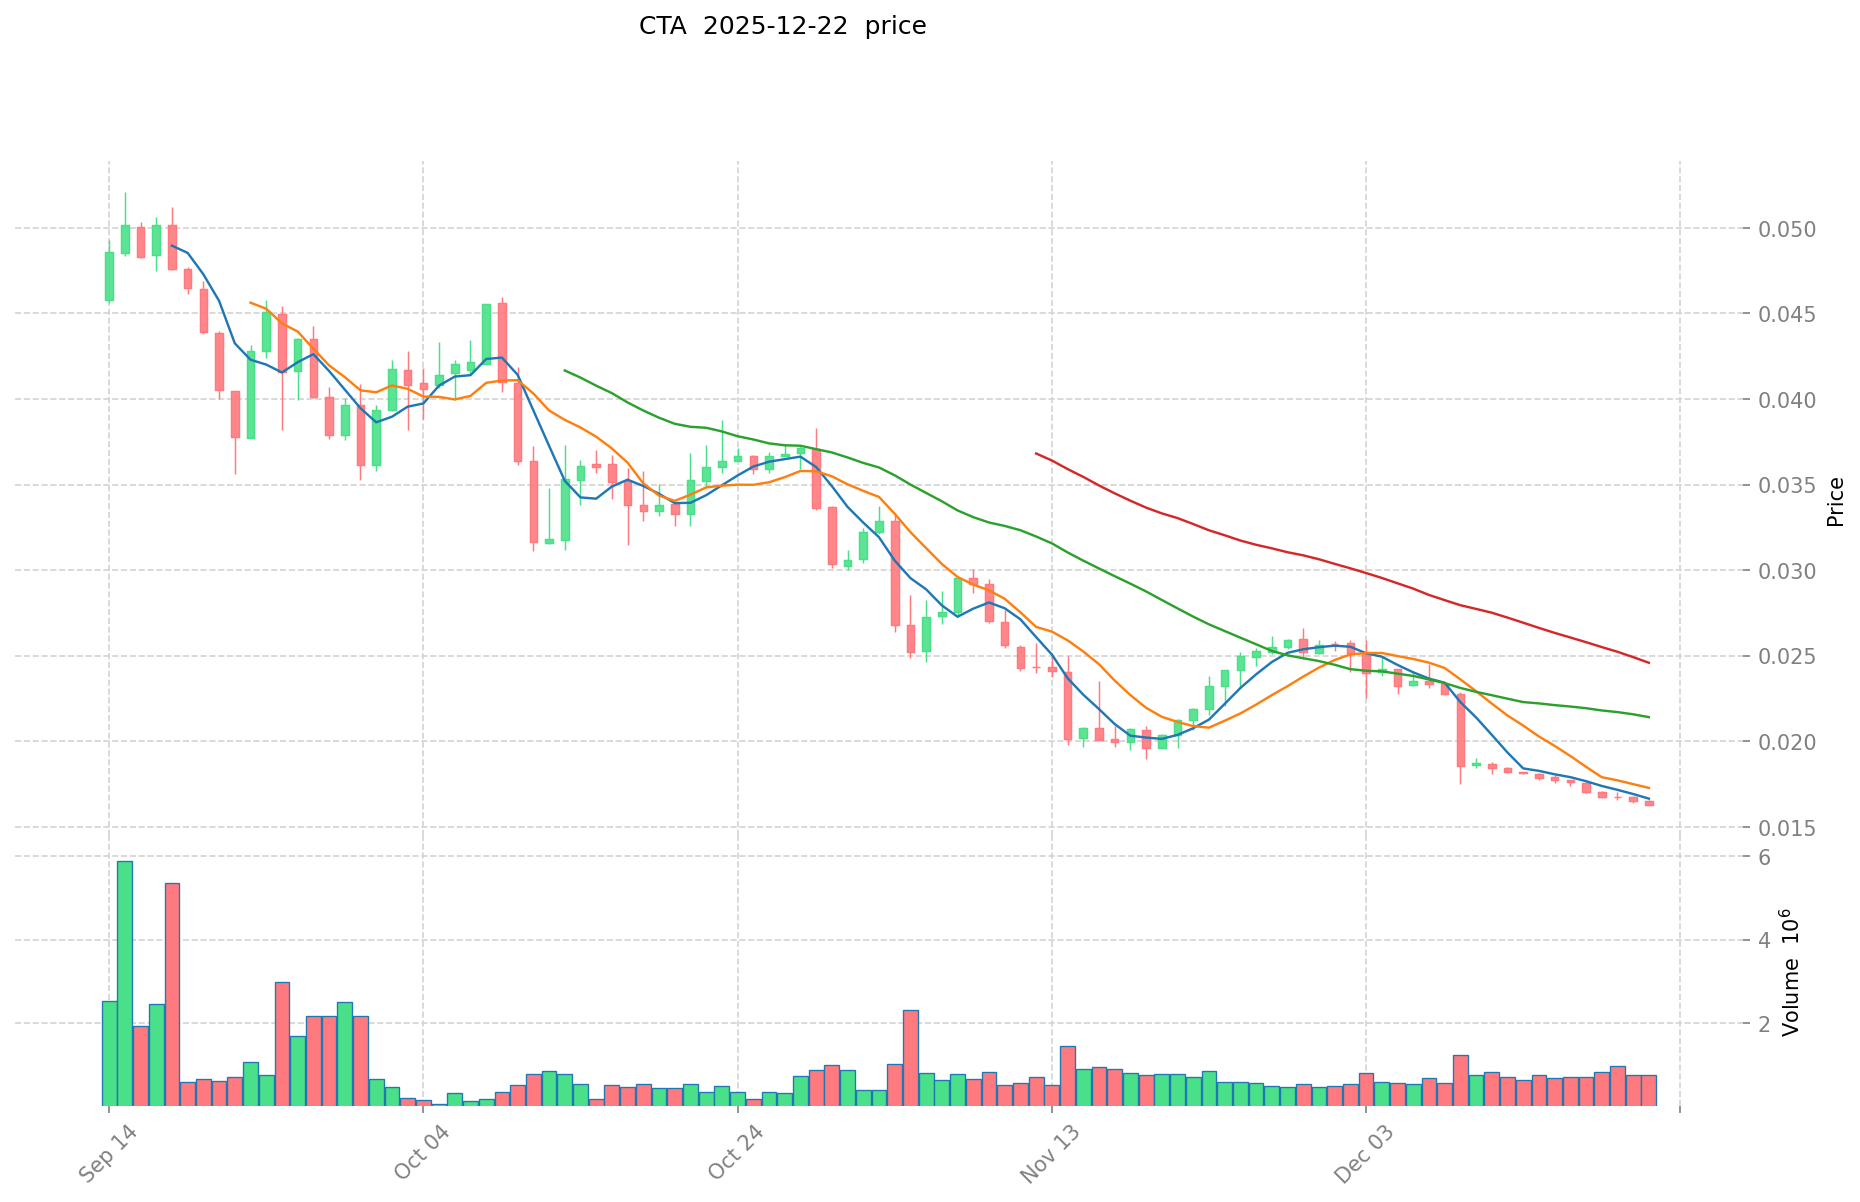
- May 2024: Project listing and initial momentum phase, price reached all-time high of $0.462 on May 17, 2024, reflecting strong market sentiment during the early launch period.
- Mid-2024 to Late 2024: Correction phase, price experienced significant decline from peak levels as market dynamics shifted.
- Late 2024 to Early 2025: Prolonged bearish pressure, price continued downward trajectory throughout this period.
- February 2025: Price hit all-time low of $0.01307 on February 3, 2025, representing a decline of approximately 97% from the historical high, marking the lowest point in the project's trading history.
- February 2025 to Present (December 2025): Consolidation phase with modest recovery, price stabilized in the $0.015-$0.017 range.
CTA Current Market Situation
As of December 22, 2025, CTA is trading at $0.01582, demonstrating a slight upward adjustment of 0.32% in the past hour. However, the token exhibits bearish pressure over longer timeframes, with a 24-hour decline of -3.1%, a 7-day decline of -11.37%, and a 30-day decline of -24.12%. The year-to-date performance shows a significant loss of -41.06% from the publish price of $0.25.
The token's market capitalization stands at $7,910,000 with a circulating supply of 500 million CTA tokens (representing 100% of total supply). The 24-hour trading volume is $12,923.31, indicating relatively modest liquidity in the current market environment. CTA maintains a market ranking of 1,302, reflecting its position within the broader cryptocurrency ecosystem.
The token is actively traded on multiple platforms, with presence across 7 exchanges. The holder base consists of 2,657 addresses, demonstrating moderate distribution within the community.
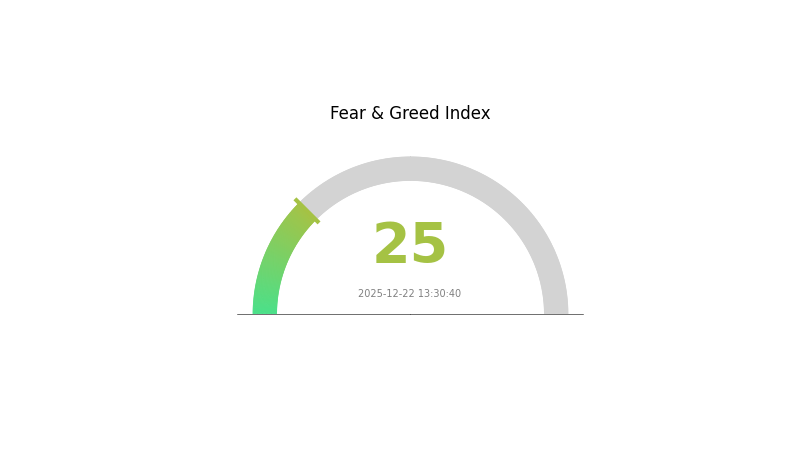
Current market sentiment indicates extreme fear (VIX: 25), which characterizes the broader market conditions as of the reporting date.
Click to view current CTA market price
CTA Market Sentiment Index
2025-12-22 Fear and Greed Index: 25 (Extreme Fear)
Click to view current Fear & Greed Index
The cryptocurrency market is experiencing extreme fear with an index reading of 25. This indicates strong bearish sentiment among investors, reflecting significant market uncertainty and risk aversion. During periods of extreme fear, experienced traders often view this as a potential buying opportunity, as assets may be undervalued. However, caution is advised for new investors. Stay informed about market conditions and manage your risk appropriately on Gate.com.
CTA Holdings Distribution
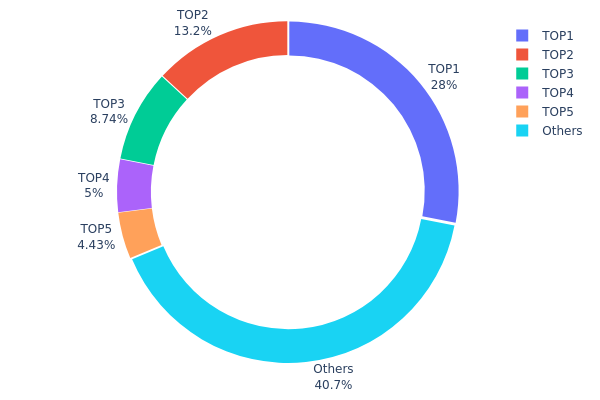
The address holdings distribution map provides a granular view of how CTA tokens are concentrated across blockchain addresses, serving as a critical metric for assessing tokenomics health, decentralization levels, and potential market manipulation risks. By analyzing the top holders and their respective ownership percentages, market participants can evaluate the degree of wealth concentration and its implications for the asset's price stability and governance structures.
Current data reveals a moderately concentrated holder landscape, with the top five addresses collectively controlling approximately 59.3% of total CTA supply. The leading address holds 27.99% of all tokens, representing a significant concentration point that warrants monitoring. The second and third largest holders account for 13.16% and 8.74% respectively, while addresses ranked fourth and fifth maintain more modest positions at 4.99% and 4.42%. This distribution pattern suggests that while the token exhibits some degree of centralization risk among major stakeholders, the remaining 40.7% dispersed across other addresses demonstrates a meaningful level of distributed ownership that mitigates extreme concentration scenarios.
The current holdings structure indicates a balanced but cautiously centralized market environment. The top holder's substantial 27.99% stake could present both opportunities and risks—while such major stakeholders typically possess long-term commitment to the project's success, their disproportionate influence on voting mechanisms and market movements necessitates ongoing evaluation. The relatively healthy participation of smaller address holders at 40.7% suggests organic community engagement and broader token distribution. However, stakeholders should remain vigilant regarding potential coordination among top holders and monitor whether this distribution remains stable over time, as shifts toward greater concentration could indicate institutional accumulation or concerning wealth consolidation patterns.
Click to view current CTA Holdings Distribution
| Top | Address | Holding Qty | Holding (%) |
|---|---|---|---|
| 1 | 0x6522...837e90 | 139995.26K | 27.99% |
| 2 | 0xfb9c...d2717b | 65824.71K | 13.16% |
| 3 | 0x0d07...b492fe | 43708.45K | 8.74% |
| 4 | 0xac5c...33a87d | 24999.97K | 4.99% |
| 5 | 0xc882...84f071 | 22139.33K | 4.42% |
| - | Others | 203332.28K | 40.7% |
II. Core Factors Affecting CTA's Future Price Movement
Supply Mechanisms
-
Supply and Demand Dynamics: Commodity prices are primarily influenced by supply and demand factors, with inventory levels, production volumes, and consumption patterns playing critical roles. These fundamental factors typically change gradually over short periods, creating strong trending characteristics in commodity markets.
-
Historical Patterns: When market supply and demand become imbalanced (such as commodity supply shortages leading to sustained price increases), CTA strategies successfully capture these trends through their algorithmic systems.
-
Current Impact: Commodity markets continue to exhibit high volatility, providing extended trending conditions that support CTA strategy performance. The combination of supply constraints and demand fluctuations maintains strong price momentum across multiple commodity sectors.
Macroeconomic Environment
-
Manufacturing PMI Effects: Manufacturing Purchasing Managers' Index serves as a key indicator of economic growth. When PMI exceeds 50% (indicating high economic growth), quantitative CTA strategies demonstrate superior performance with higher average returns, win rates, and stability. During high-growth periods, trend-following strategy returns average 0.35% with 54.19% win rates, compared to 0.10% returns with 51.01% win rates during low-growth periods.
-
US Dollar Index Influence: The US Dollar Index measures overseas economic conditions and global liquidity impact on commodity markets. When the US Dollar Index is in a downtrend, overseas liquidity expansion supports high-risk assets, and dollar depreciation increases the value of dollar-denominated commodities. Quantitative CTA strategies perform significantly better during US Dollar downtrends, with average returns of 0.36% compared to 0.20% during uptrends.
-
Geopolitical Risk Factors: Major geopolitical events such as the Russia-Ukraine conflict, combined with pandemic disruptions and Federal Reserve interest rate hikes, create multi-factor interactions that drive large commodity price movements. These conditions generate the trending opportunities that CTA strategies are designed to capture.
III. 2025-2030 CTA Price Forecast
2025 Outlook
- Conservative Forecast: $0.00998 - $0.01300
- Neutral Forecast: $0.01584
- Optimistic Forecast: $0.01632 (requires sustained market stability and positive ecosystem developments)
2026-2027 Mid-term Outlook
- Market Stage Expectations: Gradual recovery phase with increased adoption and market maturation
- Price Range Forecast:
- 2026: $0.00868 - $0.02235
- 2027: $0.01768 - $0.02767
- Key Catalysts: Institutional investment inflows, ecosystem expansion, technological upgrades, and strengthened market infrastructure on platforms like Gate.com
2028-2030 Long-term Outlook
- Base Case Scenario: $0.01359 - $0.03094 (assumes moderate adoption growth and stable macroeconomic conditions)
- Optimistic Scenario: $0.02344 - $0.03764 (assumes accelerated institutional adoption and successful protocol implementation)
- Transformational Scenario: $0.03764+ (extreme favorable conditions including mainstream adoption, significant technological breakthroughs, and global regulatory clarity)
- 2030-12-22: CTA projected at $0.02896 (base case average scenario, representing 83% cumulative growth from current levels)
| 年份 | 预测最高价 | 预测平均价格 | 预测最低价 | 涨跌幅 |
|---|---|---|---|---|
| 2025 | 0.01632 | 0.01584 | 0.00998 | 0 |
| 2026 | 0.02235 | 0.01608 | 0.00868 | 1 |
| 2027 | 0.02767 | 0.01921 | 0.01768 | 21 |
| 2028 | 0.03094 | 0.02344 | 0.01359 | 48 |
| 2029 | 0.03072 | 0.02719 | 0.01468 | 71 |
| 2030 | 0.03764 | 0.02896 | 0.01969 | 83 |
Cross The Ages (CTA) Professional Investment Strategy and Risk Management Report
I. Executive Summary
Cross The Ages (CTA) is a free-to-play gaming token built on the Ethereum blockchain, currently trading at $0.01582 (as of December 22, 2025) with a market capitalization of $7.91 million. The token has experienced significant volatility, declining 41.06% over the past year from its all-time high of $0.462. This report provides a comprehensive analysis of investment strategies, risk management frameworks, and considerations for various investor profiles.
II. CTA Token Overview and Current Market Position
Market Fundamentals
| Metric | Value |
|---|---|
| Current Price | $0.01582 |
| Market Capitalization | $7.91 Million |
| Circulating Supply | 500,000,000 CTA |
| Total Supply | 500,000,000 CTA |
| 24-Hour Volume | $12,923.31 |
| Market Ranking | #1302 |
| Market Dominance | 0.00024% |
| Contract Standard | ERC-20 (Ethereum) |
| Token Holders | 2,657 |
Price Performance Metrics
| Period | Change |
|---|---|
| 1 Hour | +0.32% |
| 24 Hours | -3.1% |
| 7 Days | -11.37% |
| 30 Days | -24.12% |
| 1 Year | -41.06% |
| All-Time High | $0.462 (May 17, 2024) |
| All-Time Low | $0.01307 (February 3, 2025) |
III. CTA Token Utility and Ecosystem Design
Game Economy Structure
Crystals (Soft Currency)
- In-game tokens earned and won through gameplay
- Required for all off-chain in-game activities
- Utilities include purchasing card packs, skins, and booster packs
- Can be exchanged for CTA tokens at in-game marketplace rates
- Stable token design for ease of use
Gold (Soft Currency)
- Off-chain token that is non-tradable
- Required for merging digital trading cards
- Provides utility against bot exploitation
- Ensures fair gameplay mechanics
CTA Token (Utility Token)
- Tradable blockchain-based token on Ethereum
- Required for all on-chain activities
- Core utilities include:
- Minting and merging NFTs
- Printing NFTs into physical NFC cards
- Purchasing or unlocking booster packs
- Entering guild competitions and tournaments
- Exclusive content and off-series NFT access
- Special tournament access
- Governance and voting rights over metaverse development direction
- Value appreciation tied to game development and metaverse expansion
NFT and Physical Card Integration
Digital NFT Collectibles
- Trading cards represented as non-fungible tokens
- Limited minting windows for each card collection
- Two collections released annually with 145 cards per collection
- Previous collections become unmintable once new collection launches
- Creates scarcity and purchasing pressure over time
NFC Physical Collection Cards
- Near-field communication technology encodes blockchain smart contracts
- Verifies ownership and authenticity of physical cards
- Prevents counterfeiting of tangible collectibles
- Once printed, NFTs are frozen and cannot be reprinted into NFC cards
Card Merging Mechanics
- Off-chain merging requires Gold tokens
- On-chain NFT merging requires CTA tokens
- Merging produces rarer and more valuable cards
IV. CTA Professional Investment Strategy and Risk Management
CTA Investment Methodologies
(1) Long-Term Holdings Strategy
- Suitable for: Game enthusiasts and believers in the Cross The Ages metaverse vision, investors with 2+ year time horizons, community-oriented cryptocurrency participants
- Operational Recommendations:
- Accumulate CTA during market downturns, particularly below $0.015 support levels
- Focus on holding for 12+ months to benefit from potential game ecosystem expansion and metaverse development
- Participate in governance voting to influence platform direction and increase community engagement
- Monitor quarterly game update releases for significant ecosystem milestones
(2) Active Trading Strategy
-
Market Condition Monitoring:
- Track 24-hour volume patterns: current daily volume of $12,923 indicates thin liquidity requiring cautious position sizing
- Monitor 7-day and 30-day price trends for directional bias confirmation
- Watch for correlation with broader gaming and NFT market sentiment
-
Wave Trading Considerations:
- Utilize resistance levels at $0.01651 (24-hour high) and support at $0.01573 (24-hour low)
- Consider the significant 11.37% decline over 7 days as potential oversold condition
- Position sizing should be conservative given limited liquidity and small market capitalization
CTA Risk Management Framework
(1) Asset Allocation Principles
-
Conservative Investors: 1-2% of cryptocurrency portfolio maximum
- Focus on long-term accumulation only
- Avoid active trading due to liquidity constraints
- Dollar-cost averaging recommended
-
Aggressive Investors: 3-5% of cryptocurrency portfolio
- Acceptable for active trading strategies
- Participation in governance activities
- Engagement with game ecosystem and NFT minting
-
Professional Investors: 2-4% of alternative asset allocation
- Treat as speculative gaming and metaverse exposure
- Implement strict stop-loss orders at 15-20% below entry points
- Rebalance quarterly
(2) Risk Mitigation Approaches
- Position Sizing Discipline: Limit individual trade size to 2-3% of total CTA holdings to manage execution risk in low-liquidity conditions
- Profit Taking Strategy: Establish predetermined exit points at 25%, 50%, 75%, and 100% gains to secure returns during upward movements
(3) Secure Storage Solutions
- Hardware Security: Store significant holdings (>$10,000 value equivalent) in dedicated hardware wallet solutions using industry-standard security practices
- Exchange Holdings: Maintain trading liquidity through Gate.com accounts with two-factor authentication enabled
- Smart Contract Risk: Be aware that CTA is an ERC-20 token on Ethereum; ensure wallet compatibility with standard Ethereum protocols
Security Considerations:
- Enable two-factor authentication on all exchange accounts
- Use hardware wallets for holdings exceeding your active trading needs
- Verify all contract addresses on Etherscan before token transfers
- Never share private keys or seed phrases
- Be cautious of phishing attempts targeting gaming token holders
V. Potential Risks and Challenges
Market Risks
- Extreme Volatility: 41.06% annual decline demonstrates significant price vulnerability; token experienced 71.67% decline from all-time high ($0.462 to current $0.01582)
- Liquidity Constraints: Daily trading volume of $12,923 is substantially low relative to market capitalization; large position exits could face significant slippage
- Market Concentration: Only 2,657 token holders indicates significant concentration risk; large holder redemptions could destabilize price discovery
Regulatory Risks
- Gaming Regulation Uncertainty: Regulatory frameworks for blockchain-based gaming and NFT trading remain evolving and undefined in many jurisdictions
- Securities Classification: Potential regulatory reclassification of gaming tokens with governance features could impact trading venues and holder rights
- Geographic Restrictions: Certain jurisdictions may restrict or prohibit participation in play-to-earn gaming economies
Technology Risks
- Smart Contract Vulnerability: ERC-20 implementation on Ethereum subject to potential code vulnerabilities despite standard protocol
- Game Development Dependencies: Project success depends entirely on ongoing development roadmap execution and feature delivery
- User Adoption Risk: Player acquisition and retention metrics directly impact token utility value and demand
VI. Conclusions and Action Recommendations
CTA Investment Value Assessment
Cross The Ages represents a speculative investment positioned at the intersection of blockchain gaming, NFT collectibles, and metaverse development. The token's current market position reflects significant downward pressure with limited trading volume, suggesting a period of reduced investor confidence or market indifference. The comprehensive ecosystem design incorporating crystals, gold, CTA tokens, NFTs, and physical NFC cards demonstrates thoughtful tokenomics architecture intended to support sustainable game economics.
However, the 41.06% annual decline and current distance from all-time highs indicate substantial execution risks remain. The project's long-term viability depends critically on sustained game player growth, successful metaverse expansion, and continued feature development. With only 2,657 token holders and low daily trading volume, the token exhibits characteristics typical of early-stage or struggling gaming projects.
CTA Investment Recommendations
✅ For Beginners:
- Initiate position through Gate.com with small amounts (< $100) to learn platform mechanics
- Focus on understanding the game ecosystem before committing capital
- Participate in educational research rather than aggressive trading
- Consider CTA as a community participation token rather than pure investment
✅ For Experienced Investors:
- Implement dollar-cost averaging strategy over 6-12 month periods during price weakness
- Actively monitor game development milestones and community growth metrics
- Establish clear entry targets ($0.012-0.015 range) and exit targets (30-50% gain)
- Diversify across multiple gaming tokens rather than concentrated CTA holdings
✅ For Institutional Investors:
- Conduct comprehensive due diligence on development team and game publishing partnerships
- Negotiate OTC purchases for substantial positions to manage execution costs
- Structure investments as speculative allocation (<5%) within broader gaming sector exposure
- Implement quarterly review and rebalancing protocols
CTA Trading Participation Methods
- Gate.com Spot Trading: Direct purchase and sale of CTA tokens with competitive fees; primary recommended method for individual investors
- Over-The-Counter (OTC) Markets: Large investors can negotiate direct transactions to avoid market impact from substantial trades
- In-Game Acquisition: Earn crystals through gameplay and exchange for CTA within the game's internal marketplace at prevailing rates
Cryptocurrency investment carries extreme risk. This report does not constitute investment advice. Investors should make decisions based on their individual risk tolerance and should consult professional financial advisors. Never invest more than you can afford to lose completely.
FAQ
Are CTA prices going up?
Yes, CTA prices are expected to increase in 2026. The fare hike is confirmed due to ongoing fiscal challenges. This represents an official update for the transportation system's pricing structure.
Why is the CTA 5 dollars?
CTA is priced at $5 to reflect its market value and utility within the Web3 ecosystem. This price point balances accessibility with token sustainability, supporting long-term project development and community growth.
What is the budget for the CTA 2026?
The CTA's 2026 budget is $2.23 billion, approved in November. This allocation aims to support service improvements and operational needs for the coming year.
Is CTA ridership increasing?
Yes, CTA ridership is increasing. Retention of 2019 ridership improved from 63% in 2023 to 68% in 2024, with scheduled service levels rising throughout 2024.
Share
Content
Introduction: CTA's Market Position and Investment Value
I. CTA Price History Review and Current Market Status
II. Core Factors Affecting CTA's Future Price Movement
2025 Outlook
2026-2027 Mid-term Outlook
2028-2030 Long-term Outlook
I. Executive Summary
II. CTA Token Overview and Current Market Position
III. CTA Token Utility and Ecosystem Design
IV. CTA Professional Investment Strategy and Risk Management
V. Potential Risks and Challenges
VI. Conclusions and Action Recommendations
FAQ
How to Buy Cryptocurrency


Trending Cryptocurrencies


2025 FRONTIERS Price Prediction: Analyzing Market Trends and Potential Growth Factors

Open Loot Explained: Core Whitepaper Logic and Gaming Applications

2025 GALA Price Prediction: Will GALA Token Reach New Heights in the Metaverse Era?

2025 COPI Price Prediction: Analyzing Market Trends and Growth Potential in the Evolving Digital Asset Landscape
What is MCRT: Exploring the Revolutionary Ray Tracing Technology in Computer Graphics
What is SKYA: Exploring the Revolutionary AI-Powered Sky Mapping Technology
Is Investing in MATIC (Polygon) a Smart Choice for Beginners? Pros, Cons, and Considerations
Understanding Blockchain Network Congestion

What is GUN: A Comprehensive Guide to Understanding Firearms, Their History, and Global Regulations

Understanding the Concept of Bridges in Blockchain
What is BTR: A Comprehensive Guide to Beyond the Rack and Its Impact on Online Retail