2025 DKA Price Prediction: Expert Analysis and Market Forecast for the Coming Year

Introduction: DKA's Market Position and Investment Value
dKargo (DKA), a blockchain-based logistics protocol designed to solve trust and cooperation challenges in the logistics industry, has been building an efficient logistics network since its inception. As of December 2025, DKA's market capitalization has reached approximately $27.98 million, with a circulating supply of 5 billion tokens, currently trading at $0.005595. This utility token, recognized for its role in supporting the dKargo ecosystem, is increasingly playing a critical role in revolutionizing logistics services through blockchain technology.
This article will provide a comprehensive analysis of DKA's price trends from 2025 to 2030, combining historical patterns, market supply and demand dynamics, ecosystem development, and macroeconomic factors to deliver professional price forecasts and practical investment strategies for investors interested in this logistics-focused digital asset.
DKA (dKargo) Market Analysis Report
I. DKA Price History Review and Current Market Status
DKA Historical Price Evolution
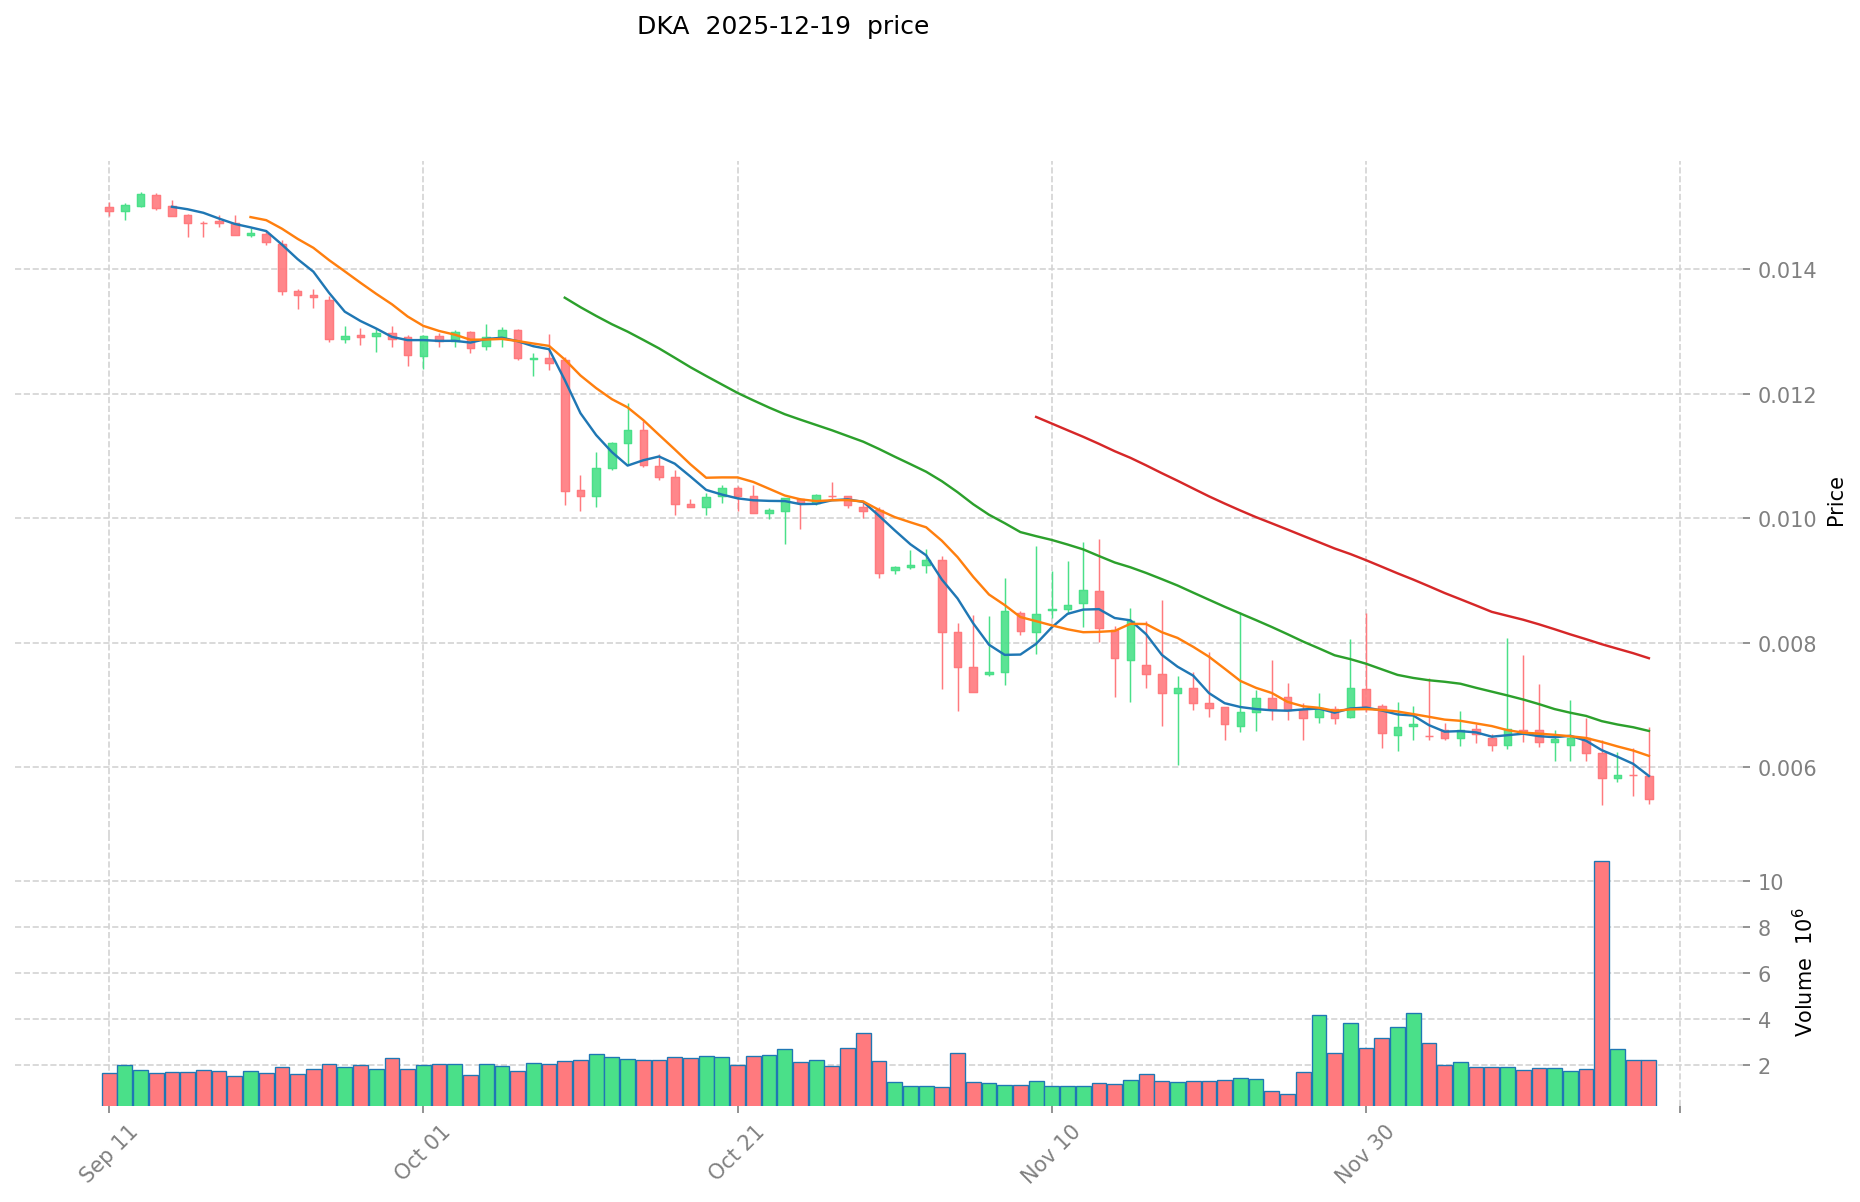
- 2021: Project launch phase, DKA reached its all-time high of $0.703797 on March 16, 2021, marking the peak of early market enthusiasm.
- 2021-2025: Extended bear market cycle, price experienced significant deterioration from the historical peak, declining approximately 99.2% over the four-year period.
- 2025: Continued downward pressure, DKA reached its all-time low of $0.00531666 on December 19, 2025, just one day before the current date.
DKA Current Market Status
As of December 20, 2025, DKA is trading at $0.005595, representing a marginal recovery of 0.07% over the past 24 hours. The token's 24-hour trading range spans from $0.005124 to $0.006644, with a 24-hour trading volume of approximately $11,395.37.
The token's market capitalization stands at $27,975,000, with a fully diluted valuation equivalent to its current market cap, reflecting that all 5 billion tokens are currently in circulation (100% circulation rate). DKA maintains a market dominance of 0.00087%, ranking 728th among all digital assets.
Over broader timeframes, DKA exhibits significant downside momentum: down 11.37% over 7 days, 20.08% over 30 days, and 75.59% over the past year. However, the hourly timeframe shows a modest positive movement of 0.31% in the last hour.
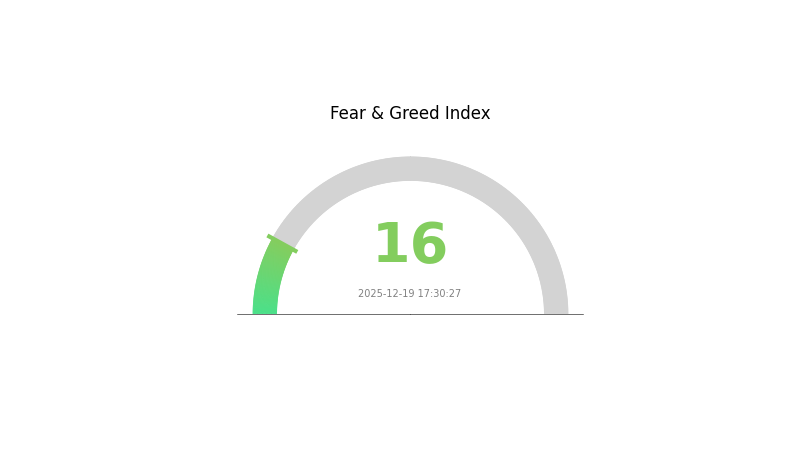
The token maintains liquidity across 5 exchanges and has approximately 4,425 holders. Current market sentiment indicators show "Extreme Fear" (VIX at 16), reflecting depressed market conditions and limited investor confidence in risk assets.
Click to view current DKA market price
DKA Market Sentiment Indicator
2025-12-19 Fear and Greed Index: 16 (Extreme Fear)
Click to view current Fear & Greed Index
The crypto market is currently experiencing extreme fear, with the Fear and Greed Index at 16. This indicates heightened market anxiety and pessimism among investors. When fear reaches such extreme levels, it often signals potential buying opportunities for long-term investors, as assets may be undervalued. However, traders should exercise caution and conduct thorough research before making investment decisions. Market volatility remains high during periods of extreme fear, presenting both risks and opportunities. Consider dollar-cost averaging or waiting for clearer market signals before entering positions on Gate.com.
DKA Holdings Distribution
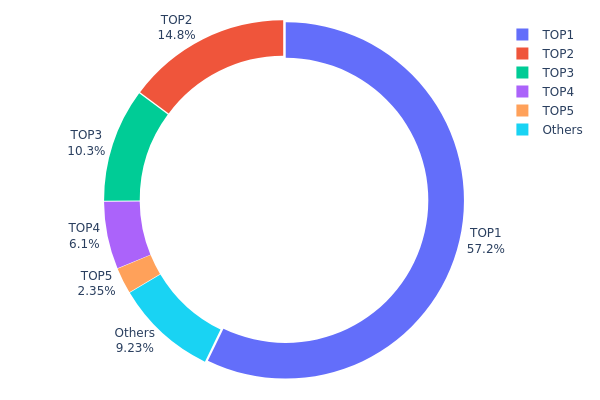
The address holdings distribution chart illustrates the concentration of DKA tokens across wallet addresses on the blockchain. This metric provides critical insights into token ownership structure, revealing whether holdings are dispersed among numerous participants or concentrated in the hands of a few major stakeholders. By analyzing the distribution pattern, investors can assess the token's decentralization level and evaluate potential risks associated with large holder behavior.
The current DKA holdings data reveals a pronounced concentration risk. The top holder controls 57.19% of total supply, while the combined top four addresses account for 88.41% of all tokens in circulation. This extreme concentration indicates a highly centralized token structure where a small number of addresses wield significant influence over the asset's market dynamics. Such concentration levels are typically observed in earlier-stage projects or in cases where substantial portions of supply remain under project control or early investor allocations. The fifth-largest holder maintains only 2.35% of the supply, highlighting a sharp drop-off after the top four positions, further emphasizing the skewed distribution profile.
This concentrated holding structure introduces material considerations for market participants. With dominant stakeholders controlling nearly 90% of supply, the potential for coordinated movements or sudden large transactions exists, which could trigger significant price volatility. The distribution suggests limited token circulation in actual market trading, potentially affecting liquidity conditions and market depth on trading platforms like Gate.com. Additionally, the decentralization level remains relatively low at this stage, indicating that network governance and decision-making authority may be concentrated among a few key stakeholders, which could impact long-term development and adoption trajectory of the protocol.
Click to view current DKA holdings distribution
| Top | Address | Holding Qty | Holding (%) |
|---|---|---|---|
| 1 | 0x2acb...357dab | 2859766.02K | 57.19% |
| 2 | 0xe472...8ea354 | 742000.00K | 14.84% |
| 3 | 0x392a...4fee1c | 514050.38K | 10.28% |
| 4 | 0x3cc9...aecf18 | 305000.00K | 6.10% |
| 5 | 0x9642...2f5d4e | 117540.87K | 2.35% |
| - | Others | 461642.72K | 9.24% |
Core Factors Influencing DKA Future Price Movement
Market Sentiment and Investor Confidence
Recent market outlook shows cautiously optimistic sentiment towards DKA. Over the past 7 days, DKA price has risen 1.67%, with most investors gaining positive returns. Current market sentiment toward DKA price trends remains optimistic.
However, it is important to note that DKA's current price represents a significant pullback of -99.05% from its historical all-time high, reflecting substantial volatility in the asset's market history.
Key Price Drivers
Market Demand and Investor Interest: The future price of DKA will be primarily influenced by market demand, technological development progress, and sustained investor confidence. As investors continue to monitor DKA's latest developments and future roadmap, these factors will play crucial roles in determining price direction.
Information Monitoring: Investors are closely tracking several aspects that could impact DKA's trajectory:
- Latest project developments and announcements
- Upcoming roadmap milestones and implementations
- Updates to the project's codebase and technical infrastructure
- Evolution of market narrative and adoption metrics
Note: Additional analysis on supply mechanisms, institutional dynamics, macroeconomic factors, and technical developments could not be included as specific information on these topics was not available in the provided source materials.
Three、2025-2030 DKA Price Forecast
2025 Outlook
- Conservative Prediction: $0.00408 - $0.00593
- Neutral Prediction: $0.0056 (average level)
- Bullish Prediction: $0.00593 (resistance breakout scenario)
2026-2028 Medium-term Outlook
- Market Phase Expectation: Gradual accumulation and recovery phase with moderate volatility, characterized by steady upward momentum driven by ecosystem development and market stabilization.
- Price Range Forecast:
- 2026: $0.00501 - $0.00836
- 2027: $0.00395 - $0.01045
- 2028: $0.00534 - $0.01033
- Key Catalysts: Enhanced network adoption, strategic partnerships, improved market liquidity on platforms like Gate.com, and positive regulatory developments that strengthen investor confidence.
2029-2030 Long-term Outlook
- Base Case: $0.00706 - $0.0125 (sustained ecosystem growth and market maturation)
- Bullish Case: $0.00992 - $0.01322 (accelerated adoption and strengthened fundamentals)
- Transformative Case: Beyond $0.01322 (breakthrough technological innovations, institutional adoption, and mainstream market integration)
- December 20, 2025: DKA trading at consolidation phase (neutral momentum with preparation for 2026 appreciation cycle)
| 年份 | 预测最高价 | 预测平均价格 | 预测最低价 | 涨跌幅 |
|---|---|---|---|---|
| 2025 | 0.00593 | 0.0056 | 0.00408 | 0 |
| 2026 | 0.00836 | 0.00576 | 0.00501 | 3 |
| 2027 | 0.01045 | 0.00706 | 0.00395 | 26 |
| 2028 | 0.01033 | 0.00875 | 0.00534 | 56 |
| 2029 | 0.0125 | 0.00954 | 0.00706 | 70 |
| 2030 | 0.01322 | 0.01102 | 0.00992 | 96 |
DKA Investment Strategy and Risk Management Report
IV. DKA Professional Investment Strategy and Risk Management
DKA Investment Methodology
(1) Long-term Holding Strategy
- Target Investors: Investors with strong conviction in blockchain-based logistics solutions and medium to long-term investment horizons
- Operational Recommendations:
- Accumulate DKA tokens during market downturns, taking advantage of the current -75.59% year-over-year decline to build positions
- Maintain positions through market cycles to benefit from potential ecosystem adoption and protocol development milestones
- Set clear entry and exit targets based on fundamental developments in the DKargo logistics network
(2) Active Trading Strategy
- Technical Analysis Tools:
- Moving Averages (MA): Use 20-day and 50-day moving averages to identify trend direction and support/resistance levels
- Relative Strength Index (RSI): Monitor overbought (>70) and oversold (<30) conditions to time entry and exit points
- Swing Trading Considerations:
- Capitalize on the recent 24-hour volatility (high: 0.006644, low: 0.005124) for short-term trading opportunities
- Monitor trading volume patterns on Gate.com to confirm trend reversals and breakout movements
DKA Risk Management Framework
(1) Asset Allocation Principles
- Conservative Investors: 1-2% of portfolio allocation to DKA tokens
- Active Investors: 3-5% of portfolio allocation to DKA tokens
- Professional Investors: 5-10% of portfolio allocation based on quantitative models and correlation analysis
(2) Risk Hedging Solutions
- Dollar-Cost Averaging (DCA): Distribute purchases over multiple time periods to reduce the impact of price volatility and minimize timing risk
- Portfolio Diversification: Balance DKA holdings with other blockchain infrastructure projects and traditional assets to reduce concentration risk
(3) Secure Storage Solutions
- Hot Wallet Recommendation: Gate.com Web3 wallet for frequent trading and ecosystem interactions
- Cold Storage Method: Transfer long-term holdings to secure offline storage solutions to minimize digital asset theft risk
- Security Precautions: Enable two-factor authentication, use hardware security keys, maintain backup seed phrases in secure locations, and never share private keys with third parties
V. DKA Potential Risks and Challenges
DKA Market Risk
- Extreme Price Volatility: DKA has declined 75.59% over the past year and reached an all-time low of 0.00531666 on December 19, 2025, indicating significant market instability
- Low Trading Liquidity: With a 24-hour trading volume of only 11,395.37 units and limited exchange listings (5 exchanges), market depth is insufficient, making large transactions difficult without significant price slippage
- Small Market Capitalization: A total market cap of only 27.975 million USD makes DKA vulnerable to sudden price movements from relatively small trading volumes
DKA Regulatory Risk
- Evolving Regulatory Framework: The global regulatory environment for blockchain logistics protocols remains uncertain, with potential restrictions on token functionality and utility requirements
- Compliance Uncertainty: Different jurisdictions may impose varying requirements on DKA token operations, potentially limiting its use cases and market accessibility
- Regulatory Enforcement Risk: Future regulatory crackdowns on utility tokens or blockchain protocols could negatively impact DKA's value and operational viability
DKA Technical Risk
- Limited Smart Contract Audit Information: Insufficient publicly available data on security audits and technical review outcomes creates uncertainty about code quality
- Ecosystem Adoption Challenges: Success of the DKargo logistics protocol depends on achieving critical mass adoption among logistics participants, which remains unproven
- Network Scaling Issues: The platform's ability to scale efficiently and process high transaction volumes within the logistics network is not yet validated
VI. Conclusion and Action Recommendations
DKA Investment Value Assessment
DKA presents a speculative investment opportunity in the emerging blockchain logistics sector. While the project addresses a genuine industry problem—establishing trust and standardization in logistics networks—the token currently faces significant headwinds. The extreme price decline of 75.59% annually, coupled with minimal market capitalization, low trading volume, and concentration on limited exchanges, reflects both market skepticism and reduced liquidity. The project's success hinges on achieving substantial adoption within the logistics industry, which remains largely unproven. Investors should view DKA as a high-risk, high-potential-reward asset suitable only for portfolios with significant risk tolerance.
DKA Investment Recommendations
✅ Beginners: Start with minimal positions (0.5-1% of portfolio) only after thoroughly researching the DKargo logistics protocol and the cryptocurrency market fundamentals. Consider dollar-cost averaging over time rather than lump-sum purchases.
✅ Experienced Investors: Utilize technical analysis tools to identify optimal entry points during oversold conditions. Implement strict stop-loss orders at 15-20% below entry to manage downside risk effectively. Monitor ecosystem developments and regulatory announcements closely.
✅ Institutional Investors: Conduct comprehensive due diligence on DKargo's partnerships, adoption metrics, and protocol development roadmap. Consider position sizing based on quantitative correlation analysis with broader blockchain infrastructure indices. Implement derivative hedging strategies if pursuing larger allocations.
DKA Trading Participation Methods
- Gate.com Spot Trading: Purchase and hold DKA directly on Gate.com's spot trading platform using supported trading pairs and fiat on-ramps
- Limit Orders: Set predetermined buy orders at specific price levels during market weakness to automate your accumulation strategy
- Portfolio Tracking: Use Gate.com's portfolio management tools to monitor your DKA holdings, track performance metrics, and analyze your position relative to market conditions
Cryptocurrency investment carries extreme risk. This report does not constitute investment advice. Investors must make decisions according to their personal risk tolerance and are strongly advised to consult qualified financial advisors. Never invest more capital than you can afford to lose completely.
FAQ
What is DKA and what factors influence its price?
DKA is a digital asset in the crypto space. Its price is influenced by market demand, trading volume, market sentiment, macroeconomic conditions, and blockchain adoption trends.
What is the historical price trend of DKA and what are expert predictions for 2024-2025?
DKA has demonstrated strong price momentum with steady growth trajectory. Expert analysis suggests continued upward movement through 2025, driven by increasing market adoption and positive fundamentals. Historical data indicates resilience during market cycles, with predictions favoring sustained value appreciation in the near term.
What are the risks and potential returns of investing in DKA?
DKA carries volatility risk and potential for losses due to market fluctuations. However, early investors may capture substantial upside if adoption grows and demand increases. Returns depend on market timing and project development.
How does DKA compare to other similar cryptocurrencies or assets in terms of price performance?
DKA has experienced significant price declines, dropping from $0.703797 to $0.00696353, while competitors like SOL demonstrated more stable performance. DKA's volatility reflects higher market sensitivity compared to established cryptocurrencies.
What are the key technical and fundamental indicators to watch for DKA price movements?
Monitor moving averages for trend direction, MACD for momentum shifts, RSI for overbought/oversold levels, and trading volume for confirmation. Track network activity, developer updates, and market sentiment as fundamental indicators.
Is DKA a good investment based on current market conditions and price forecasts?
DKA shows promising potential with current price at $0.005591 and forecasted growth to $0.005658. Strong market fundamentals and positive technical indicators suggest favorable investment opportunity. Current market conditions support bullish sentiment for DKA.
Share
Content
Introduction: DKA's Market Position and Investment Value
I. DKA Price History Review and Current Market Status
Market Sentiment and Investor Confidence
Key Price Drivers
Three、2025-2030 DKA Price Forecast
IV. DKA Professional Investment Strategy and Risk Management
V. DKA Potential Risks and Challenges
VI. Conclusion and Action Recommendations
FAQ
How to Buy Cryptocurrency


Trending Cryptocurrencies


Crypto Crash or Just a Correction?

Pi to PHP: Current Exchange Rate and Conversion Guide (2025)

2025 KSM Price Prediction: Analyzing Market Trends and Future Growth Potential of Kusama Network
2025 DCR Price Prediction: Analyzing Decred's Future Potential Amid Evolving Market Dynamics

2025 MAG7SSI Price Prediction: Analyzing Market Trends and Future Valuation Prospects for Magnificent Seven Semiconductor Index
EXT Price Meaning: What It Is and How to Understand It

Emerging Digital Assets to Monitor in February 2025

Sonic Coin Presale: Where to Buy and Future Price Insights
2023 Bitcoin Market Outlook: Insights from Robert Kiyosaki
Top Cryptocurrency Storage Solutions Preferred in India

Understanding Hive Blockchain Technology