2025 ETN Price Prediction: Expert Analysis and Market Forecast for Electroneum's Future Value

Introduction: ETN's Market Position and Investment Value
Electroneum (ETN), as a Layer 1 EVM-compatible blockchain serving over 4 million users worldwide, has established itself as a significant player in the blockchain ecosystem. Since its launch in 2017, Electroneum has achieved recognition for its high-speed transaction processing and energy-efficient architecture. As of December 2025, Electroneum's market capitalization has reached approximately $27.77 million, with a circulating supply of around 17.98 billion ETN tokens, trading at approximately $0.0013. This innovative blockchain platform, renowned for its "5-second transaction speed with instant finality," is playing an increasingly critical role in supporting decentralized applications and financial services on a global scale.
This article will conduct a comprehensive analysis of Electroneum's price trajectory from 2025 to 2030, integrating historical patterns, market supply and demand dynamics, ecosystem development, and macroeconomic factors to provide investors with professional price forecasts and practical investment strategies for navigating the cryptocurrency market.
I. ETN Price History Review and Market Status
ETN Historical Price Evolution
- April 2024: Reached all-time high (ATH) of $0.01, marking a significant peak in ETN's market performance.
- December 2025: Reached all-time low (ATL) of $0.0012527 on December 9, 2025, reflecting substantial price decline over the year.
- Annual Performance: ETN experienced a sharp decline of -55.27% over the past year, demonstrating significant bearish pressure on the token's valuation.
ETN Current Market Status
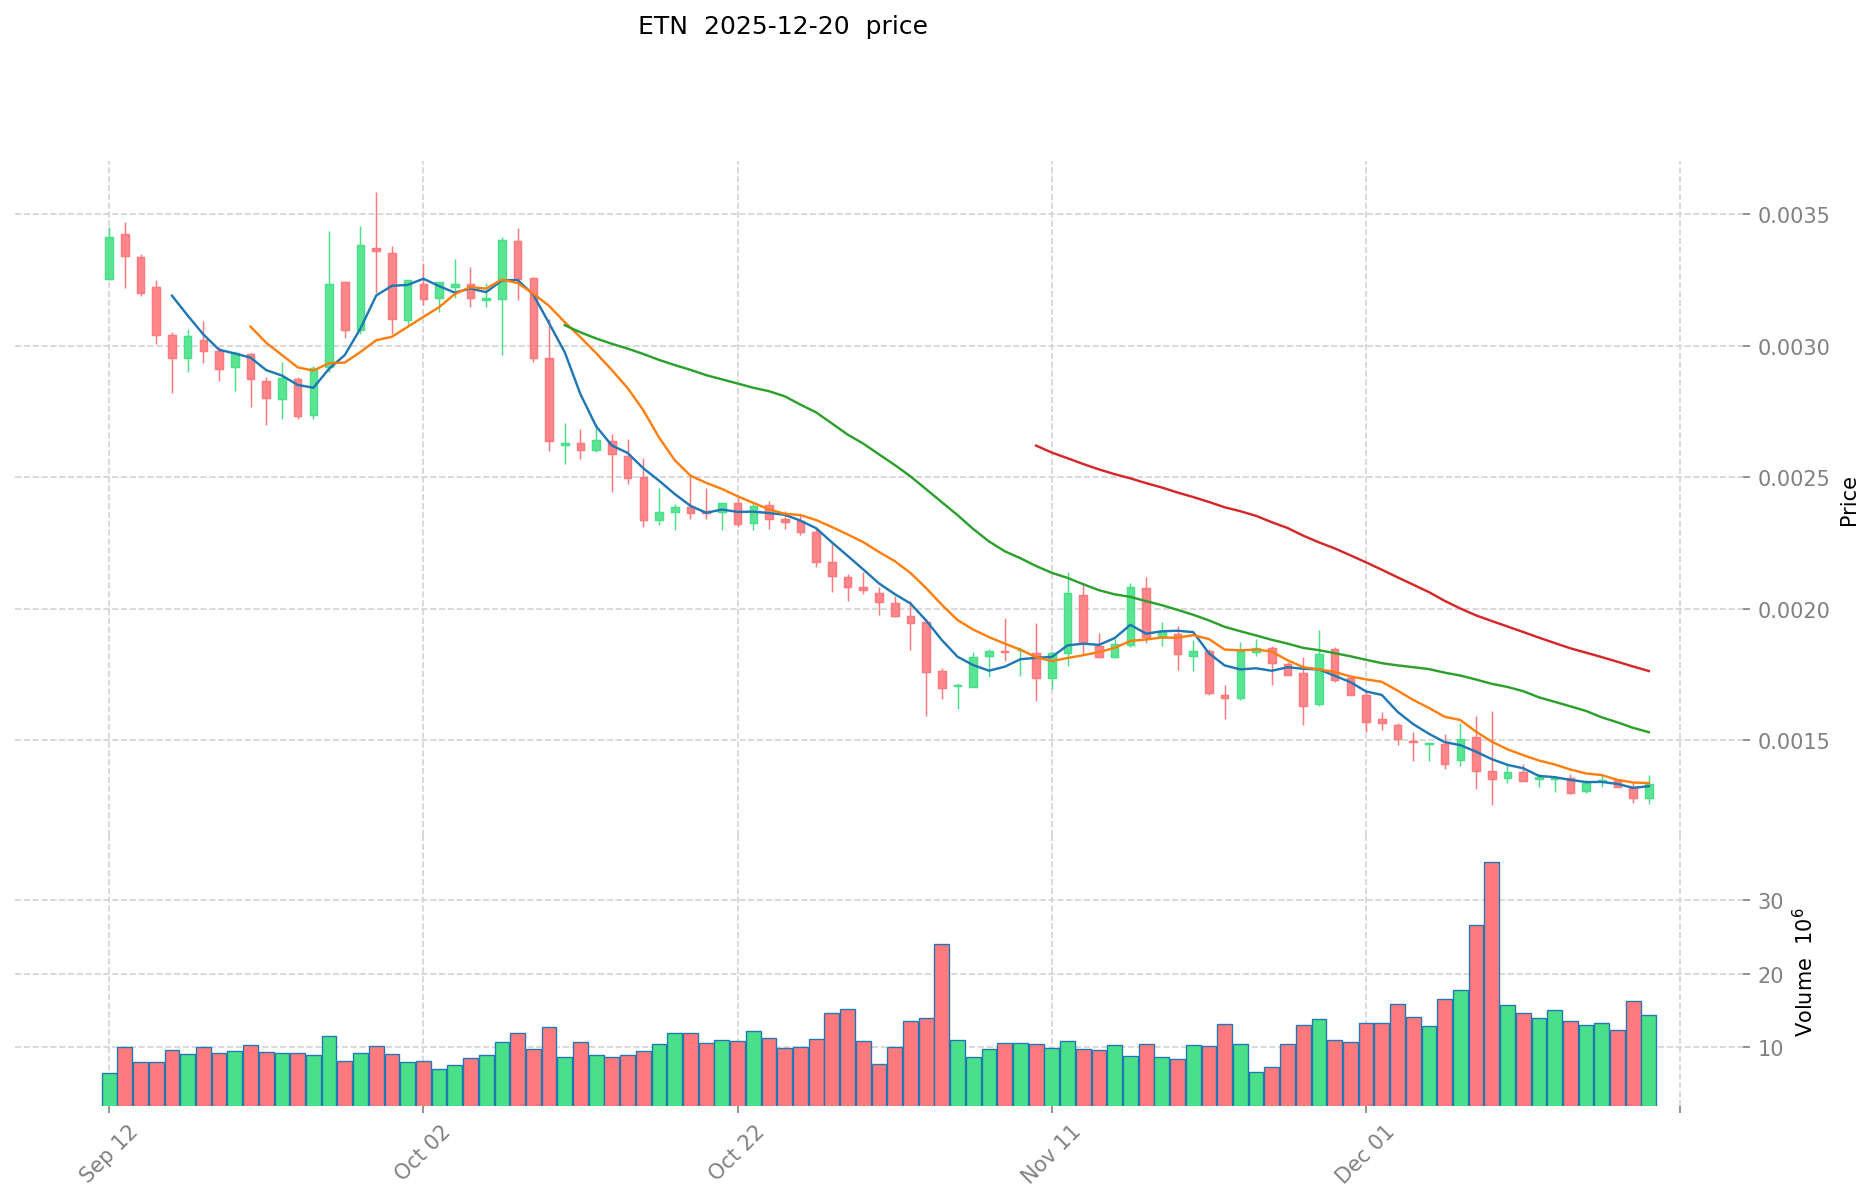
As of December 20, 2025, ETN is trading at $0.0013223, with a 24-hour trading volume of $18,807.90. The token demonstrates moderate daily volatility, having recorded a 24-hour price change of +3.33%, with intraday fluctuations between a high of $0.00137 and a low of $0.001257.
The current market capitalization stands at $23,774,712.82, while the fully diluted valuation reaches $27,768,300. ETN maintains a circulating supply of 17,979,817,604.56 tokens out of a total and maximum supply of 21,000,000,000 tokens, representing a circulation ratio of approximately 85.62%.
Market sentiment indicates extreme fear, with a current VIX level of 20. ETN ranks 799th among all cryptocurrencies by market capitalization. The token maintains a market dominance of 0.00087%, reflecting its relatively small share of the overall cryptocurrency market.
Click to view the current ETN market price
ETN Market Sentiment Index
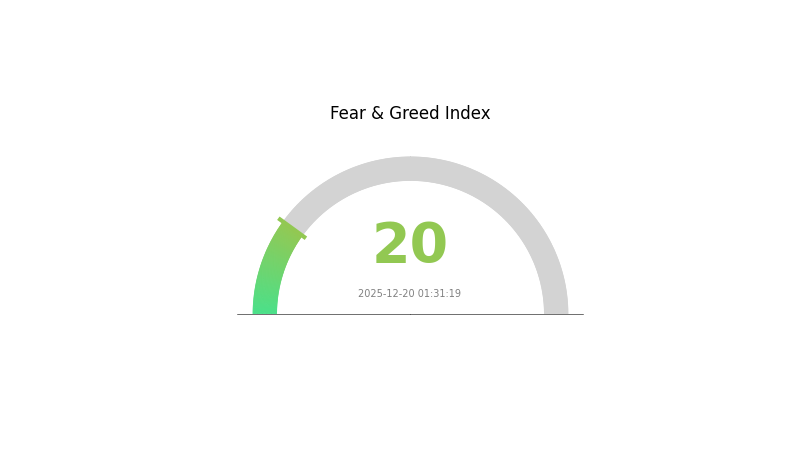
2025-12-20 Fear and Greed Index: 20 (Extreme Fear)
Click to view current Fear & Greed Index
The cryptocurrency market is experiencing extreme fear, with the Fear and Greed Index dropping to 20. This indicates significant market pessimism and risk aversion among investors. During such periods, market volatility typically increases, presenting both challenges and opportunities. Conservative investors may adopt a cautious stance, while experienced traders might view this as a potential entry point for long-term positioning. Monitor key support levels closely and manage risk exposure carefully. Consider using Gate.com's market analysis tools to track sentiment shifts in real-time.
ETN Holdings Distribution
Click to view current ETN holdings distribution
The address holdings distribution chart provides a visual representation of how token ownership is concentrated across different wallet addresses within the ETN network. This metric is fundamental to understanding the decentralization level and potential systemic risks associated with token concentration. By analyzing the distribution of holdings across top addresses, investors and analysts can assess whether the token ecosystem maintains a healthy degree of decentralization or faces vulnerabilities from concentrated ownership structures.
At present, the available data indicates a distribution pattern that requires careful interpretation regarding market concentration risk. A well-distributed token ecosystem typically demonstrates holdings spread across numerous addresses with no single entity controlling an excessive percentage. The current state of ETN's address distribution should be evaluated against industry benchmarks to determine whether concentration levels pose risks to price stability or governance integrity. Highly concentrated holdings among a limited number of addresses can create vulnerability to sudden market movements triggered by large token transfers or sell-offs from major holders.
The structural characteristics reflected in the current address distribution reveal important insights into ETN's decentralization posture and on-chain stability. A balanced distribution pattern indicates a more resilient market structure less susceptible to manipulation, while excessive concentration could signal potential volatility risks and reduced resilience during periods of market stress. Understanding these distribution dynamics is essential for stakeholders seeking to evaluate the long-term viability and market integrity of the ETN ecosystem.

| Top | Address | Holding Qty | Holding (%) |
|---|
II. Core Factors Affecting ETN's Future Price
Supply Mechanism
-
Staking Rate Impact: When the staking rate exceeds 30% of circulating supply, it will restrict liquidity flow, thereby amplifying volatility in both directions.
-
Exchange Reserve Depletion: Since late 2021, exchange reserves of digital assets have shown a persistent downward trend, continuing through 2023-2024, indicating potential supply shortages that could support price appreciation.
-
Current Impact: The reduction in exchange reserves combined with increased staking activity creates a tightening supply dynamic that may provide structural support for price levels.
Macroeconomic Environment
-
Central Bank Policy Impact: The U.S. Federal Reserve's policy stance significantly influences ETN valuations. In May 2025, the FOMC maintained interest rates unchanged, and market expectations for potential future rate cuts have intensified, potentially creating a "risk-on" environment favorable for alternative assets.
-
Inflation Hedging Properties: ETN instruments, when tracking inflation-sensitive assets, can provide protection against inflationary pressures in macroeconomic environments characterized by monetary expansion or currency depreciation concerns.
-
Geopolitical Factors: International geopolitical tensions and economic uncertainty drive demand for alternative investment vehicles like ETNs as portfolio diversification tools.
Technology Development and Ecosystem Building
-
Network Upgrades: Major blockchain network upgrades (such as protocol improvements) significantly enhance network efficiency, user experience, and ecosystem scalability. These upgrades often attract increased institutional participation and improve transaction economics.
-
Layer 2 Ecosystem Expansion: Layer 2 solutions reduce transaction costs and improve processing speed, with total locked value in Layer 2 networks reaching approximately $43 billion USD as of mid-May 2025, demonstrating robust ecosystem growth.
-
DeFi Ecosystem Resilience: The underlying blockchain's DeFi ecosystem maintains significant market share, with total value locked (TVL) showing notable growth in 2025, and the network maintaining leadership in real-world asset (RWA) tokenization.
Three、2025-2030 ETN Price Forecast
2025 Outlook
- Conservative Forecast: $0.00122 - $0.00132
- Neutral Forecast: $0.00132
- Bullish Forecast: $0.00143 (requiring sustained market stability and positive sentiment)
2026-2027 Mid-term Outlook
- Market Phase Expectation: Gradual recovery phase with moderate volatility, characterized by incremental adoption and ecosystem development
- Price Range Forecast:
- 2026: $0.00077 - $0.00164
- 2027: $0.00116 - $0.00200
- Key Catalysts: Regulatory clarity, increased institutional participation, technological upgrades, and growing utility in decentralized finance applications
2028-2030 Long-term Outlook
- Base Case: $0.00160 - $0.00219 (assuming continued market maturation and mainstream adoption acceleration)
- Bullish Scenario: $0.00225 - $0.00253 (contingent on breakthrough partnerships, significant protocol enhancements, and macroeconomic tailwinds)
- Transformational Scenario: $0.00253+ (under conditions of mass market adoption, regulatory approval frameworks, and integration into major financial infrastructure)
Note: These projections are based on historical trend analysis and should be regularly reviewed on Gate.com and other market data sources as new information emerges. Investment decisions should incorporate comprehensive risk assessment and personal financial objectives.
| 年份 | 预测最高价 | 预测平均价格 | 预测最低价 | 涨跌幅 |
|---|---|---|---|---|
| 2025 | 0.00143 | 0.00132 | 0.00122 | 0 |
| 2026 | 0.00164 | 0.00137 | 0.00077 | 3 |
| 2027 | 0.002 | 0.00151 | 0.00116 | 13 |
| 2028 | 0.00219 | 0.00175 | 0.0016 | 32 |
| 2029 | 0.00253 | 0.00197 | 0.00126 | 49 |
| 2030 | 0.00232 | 0.00225 | 0.00133 | 70 |
Electroneum (ETN) Professional Investment Strategy and Risk Management Report
IV. ETN Professional Investment Strategy and Risk Management
ETN Investment Methodology
(1) Long-term Holding Strategy
- Suitable Investors: Long-term believers in Layer 1 blockchain infrastructure, users of the AnyTask.com ecosystem, and those seeking exposure to EVM-compatible chains with low transaction costs.
- Operation Recommendations:
- Dollar-cost averaging (DCA): Invest fixed amounts regularly to reduce timing risk given ETN's volatility (-55.27% over 1 year).
- Accumulation during market downturns: The recent ATL of $0.0012527 (December 9, 2025) presents potential entry opportunities for long-term holders.
- Portfolio rebalancing: Periodically review holdings relative to your overall crypto allocation to maintain target exposure levels.
(2) Active Trading Strategy
- Technical Analysis Considerations:
- Price volatility patterns: Monitor the 24-hour range ($0.001257-$0.00137) and 7-day trends (-2.17%) for short-term trading signals.
- Volume analysis: Track the 24-hour volume of $18,807.89 to identify breakout opportunities and validate trend reversals.
- Wave Trading Key Points:
- Entry signals: Consider positions near support levels established at historical lows.
- Exit strategies: Set profit-taking targets at resistance levels near the historical high of $0.01.
ETN Risk Management Framework
(1) Asset Allocation Principles
- Conservative Investors: 0.5-1% of total portfolio allocation
- Active Investors: 1-3% of total portfolio allocation
- Professional Investors: 3-5% of total portfolio allocation
(2) Risk Hedging Solutions
- Position sizing: Limit individual trades to maintain overall portfolio stability given ETN's small market cap ($27.77 million) and limited liquidity relative to major cryptocurrencies.
- Diversification strategy: Balance ETN holdings with more established Layer 1 blockchains to reduce concentration risk in emerging networks.
(3) Secure Storage Solutions
- Hot Wallet Solution: Gate.com's Web3 wallet for active traders requiring frequent transactions and ecosystem interactions.
- Cold Storage Approach: For long-term holders, consider storing ETN in secure, offline environments with proper backup procedures.
- Security Precautions: Enable two-factor authentication on all exchange accounts, use strong passwords, maintain private key backups in secure locations, and never share seed phrases or private keys with third parties.
V. ETN Potential Risks and Challenges
ETN Market Risks
- Low liquidity: With only 7 exchange listings and relatively modest trading volume, ETN faces limited liquidity that could result in significant slippage on larger trades.
- Market capitalization concerns: At $27.77 million fully diluted valuation, ETN remains a micro-cap asset vulnerable to whale manipulation and sudden price swings.
- Adoption uncertainty: Despite serving 4+ million users, the project's market performance (-55.27% yearly decline) suggests challenges in converting user base into sustained demand.
ETN Regulatory Risks
- Evolving regulatory landscape: As jurisdictions worldwide implement stricter cryptocurrency regulations, emerging Layer 1 blockchains face potential compliance challenges.
- Exchange listing pressure: Changes in regulatory requirements could impact the limited number of exchanges (7) where ETN trades, potentially affecting accessibility.
- Jurisdictional exposure: The project's global operations expose it to varying regulatory standards across different countries.
ETN Technical Risks
- Network security: While IBFT consensus is established, validator diversity remains limited with focus on universities and Web3 infrastructure companies, potentially creating centralization risks.
- Smart contract vulnerabilities: The platform's low fee model may attract developers with varying security standards, increasing smart contract risk exposure.
- Scalability sustainability: Long-term performance of the 5-second transaction speed under increased network load requires continuous monitoring.
VI. Conclusion and Action Recommendations
ETN Investment Value Assessment
Electroneum presents an interesting but high-risk opportunity as an EVM-compatible Layer 1 blockchain with real-world utility through AnyTask.com. The network's technical advantages (5-second transactions, low fees, energy efficiency) address genuine market needs. However, the significant year-over-year price decline (-55.27%), limited market capitalization, and modest trading volume indicate substantial adoption and liquidity challenges. The project operates in an increasingly competitive Layer 1 landscape, and its success depends heavily on ecosystem expansion and sustained user growth.
ETN Investment Recommendations
✅ Beginners: Start with small allocations (0.5% portfolio max) through dollar-cost averaging on Gate.com. Use this as an educational exposure to Layer 1 blockchain infrastructure without risking significant capital.
✅ Experienced Investors: Consider tactical positions during market weakness, particularly near the recent ATL level. Actively monitor ecosystem developments, AnyTask.com adoption metrics, and validator network expansion for risk management.
✅ Institutional Investors: Evaluate ETN within the broader Layer 1 competitive landscape. Large positions face significant liquidity constraints given the 7-exchange limitation and modest trading volume. Consider partnerships or direct blockchain participation rather than secondary market accumulation.
ETN Trading Participation Methods
- Spot Trading: Purchase ETN directly on Gate.com using various trading pairs and hold in your Gate.com account or withdraw to secure wallets.
- Portfolio Tracking: Monitor real-time price movements, historical trends, and ecosystem developments through Gate.com's trading interface and analytical tools.
- Limit Orders: Implement disciplined entry and exit strategies using limit orders to manage prices around established support and resistance levels.
Cryptocurrency investments carry extreme risk and volatility. This report does not constitute investment advice. Investors must make decisions based on their individual risk tolerance and financial situation. It is strongly recommended to consult with professional financial advisors before making significant investment decisions. Never invest more than you can afford to lose completely. The cryptocurrency market remains unpredictable, and past performance does not guarantee future results.
FAQ
What is the price prediction for ETN in 2025?
Based on current analysis, ETN price prediction for 2025 ranges between $0.0019 and $0.0056, with an average expected price of $0.0034. This forecast reflects market trends and technical analysis of Electroneum's performance.
How much is ETN coin worth today?
As of today, ETN coin is worth $0.001277. This represents a 0.4% increase from an hour ago, though it has declined 3.0% compared to yesterday. The overall trend shows a 5.0% decrease from its recent highs.
What is the stock price forecast for ETN?
Based on current market trends, ETN is expected to reach $320.66 per share by January 17, 2026, representing an anticipated increase of 1.49%. This forecast reflects ongoing market momentum and technical analysis of the asset.
Share
Content
Introduction: ETN's Market Position and Investment Value
I. ETN Price History Review and Market Status
II. Core Factors Affecting ETN's Future Price
Three、2025-2030 ETN Price Forecast
IV. ETN Professional Investment Strategy and Risk Management
V. ETN Potential Risks and Challenges
VI. Conclusion and Action Recommendations
FAQ
How to Buy Cryptocurrency


Trending Cryptocurrencies


Viction's Whitepaper Logic: Driving 75.6% Growth with Zero-Gas Innovations in 2025

Will Crypto Recover in 2025?
XLM Crypto Price: Can Stellar Lumens Hit A$1?
Power Ledger Crypto: Can POWR Energize a Bullish Comeback?
2025 NEAR Price Prediction: A Comprehensive Analysis of Factors Driving the Next Bull Run in the NEAR Protocol Ecosystem

2025 MNTPrice Prediction: Market Analysis and Potential Growth Factors for Mantle Network Token

How Does Macroeconomic Policy Impact Crypto Markets and ASTER Token Price in 2025?

What Are the Major Smart Contract Vulnerabilities and Security Risks in Crypto Exchanges Like SHIB?
What is Dogecoin (DOGE) fundamentals: whitepaper logic, use cases, and technical innovation explained
How Does Dogecoin (DOGE) Price Volatility Compare to Bitcoin with 70-80% Correlation?

What are the regulatory risks and compliance requirements for cryptocurrency exchanges in 2025?