2025 ICNT Price Prediction: Expert Analysis and Market Forecast for the Coming Year

Introduction: ICNT's Market Position and Investment Value
Impossible Cloud Network Token (ICNT) serves as the native token of an open, permissionless, and composable cloud ecosystem designed to replace legacy platforms like AWS with decentralized enterprise-grade storage, compute, and bandwidth. As of December 2025, ICNT has achieved a market capitalization of approximately $71.75 million, with circulating supply of 187.6 million tokens, and maintains a price of around $0.38. This innovative asset, recognized as a "scalable Web3 infrastructure pioneer," is playing an increasingly critical role in enabling decentralized enterprise-grade cloud services across 140 countries with 29,000+ nodes.
The Impossible Cloud Network ecosystem has demonstrated remarkable operational traction, generating over $7 million in annual recurring revenue (ARR) through services delivered to 1,000+ enterprise clients, reflecting 2,000% year-over-year growth. With backing from top-tier investors including 1kx, No Limit Holdings, Protocol Labs, NGP Capital, and HV Capital, and a fully-diluted valuation of $470 million, ICNT represents a compelling opportunity in the Web3 infrastructure space.
This article will provide a comprehensive analysis of ICNT's price trajectory through 2030, combining historical patterns, market supply and demand dynamics, ecosystem development milestones, and macroeconomic factors to deliver professional price forecasts and practical investment strategies for investors interested in this emerging cloud infrastructure token.
ICNT Market Analysis Report
I. ICNT Price History Review and Current Market Status
ICNT Historical Price Evolution
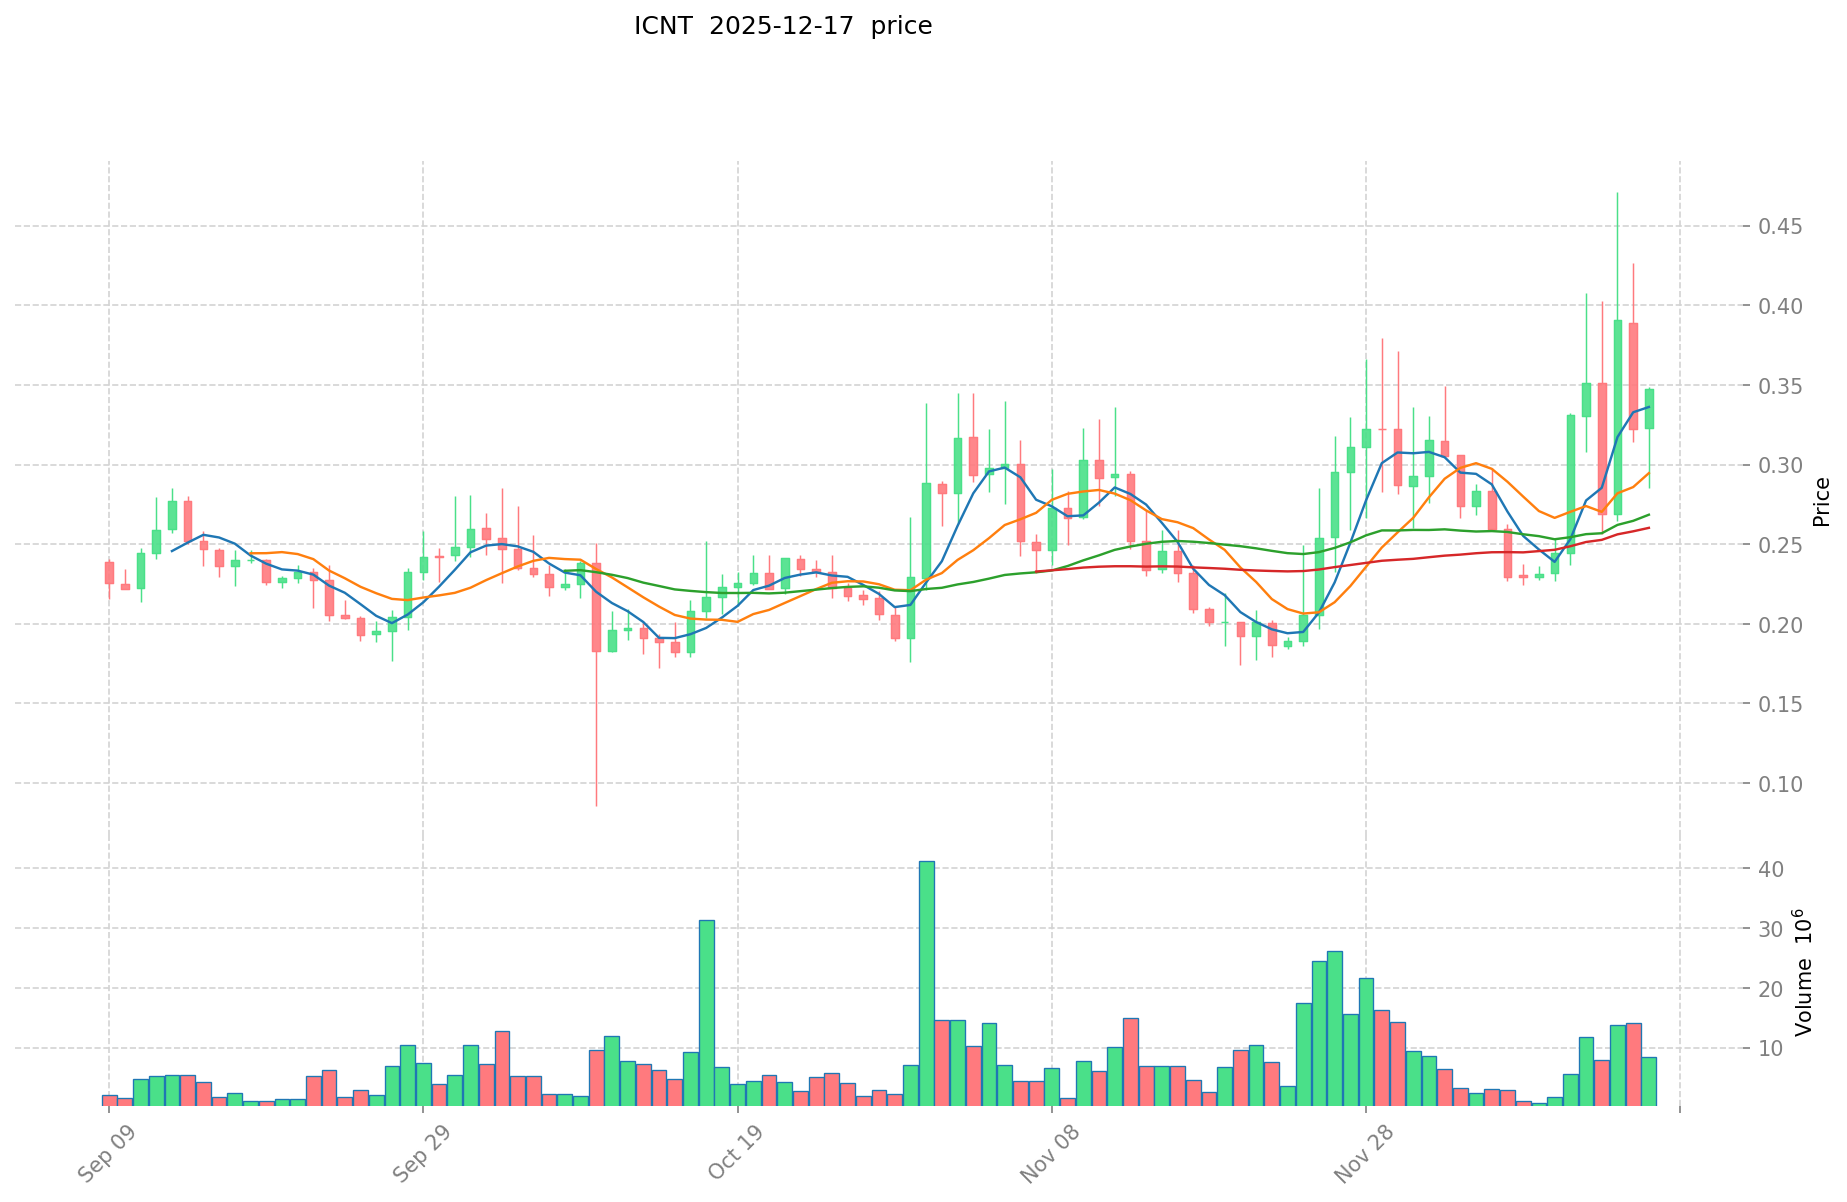
ICNT reached its all-time high (ATH) of $0.625 on July 3, 2025, marking a significant peak in its trading history. Subsequently, the token experienced a substantial correction, reaching its all-time low (ATL) of $0.0859 on October 10, 2025. This represents a considerable price discovery period as the market adjusted valuations for the Impossible Cloud Network token.
ICNT Current Market Dynamics
As of December 18, 2025, ICNT is trading at $0.38248, positioning it at a market capitalization of approximately $71.75 million against a fully-diluted valuation (FDV) of $267.74 million. The token commands a market dominance of 0.0086%, with a circulating supply of 187.6 million tokens out of a total supply of 700 million tokens.
Recent Price Performance:
- 1-hour change: -2.3%
- 24-hour change: +28.62% (trading range: $0.29393 to $0.41904)
- 7-day change: +53.36%
- 30-day change: +78.56%
The token demonstrates robust short-term momentum, with substantial gains over the past month. The 24-hour trading volume stands at approximately $5.24 million across 14 exchanges, indicating active market participation. The current sentiment environment reflects "Extreme Fear" with a VIX level of 16.
Click to view current ICNT market price
ICNT Market Sentiment Index
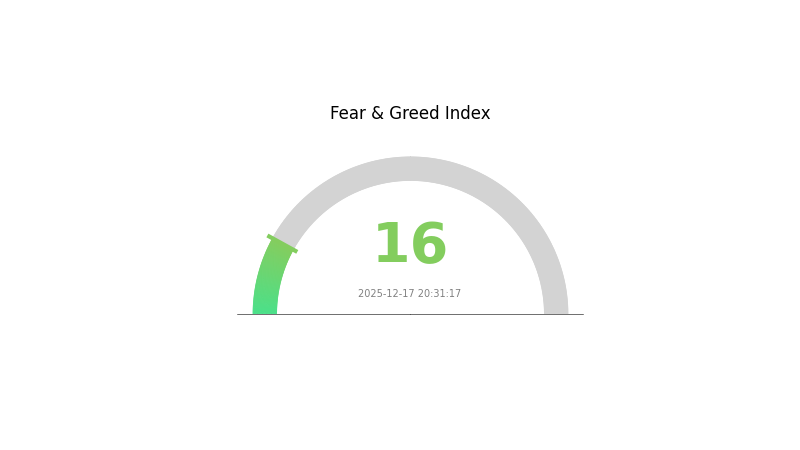
2025-12-17 Fear and Greed Index: 16 (Extreme Fear)
Click to view current Fear & Greed Index
The cryptocurrency market is currently experiencing extreme fear, with the Fear and Greed Index plummeting to 16. This sentiment reading indicates significant market pessimism and heightened investor anxiety. When fear reaches such extreme levels, it often signals potential market bottoms and creates opportunities for contrarian investors. Market participants should exercise caution while monitoring for potential entry points. Consider diversifying your portfolio and staying informed through reliable data sources like Gate.com to make informed trading decisions during this volatile period.
ICNT Holdings Distribution
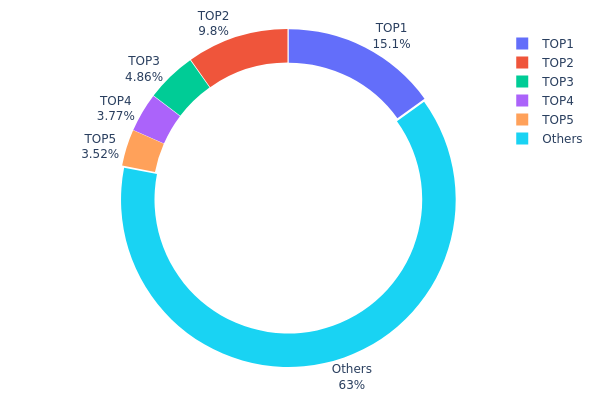
The address holdings distribution chart illustrates how ICNT tokens are allocated across different wallet addresses on the blockchain, serving as a critical indicator of token concentration and decentralization. This metric reveals the ownership structure and potential market dynamics by analyzing the proportion of total supply held by individual addresses.
Current analysis of ICNT's concentration metrics indicates a moderately distributed token structure. The top five addresses collectively hold approximately 37% of the circulating supply, with the largest holder commanding 15.06% of all tokens. While this concentration level warrants attention, the distribution does not suggest extreme centralization, as the remaining 63% of tokens are dispersed across numerous other addresses. The second-largest holder maintains a 9.79% position, followed by progressively smaller stakes among the top-five addresses. This gradual decline in holding percentages suggests a relatively balanced distribution pattern rather than oligopolistic control.
The current holdings distribution reflects a market structure characterized by moderate decentralization with identifiable large stakeholders. The presence of substantial individual positions introduces potential volatility considerations, as significant token movements from top holders could impact market liquidity and price stability. However, the majority of tokens remaining in the hands of dispersed address holders suggests a diverse investor base. This configuration indicates a transitional market phase where ICNT maintains reasonable decentralization characteristics while remaining susceptible to coordinated actions by major stakeholders. The overall structure demonstrates neither extreme fragmentation nor dangerous concentration, positioning ICNT within acceptable parameters for market health and participant confidence.
Click to view current ICNT holdings distribution
| Top | Address | Holding Qty | Holding (%) |
|---|---|---|---|
| 1 | 0xe1c7...6aa02c | 102198.62K | 15.06% |
| 2 | 0x2a86...251414 | 66500.00K | 9.79% |
| 3 | 0x42e2...27cf8b | 32959.27K | 4.85% |
| 4 | 0x8f7c...03c50e | 25596.67K | 3.77% |
| 5 | 0x2753...728523 | 23862.81K | 3.51% |
| - | Others | 427481.84K | 63.02% |
II. Core Factors Influencing ICNT's Future Price
Market Sentiment and Technical Formation
-
Convergence Breakout Pattern: ICNT is currently exhibiting a convergence breakout formation at the price level of $0.42, suggesting significant upside potential. This technical pattern indicates that a major directional move may be imminent.
-
Upside Imagination: Market analysis indicates relatively large room for upside imagination, making ICNT a candidate worth monitoring during market downturns or consolidation periods.
Macro Market Environment
-
Cryptocurrency Market Volatility: ICNT's price movement is significantly influenced by broader cryptocurrency market trends. Current market conditions show traders adopting cautious strategies following recent liquidations totaling $289 million across the market over a 24-hour period.
-
Market Sentiment Factors: ICNT's price is subject to general crypto market sentiment, investor confidence levels, and the performance of leading assets such as Bitcoin and Ethereum, which currently face downward pressure within larger technical formations.
Community and Project Dynamics
- Community Activity: ICNT's future price performance will be influenced by community engagement levels, project developments, and ecosystem expansions, which remain key drivers for altcoin valuations in the current market environment.
III. 2025-2030 ICNT Price Forecast
2025 Outlook
- Conservative Forecast: $0.3713-$0.3827
- Neutral Forecast: $0.3827-$0.4500
- Bullish Forecast: $0.5626 (requiring sustained market momentum and positive ecosystem developments)
2026-2027 Mid-term Outlook
- Market Stage Expectation: Consolidation phase with gradual appreciation as adoption expands and market confidence strengthens
- Price Range Forecast:
- 2026: $0.3167-$0.5861
- 2027: $0.5082-$0.6935
- Key Catalysts: Increased institutional adoption, strategic partnership announcements, expansion of use cases within the ICNT ecosystem, and overall market sentiment improvements
2028-2030 Long-term Outlook
- Base Case Scenario: $0.3241-$0.6665 (assuming steady market growth and continued development of core functionalities)
- Bullish Scenario: $0.5687-$0.6773 (assuming accelerated mainstream adoption and positive regulatory environment)
- Transformational Scenario: $0.8490 (assuming breakthrough technological innovations, major institutional inflows, and significant expansion into new markets)
- 2030-12-31: ICNT projected at $0.8490 (representing 73% cumulative appreciation from 2025 baseline, reflecting sustained bullish momentum)
| 年份 | 预测最高价 | 预测平均价格 | 预测最低价 | 涨跌幅 |
|---|---|---|---|---|
| 2025 | 0.56263 | 0.38274 | 0.37126 | 1 |
| 2026 | 0.58613 | 0.47268 | 0.3167 | 24 |
| 2027 | 0.69352 | 0.52941 | 0.50823 | 39 |
| 2028 | 0.6665 | 0.61146 | 0.32408 | 61 |
| 2029 | 0.67732 | 0.63898 | 0.56869 | 68 |
| 2030 | 0.84901 | 0.65815 | 0.42122 | 73 |
ICNT Investment Analysis Report
IV. ICNT Professional Investment Strategy and Risk Management
ICNT Investment Methodology
(1) Long-term Holding Strategy
- Suitable investors: Infrastructure-focused investors, Web3 believers, and those seeking exposure to decentralized cloud computing
- Operational suggestions:
- Accumulate ICNT during market pullbacks, targeting entry points below $0.35
- Hold through network expansion phases as ARR continues its 2,000% YoY growth trajectory
- Monitor quarterly updates on enterprise client additions and storage capacity expansion
(2) Active Trading Strategy
- Technical analysis tools:
- Moving averages (MA20/MA50): Identify trend direction and support/resistance levels
- RSI indicator: Signal overbought conditions above 70 and oversold conditions below 30
- Wave trading key points:
- Capitalize on the recent 53.36% seven-day surge; consider profit-taking at resistance levels
- Watch for consolidation patterns after significant rallies before entering new positions
- Set stop-losses at 10-15% below entry points to manage downside risk
ICNT Risk Management Framework
(1) Asset Allocation Principles
- Conservative investors: 2-3% of portfolio
- Aggressive investors: 5-8% of portfolio
- Professional investors: 8-15% of portfolio
(2) Risk Hedging Solutions
- Diversification strategy: Combine ICNT holdings with established Layer 1 and Layer 2 tokens to reduce concentration risk
- Dollar-cost averaging (DCA): Deploy capital across multiple months to mitigate timing risk and smooth entry prices
(3) Secure Storage Solutions
- Hot wallet solution: Gate.com Web3 Wallet for active trading and frequent transactions
- Cold storage approach: Hardware wallets for long-term holdings beyond 12 months
- Security best practices: Enable two-factor authentication, use hardware wallet for storing above 50% of holdings, and never share private keys or recovery phrases
V. ICNT Potential Risks and Challenges
ICNT Market Risk
- Market volatility: ICNT experienced a 38% decline from ATH ($0.625 on July 3, 2025), indicating significant price fluctuation in nascent market conditions
- Liquidity risk: With $5.2M in 24-hour volume across only 14 exchanges, larger trades may experience slippage
- Competitive pressure: Emerging competitors in decentralized infrastructure may fragment market share and reduce ICNT's value proposition
ICNT Regulatory Risk
- Jurisdictional uncertainty: Decentralized storage networks may face regulatory scrutiny in different regions, affecting operational scope
- Compliance burden: As enterprise adoption grows, regulatory requirements for data handling and privacy could increase operational costs
- Classification ambiguity: Unclear regulatory treatment of ICNT as utility vs. security token in different markets
ICNT Technology Risk
- Network scalability challenges: Rapid expansion to 250PB+ storage globally requires robust infrastructure; execution delays could impact growth
- Node reliability: Performance depends on 29,000+ distributed nodes; node failures or geographic clustering could create bottlenecks
- Competition from established solutions: AWS and cloud giants possess massive infrastructure advantages and brand recognition
VI. Conclusion and Action Recommendations
ICNT Investment Value Assessment
ICNT represents a compelling opportunity in the decentralized infrastructure space, backed by strong fundamentals including $7M+ ARR with 2,000% YoY growth, 1,000+ enterprise clients, and investments from top-tier funds (NGP Capital, 1kx, Protocol Labs). The 26.8% circulating supply ratio and $267.7M FDV suggest reasonable valuation for a project at this development stage. However, the 38% decline from ATH highlights execution risks and market volatility typical of early-stage infrastructure projects.
ICNT Investment Recommendations
✅ Beginners: Start with small positions (1-2% of portfolio) via dollar-cost averaging on Gate.com; focus on understanding ICN's competitive advantages in enterprise storage before increasing exposure
✅ Experienced investors: Build core position during market weakness below $0.33; actively monitor ARR growth and enterprise client metrics; rebalance quarterly based on network development milestones
✅ Institutional investors: Consider allocating 5-10% to infrastructure thematic; structure positions with multi-month accumulation; engage directly with ICN protocol for partnership opportunities
ICNT Trading Participation Methods
- Spot trading on Gate.com: Direct ICNT/USDT pairs with institutional-grade trading tools and real-time market data
- Gate.com Web3 Wallet integration: Seamless token transfers and on-chain interactions for yield-generating opportunities as ecosystem matures
- Dollar-cost averaging programs: Automated recurring purchases to build positions systematically while reducing timing risk
Cryptocurrency investment carries extreme risk. This report does not constitute investment advice. Investors must make decisions based on personal risk tolerance and should consult professional financial advisors. Never invest more than you can afford to lose.
FAQ
Can onyxcoin hit $1?
Based on current market analysis, onyxcoin is unlikely to reach $1. Price prediction algorithms estimate a maximum of $0.1477 by 2050. Market fundamentals and growth projections do not support reaching $1 in foreseeable timeframe.
Can ICP reach $1000?
Yes, ICP can reach $1000 through significant token burning and market growth. This would require approximately 192x appreciation from current levels, achievable through increased adoption, ecosystem development, and reduced circulating supply.
What will QNT be worth in 2030?
Based on current market analysis, Quant (QNT) is predicted to reach between $101.21 and $190.35 by 2030. The exact value depends on market adoption and network development.
Does icx have a future?
ICON (ICX) maintains active development and community support. While currently facing bearish market conditions, the project continues evolving with technological improvements. ICX's future depends on broader crypto adoption and market recovery trends in coming years.
Share
Content
Introduction: ICNT's Market Position and Investment Value
I. ICNT Price History Review and Current Market Status
II. Core Factors Influencing ICNT's Future Price
III. 2025-2030 ICNT Price Forecast
IV. ICNT Professional Investment Strategy and Risk Management
V. ICNT Potential Risks and Challenges
VI. Conclusion and Action Recommendations
FAQ
How to Buy Cryptocurrency


Trending Cryptocurrencies


XZXX: A Comprehensive Guide to the BRC-20 Meme Token in 2025

Bitcoin Fear and Greed Index: Market Sentiment Analysis for 2025
Top Crypto ETFs to Watch in 2025: Navigating the Digital Asset Boom
5 ways to get Bitcoin for free in 2025: Newbie Guide

Bitcoin Market Cap in 2025: Analysis and Trends for Investors

2025 Bitcoin Price Prediction: Trump's Tariffs' Impact on BTC

What is VIRTUAL Token's Current Market Cap, Price, and Trading Volume in 2025?

How Does Fed Policy and Inflation Data Impact Cryptocurrency Prices in 2025?

What are the compliance and regulatory risks of PEPE crypto in 2025?

What Are Technical Indicators: How to Use MACD, RSI, and Moving Averages for Crypto Trading in 2025

What is AIOT Price Volatility: Historical Trends, Support and Resistance Levels in 2025?