2025 KOMA Price Prediction: Expert Analysis and Market Forecast for the Year Ahead


Introduction: KOMA's Market Position and Investment Value
Koma Inu (KOMA), a dog-themed token built around community-driven decentralization and charity, has emerged as a distinctive asset in the cryptocurrency landscape. As of December 23, 2025, KOMA has achieved a market capitalization of $5,908,660.90 with a circulating supply of approximately 605,954,353.43 tokens, while maintaining a price point of $0.009751. Positioned as the son of Shib and protector of BNB, this token represents a unique proposition in the meme coin sector with a focus on charitable initiatives and community engagement.
This article will comprehensively analyze KOMA's price trajectory from 2025 through 2030, incorporating historical price patterns, market supply dynamics, ecosystem development, and macroeconomic factors to provide investors with professional price forecasts and actionable investment strategies. By examining both the token's historical performance—ranging from its all-time high of $0.20185 to recent market movements—and current market sentiment, we aim to deliver insights that support informed decision-making in this volatile yet opportunity-rich market segment.
KOMA (Koma Inu) Market Analysis Report
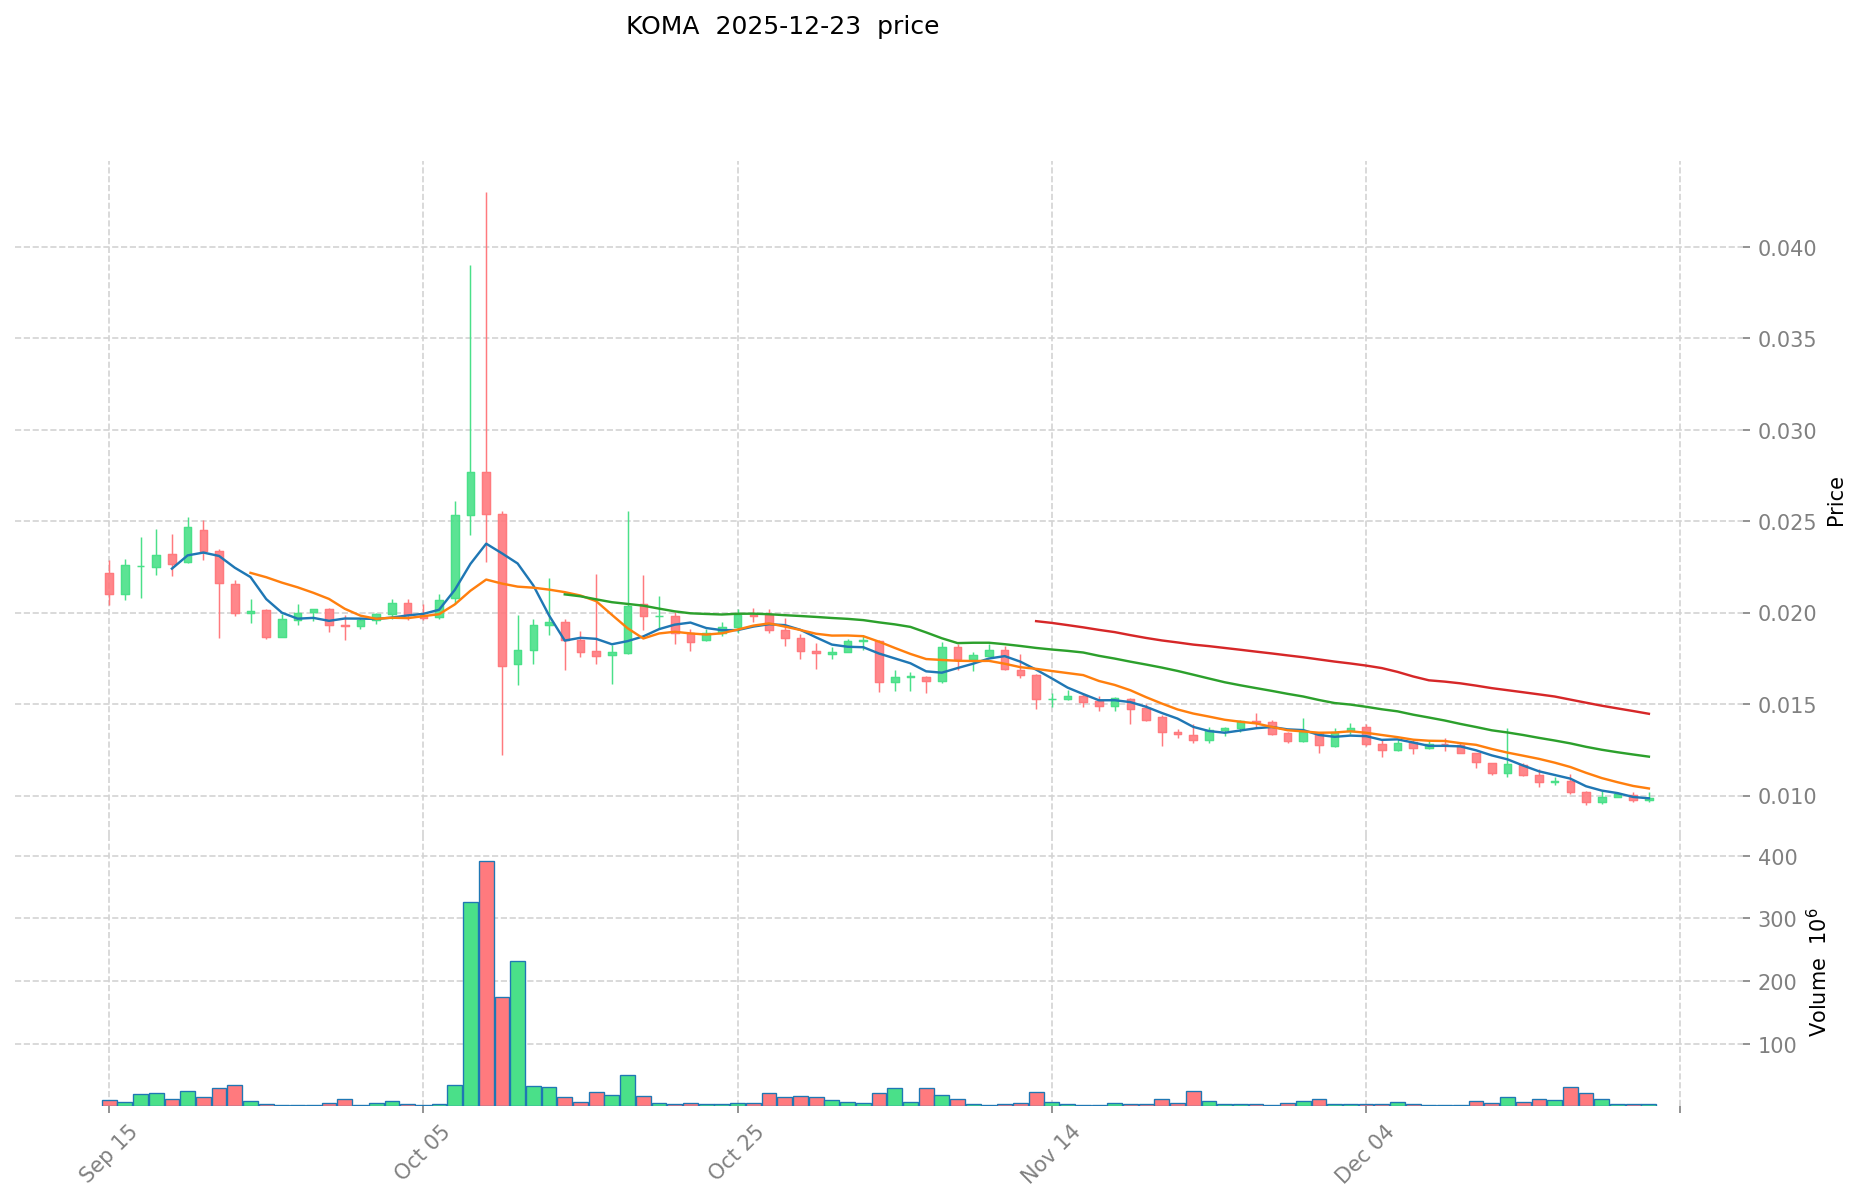
I. KOMA Price History Review and Current Market Status
KOMA Historical Price Movement Trajectory
- December 2024: KOMA reached its all-time high (ATH) of $0.20185 on December 25, 2024, marking a significant peak in the token's trading history.
- December 2024 - Present: Following the ATH, KOMA experienced a substantial correction, declining approximately 92.44% over the one-year period.
- December 18, 2025: KOMA hit its all-time low (ATL) of $0.00946, representing the lowest price point in the token's trading record.
KOMA Current Market Stance
Price Performance: As of December 23, 2025, KOMA is trading at $0.009751, reflecting minimal short-term volatility. The token demonstrates:
- 1-hour change: +0.19% (change amount: $0.000018491765645274)
- 24-hour change: +0.17% (change amount: $0.000016548567435361)
- 7-day change: -9.030% (change amount: -$0.000967918324722436)
- 30-day change: -26.21% (change amount: -$0.003463527713782355)
- 1-year change: -92.44% (change amount: -$0.119230481481481479)
Market Capitalization and Valuation:
- Market Cap: $5,908,660.90
- Fully Diluted Valuation (FDV): $9,751,000.00
- Market Cap/FDV Ratio: 60.6%
- 24-Hour Trading Volume: $34,944.12
Supply Metrics:
- Circulating Supply: 605,954,353.4258611 KOMA (60.60% of total supply)
- Total Supply: 1,000,000,000 KOMA
- Maximum Supply: 1,000,000,000 KOMA
- Token Holders: 45,530
Market Position: KOMA ranks 1,449th by market capitalization with a market dominance of 0.00030%. The token maintains presence across 12 exchanges and features a 24-hour price range between $0.009698 and $0.01021.
Click to view current KOMA market price
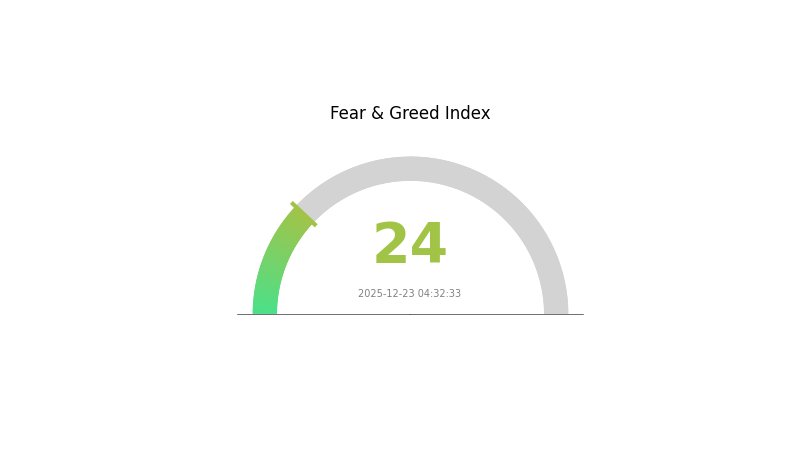
KOMA Market Sentiment Index
2025-12-23 Fear and Greed Index: 24 (Extreme Fear)
Click to view current Fear & Greed Index
The cryptocurrency market is experiencing extreme fear, with the Fear and Greed Index dropping to 24. This indicates strong bearish sentiment among investors, characterized by heightened risk aversion and pessimistic market outlook. During such periods, market volatility typically increases as panic selling accelerates. Savvy investors often view extreme fear as potential accumulation opportunities, as oversold conditions may present attractive entry points for long-term positions. However, proceed with caution and conduct thorough research before making investment decisions. Monitor market developments closely for any signs of sentiment reversal.
KOMA Holdings Distribution
The address holdings distribution chart illustrates how KOMA tokens are allocated across the blockchain network, with each address representing a distinct holder or entity. This metric serves as a critical indicator for assessing token concentration, market structure integrity, and the potential for price manipulation within the ecosystem.
The current distribution of KOMA exhibits a pronounced concentration pattern, with the top five addresses commanding 70.69% of total supply. Most notably, address 0x0000...00dead holds 39.40% of tokens, indicating a substantial portion has been removed from circulation through burn mechanisms, which effectively reduces the active supply. The remaining top-tier addresses (0xe274...71e2db, 0x0ec1...a0e99a, 0xc882...84f071, and 0x0d07...b492fe) collectively account for 31.29%, demonstrating significant holder concentration among institutional or large-scale stakeholders. While this concentration level warrants careful monitoring, the 29.31% distribution among remaining holders provides a degree of decentralization that mitigates extreme centralization risks.
This holdings structure presents both opportunities and considerations for market participants. The substantial burn (39.40%) enhances scarcity and may support long-term value preservation, while the concentrated holdings among the top four active addresses could amplify price volatility during periods of significant transactions. The moderate participation of smaller holders (29.31%) suggests a developing ecosystem with growing retail engagement. Overall, KOMA's token distribution reflects a semi-concentrated network typical of mid-stage projects, where further decentralization through organic adoption and community distribution would strengthen network robustness and reduce concentration-related risks.
Check the current KOMA Holdings Distribution
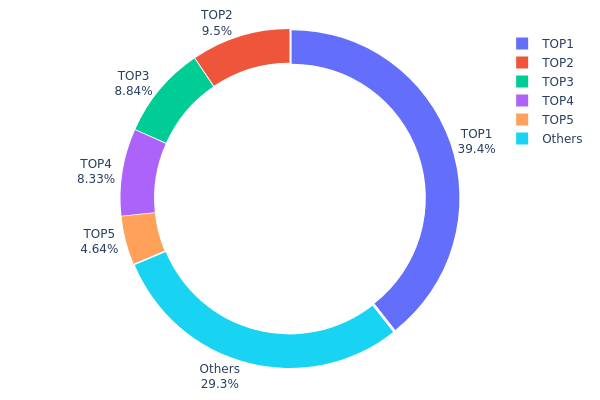
| Top | Address | Holding Qty | Holding (%) |
|---|---|---|---|
| 1 | 0x0000...00dead | 394045.65K | 39.40% |
| 2 | 0xe274...71e2db | 95000.00K | 9.50% |
| 3 | 0x0ec1...a0e99a | 88368.83K | 8.83% |
| 4 | 0xc882...84f071 | 83270.06K | 8.32% |
| 5 | 0x0d07...b492fe | 46417.71K | 4.64% |
| - | Others | 292897.75K | 29.31% |
II. Core Factors Influencing KOMA's Future Price
Market Performance and Meme Coin Sector Dynamics
-
Current Market Momentum: The meme coin market has shown signs of recovery, with KOMA trading on BNB Chain demonstrating strong performance alongside other notable meme tokens. The token has gained positive market attention within the broader meme coin ecosystem.
-
Trading Volume and Market Demand: KOMA's future price trajectory is significantly influenced by overall market demand, trading volume patterns, and the general performance dynamics of the meme coin sector. These factors serve as key indicators for price movements.
-
Social Media Sentiment: Community engagement and social media sentiment play crucial roles in determining market interest and investor confidence in KOMA. The level of online discussion and community support directly impacts the token's market visibility and price momentum.
Regulatory and Exchange Listing Considerations
-
Platform Listing Prospects: Potential listings on major cryptocurrency platforms could represent significant catalysts for price appreciation. Exchange listings expand market accessibility and attract institutional interest in the token.
-
Regulatory Environment: Changes in regulatory frameworks and policy developments can substantially impact KOMA's price. News regarding cryptocurrency regulations at both regional and international levels represents an important consideration for investors monitoring the token's trajectory.
III. 2025-2030 KOMA Price Forecast
2025 Outlook
- Conservative Forecast: $0.00809 - $0.00975
- Neutral Forecast: $0.00975
- Optimistic Forecast: $0.01199 (requires sustained market interest and positive ecosystem developments)
2026-2027 Medium-term Outlook
- Market Stage Expectation: Recovery and gradual appreciation phase with steady accumulation
- Price Range Forecast:
- 2026: $0.00946 - $0.01435
- 2027: $0.00681 - $0.01476
- Key Catalysts: Protocol upgrades, increased adoption, market sentiment recovery, and institutional interest in emerging assets
2028-2030 Long-term Outlook
- Base Case: $0.01095 - $0.0182 (assumes moderate market expansion and steady project development)
- Optimistic Case: $0.01537 - $0.01990 (assumes accelerated adoption, successful strategic partnerships, and favorable macroeconomic conditions)
- Transformative Case: $0.01990+ (extreme scenario with breakthrough technological innovations, mainstream adoption, and significant market capitalization growth)
Note: Price predictions are subject to market volatility, regulatory changes, and unforeseen macroeconomic factors. Investors should conduct thorough due diligence and consider risk management strategies. Trading on platforms like Gate.com can facilitate position management during forecast periods.
| 年份 | 预测最高价 | 预测平均价格 | 预测最低价 | 涨跌幅 |
|---|---|---|---|---|
| 2025 | 0.01199 | 0.00975 | 0.00809 | 0 |
| 2026 | 0.01435 | 0.01087 | 0.00946 | 11 |
| 2027 | 0.01476 | 0.01261 | 0.00681 | 29 |
| 2028 | 0.0182 | 0.01368 | 0.01095 | 40 |
| 2029 | 0.01642 | 0.01594 | 0.01004 | 63 |
| 2030 | 0.0199 | 0.01618 | 0.01537 | 65 |
KOMA Inu (KOMA) Professional Investment Strategy Report
IV. KOMA Professional Investment Strategy and Risk Management
KOMA Investment Methodology
(1) Long-term Holding Strategy
- Suitable investors: Community-oriented participants with high risk tolerance who believe in the project's decentralization and charitable mission
- Operation recommendations:
- Accumulate KOMA during market downturns, particularly when prices drop below $0.01
- Hold through market cycles to benefit from community growth and adoption
- Participate in community governance initiatives to strengthen long-term conviction
(2) Active Trading Strategy
- Technical analysis tools:
- Support and Resistance Levels: Monitor the $0.009698 (24H low) and $0.01021 (24H high) levels for entry and exit signals
- Trend Analysis: Track the 7-day performance (-9.03%) and 30-day performance (-26.21%) to identify reversal patterns
- Wave trading key points:
- Take advantage of short-term volatility within the established trading range
- Set clear profit targets at 5-10% gains given the token's volatility profile
KOMA Risk Management Framework
(1) Asset Allocation Principles
- Conservative investors: 0.5% - 1% of portfolio
- Aggressive investors: 2% - 5% of portfolio
- Professional investors: 5% - 10% of portfolio (with hedging strategies)
(2) Risk Hedging Solutions
- Portfolio Diversification: Allocate KOMA within a broader cryptocurrency portfolio to reduce concentration risk
- Dollar-Cost Averaging (DCA): Implement systematic purchases over time to mitigate timing risk and reduce average cost basis
(3) Secure Storage Solutions
- Hot Wallet Options: Use Gate.com Web3 Wallet for frequent trading and liquidity management
- Cold Storage Approach: Transfer long-term holdings to secure offline storage solutions
- Security Precautions: Never share private keys, enable two-factor authentication on exchange accounts, use hardware security for significant holdings
V. KOMA Potential Risks and Challenges
KOMA Market Risk
- Price Volatility: The token has experienced a -92.44% decline over one year, indicating extreme volatility and substantial downside risk for investors
- Liquidity Concerns: With a 24-hour trading volume of only $34,944.12 and market cap of approximately $5.9 million, liquidity is limited and may impact exit strategies
- Market Sentiment: Current market emotion indicators suggest cautious sentiment, which could exacerbate price declines during market stress
KOMA Regulatory Risk
- Meme Token Classification: As a dog-themed token, regulatory authorities may apply stricter scrutiny to ensure compliance with securities laws
- Geographic Restrictions: Certain jurisdictions may restrict or prohibit trading in dog-themed tokens or speculative digital assets
- Future Compliance Requirements: Evolving cryptocurrency regulations could impact the token's availability and trading on major platforms
KOMA Technical Risk
- Smart Contract Vulnerability: Any potential security flaws in the BEP-20 contract could result in significant losses
- Exchange Counterparty Risk: The token is listed on only 12 exchanges, creating dependency risk on these platforms' operational stability
- Network Dependency: As a BSC-based token, KOMA's performance is tied to Binance Smart Chain's reliability and security
VI. Conclusion and Action Recommendations
KOMA Investment Value Assessment
KOMA represents a high-risk, speculative investment opportunity centered on community engagement and charitable initiatives within the BNB ecosystem. With a market capitalization of approximately $5.9 million and limited trading volume, KOMA exhibits characteristics typical of emerging meme tokens. The significant year-over-year decline (-92.44%) and recent 30-day underperformance (-26.21%) suggest considerable challenges. However, for investors with substantial risk tolerance and conviction in community-driven blockchain projects, KOMA may offer upside potential during bull market cycles. The project's focus on decentralization and charity aligns with broader Web3 ethos, though execution risks remain substantial.
KOMA Investment Recommendations
✅ Beginners: Start with minimal allocation (0.1-0.5% of crypto portfolio), use dollar-cost averaging to build positions gradually, and avoid leveraged trading
✅ Experienced Investors: Consider 2-5% allocation as a speculative position within a diversified portfolio, employ technical analysis for tactical entry/exit points, and actively manage risk through stop-loss orders
✅ Institutional Investors: Conduct thorough due diligence on community structure and charitable initiatives, establish risk parameters aligned with institutional guidelines, and consider this as a small speculative allocation within alternative asset strategies
KOMA Trading Participation Methods
- Gate.com Trading Platform: Access KOMA spot trading with competitive fees and professional-grade trading tools
- Community Participation: Engage with the KOMA community through official channels (Website: https://komabnb.com, Twitter: https://x.com/komabnb) to stay informed on project developments
- Blockchain Verification: Monitor on-chain activities through BSC explorer (https://bscscan.com/token/0xd5eaaac47bd1993d661bc087e15dfb079a7f3c19) to track token movement patterns and holder distribution
Cryptocurrency investment carries extreme risk. This report does not constitute investment advice. Investors must make decisions based on their individual risk tolerance and should consult with professional financial advisors. Never invest more than you can afford to lose.
FAQ
Which chain is Koma issued on?
KOMA is issued on the BNB Smart Chain (BSC) using the BEP-20 token standard, offering fast transactions and low fees.
What is KOMA's historical price performance and market cap?
As of December 23, 2025, KOMA is trading at $0.020578 with a market cap of $12.47 million. In the past 24 hours, the price declined 11.51%. KOMA demonstrates typical volatile market behavior with potential for recovery as adoption increases.
What are the key factors that could drive KOMA's price in the coming years?
Institutional adoption and increased usage of KOMA within its ecosystem will be primary drivers. Market sentiment, overall cryptocurrency performance, and trading volume growth will also significantly impact KOMA's price trajectory.
What are the main risks and challenges for KOMA's future price prediction?
KOMA faces bearish momentum and concentration risks. Macroeconomic shifts, technological changes, and ecosystem developments present challenges. Market volatility and unpredictable growth factors also impact future price movements.
Share
Content
Introduction: KOMA's Market Position and Investment Value
I. KOMA Price History Review and Current Market Status
II. Core Factors Influencing KOMA's Future Price
III. 2025-2030 KOMA Price Forecast
IV. KOMA Professional Investment Strategy and Risk Management
V. KOMA Potential Risks and Challenges
VI. Conclusion and Action Recommendations
FAQ
How to Buy Cryptocurrency


Trending Cryptocurrencies


Will Crypto Recover in 2025?

How to Make a Meme Coin: A Step-by-Step Guide for ETH, Tron, Solana, and BRC

2025 SHIB Price Prediction: Can Shiba Inu Reach $0.001 After Recent Market Developments?
Greater Fool Theory Explained: Buying for the Next Buyer, Not Value

2025 TURBO Price Prediction: Analyzing Market Trends and Future Valuation Prospects in the Evolving Cryptocurrency Ecosystem

2025 FLOKI Price Prediction: Analyzing Growth Potential and Market Trends in the Meme Token Ecosystem

2025 NS Price Prediction: Expert Analysis and Market Forecast for the Year Ahead

2025 DATA Price Prediction: Expert Analysis and Future Market Outlook for Cryptocurrency Investors
2025 TET Price Prediction: Expert Analysis and Market Forecast for the Year Ahead
Understanding Crypto Cards: Functionality and Applications

2025 XDB Price Prediction: Expert Analysis and Market Outlook for the Year Ahead