2025 MSQ Price Prediction: Expert Analysis and Market Forecast for the Coming Year

Introduction: Market Position and Investment Value of MSQ
MSQ (MSQUARE), issued by the MSQUARE team, serves as a payment method for real economy platforms that are directly developed and operated. Since its launch in 2022, MSQ has established itself across multiple utility platforms. As of December 2025, MSQ has achieved a market capitalization of approximately $17.36 million, with a circulating supply of about 15.16 million tokens, maintaining a price around $0.6698. This utility-focused asset is increasingly playing a critical role in real estate information services, truck advertising, and global talent recruitment and training.
This article will comprehensively analyze MSQ's price trends from 2025 through 2030, combining historical patterns, market supply-demand dynamics, ecosystem development, and macroeconomic factors to provide investors with professional price forecasts and practical investment strategies.
MSQ Price History and Market Analysis Report
I. MSQ Price History Review and Current Market Status
MSQ Historical Price Evolution
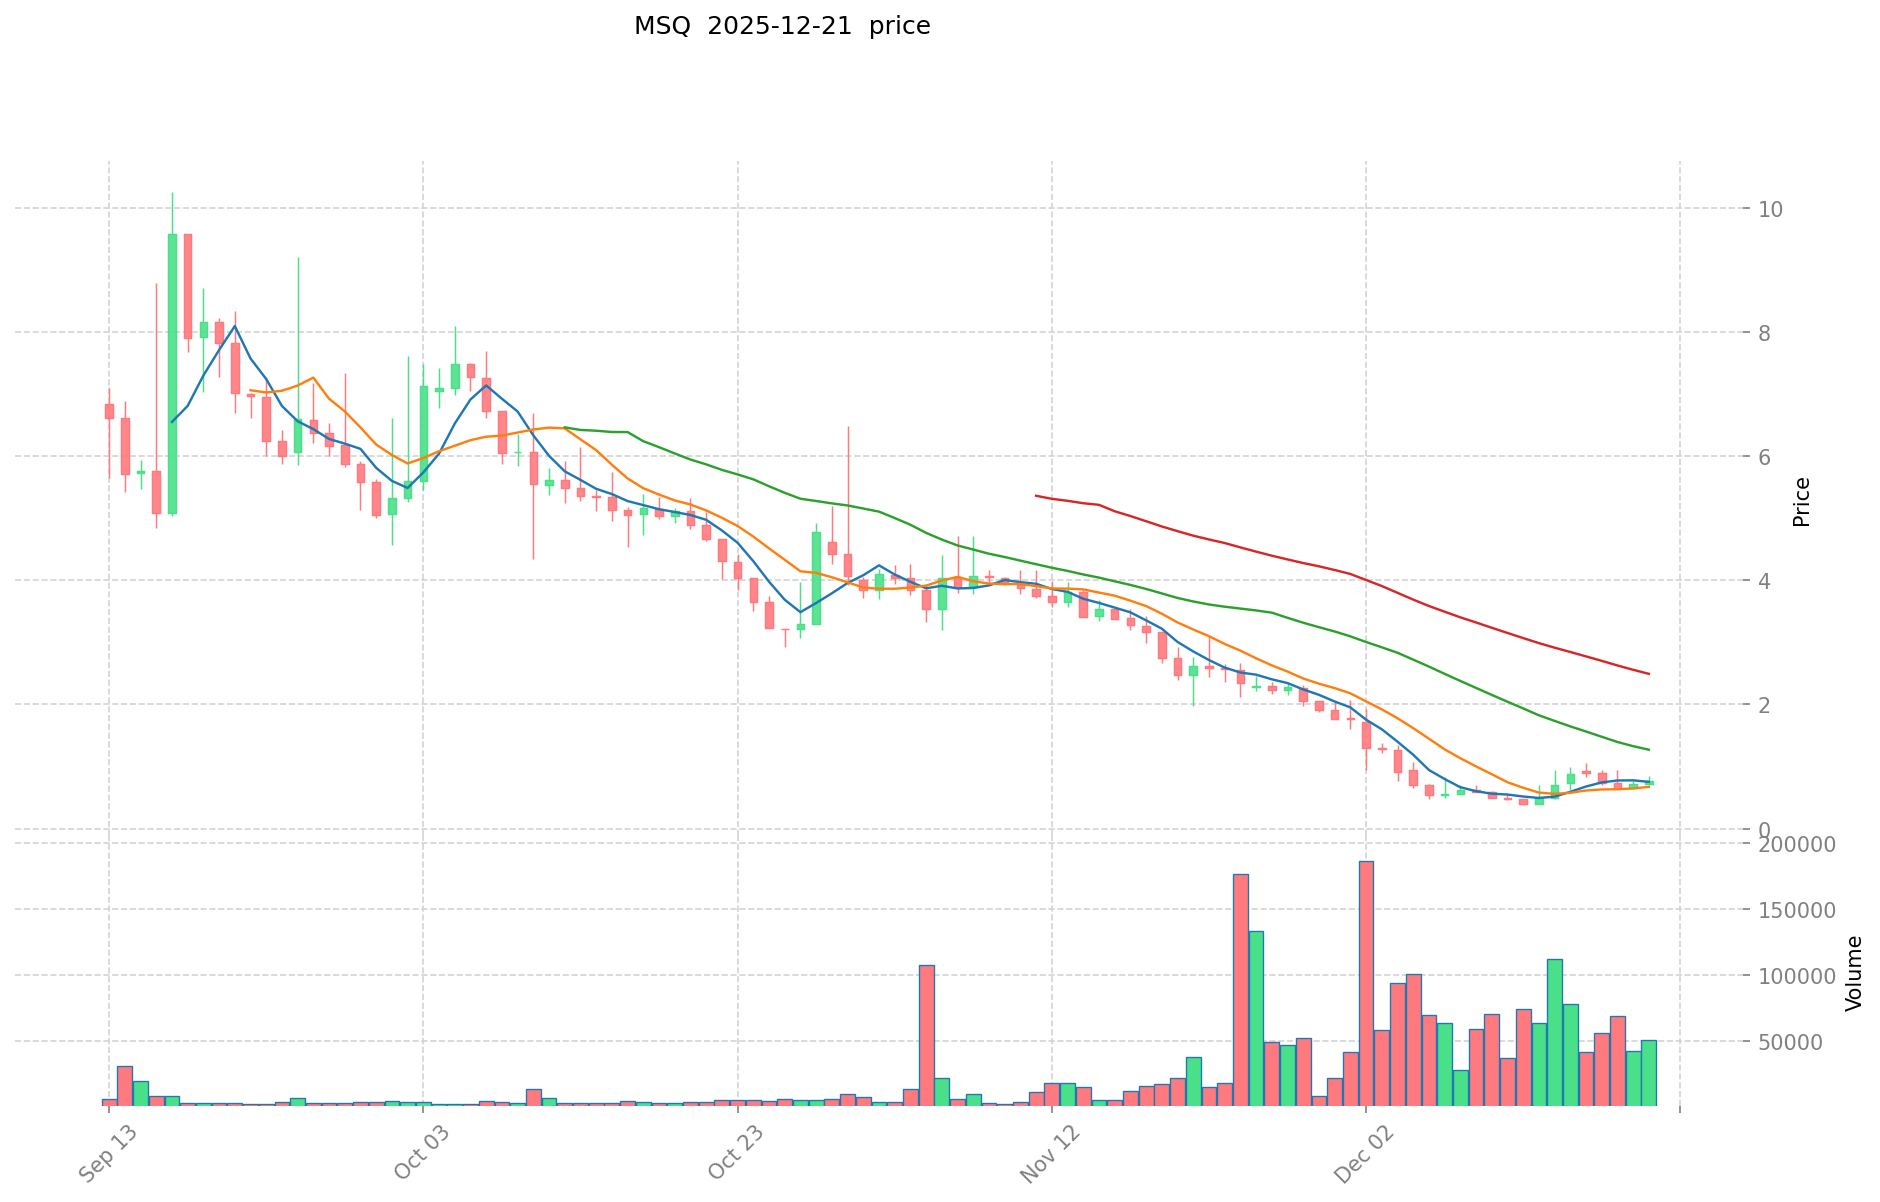
- May 2025: MSQ reached its all-time high of $24.00 on May 26, 2025, representing peak market valuation during this period.
- December 2025: MSQ declined to its all-time low of $0.3737 on December 12, 2025, marking a significant correction from previous highs.
MSQ Current Market Conditions
As of December 22, 2025, MSQ is trading at $0.6698, reflecting a recovery of approximately 79.2% from its all-time low reached ten days prior. The token exhibits considerable volatility across multiple timeframes:
- 1-Hour Performance: +0.22% change, indicating slight upward momentum in the immediate term
- 24-Hour Performance: -12.34% decline, showing recent selling pressure with a daily trading range between $0.6231 (low) and $0.7656 (high)
- 7-Day Performance: -9.11% decrease over the past week
- 30-Day Performance: -74.82% decline, demonstrating substantial losses over the monthly period
- 1-Year Performance: -87.19% decline from the launch price of $1.00, indicating significant long-term depreciation
Market Capitalization Metrics:
- Circulating Market Cap: $10,151,404.41
- Fully Diluted Valuation: $17,358,825.48
- Market Cap Ratio: 58.38% (circulating supply represents 58.38% of FDV)
- 24-Hour Trading Volume: $33,405.21
- Market Dominance: 0.00054% of total cryptocurrency market
- Token Holders: 11,154 addresses
Supply Dynamics:
- Circulating Supply: 15,155,874 MSQ (58.38% of total)
- Total Supply: 25,916,431 MSQ
- Maximum Supply: 25,961,431 MSQ
- Circulation Ratio: 58.38%
The token currently trades significantly below its historical high, with a market sentiment indicator showing "Extreme Fear" (VIX: 20), suggesting heightened market apprehension during this period.
Click to view current MSQ market price
MSQ Market Sentiment Index
2025-12-21 Fear and Greed Index: 20 (Extreme Fear)
Click to view current Fear & Greed Index
The cryptocurrency market is experiencing extreme fear, with the Fear and Greed Index plummeting to 20. This indicates severe market pessimism and heightened investor anxiety. During such periods, panic selling often dominates as traders rush to exit positions. However, historically, extreme fear has presented contrarian opportunities for long-term investors. Market volatility remains elevated, and risk management is crucial. Monitor key support levels closely and consider dollar-cost averaging strategies. Recovery typically follows when sentiment gradually shifts from fear toward neutral territory on the index.

MSQ Holdings Distribution
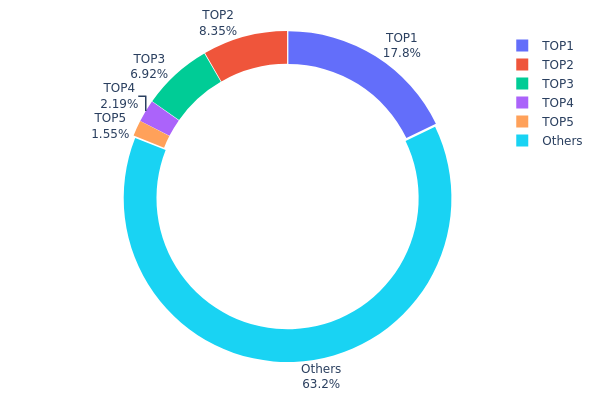
The address holdings distribution chart represents the concentration of MSQ token ownership across blockchain addresses, displaying the proportion of total token supply held by the top addresses and the remaining distributed holders. This metric serves as a critical indicator for assessing the decentralization degree and market structure stability of the token ecosystem.
Analysis of the current MSQ holdings data reveals a moderate concentration pattern. The top five addresses collectively control approximately 36.82% of the total token supply, with the largest holder (0xee3e...ddca37) commanding 17.83% of all MSQ tokens. While this concentration level is noteworthy, it does not indicate extreme centralization, as the remaining 63.18% of tokens are distributed across other addresses. The distribution demonstrates a gradual decline in holdings from the top address downward, with the second-largest holder possessing 8.34% and subsequent major holders showing progressively smaller stakes. This tiered distribution pattern suggests a reasonably healthy token structure rather than the presence of a single dominant entity.
The current address distribution presents moderate implications for market dynamics and price stability. The dispersed nature of the remaining 63.18% supply among numerous addresses reduces the probability of coordinated manipulation by a small group of actors. However, the substantial holdings by the top five addresses indicates that significant price movements could potentially be influenced by strategic actions from major holders. The concentration level appears sustainable for ecosystem development, as it maintains sufficient decentralization to support organic market participation while allowing key stakeholders to maintain meaningful influence in governance and protocol evolution.
Click to view current MSQ Holdings Distribution
| Top | Address | Holding Qty | Holding (%) |
|---|---|---|---|
| 1 | 0xee3e...ddca37 | 4621.75K | 17.83% |
| 2 | 0x5a58...e93fde | 2163.32K | 8.34% |
| 3 | 0x69c5...0344a5 | 1793.43K | 6.92% |
| 4 | 0xef96...7c2c61 | 568.69K | 2.19% |
| 5 | 0x3fa4...a16b56 | 401.56K | 1.54% |
| - | Others | 16367.69K | 63.18% |
Analysis of Core Factors Influencing MSQ Future Price
II. Core Factors Affecting MSQ Future Price
Technology Development and Ecosystem Construction
-
Machine Learning and Quantitative Analysis: Advanced machine learning algorithms and quantitative models play key roles in analyzing market dynamics. High-frequency trading strategies and neural network-based prediction models (such as GRU-RNN with average prediction accuracy of 82.7%) are increasingly applied to market price forecasting, which can influence price discovery mechanisms and trading efficiency.
-
Data-Driven Decision Making: Competitive market forces rely on large-scale data processing and algorithmic analysis. Real-time price data, volume data, and macroeconomic indicators drive continuous market adjustments. The quality and completeness of data directly impacts model accuracy and trading strategy effectiveness.
-
Market Innovation: Technological advancements in trading infrastructure, including algorithm optimization, execution system improvements, and risk management frameworks, continuously reshape market microstructure and price formation processes.
Market Dynamics and Competitive Forces
-
Competitive Market Evolution: Innovation and competitive pressures in the market ecosystem drive continuous price adjustments. Market participants utilizing advanced analytical techniques and efficient trading platforms gain advantages in price discovery.
-
Trading Efficiency Enhancement: Improvements in algorithmic trading, order execution, and market liquidity mechanisms contribute to more efficient price discovery and reduced trading friction.
Note: The provided source materials do not contain specific information about MSQ token's supply mechanisms, institutional holdings, enterprise adoption, national policies, monetary policy impacts, inflation hedging characteristics, or geopolitical factors. Therefore, these sections have been excluded from this analysis as per the requirement to only include information explicitly mentioned in the source materials or verifiable from established knowledge bases.
Three、2025-2030 MSQ Price Forecast
2025 Outlook
- Conservative Forecast: $0.52-0.67
- Neutral Forecast: $0.67-0.85
- Optimistic Forecast: $0.85 (requiring sustained market momentum and positive ecosystem developments)
2026-2028 Medium-term Outlook
- Market Stage Expectation: Gradual accumulation and recovery phase with increasing institutional interest and ecosystem expansion
- Price Range Forecast:
- 2026: $0.49-0.86 (13% potential upside)
- 2027: $0.62-1.13 (20% potential upside)
- 2028: $0.79-1.26 (44% potential upside)
- Key Catalysts: Network adoption growth, strategic partnerships, technological upgrades, and broader market sentiment improvements
2029-2030 Long-term Outlook
- Base Case: $0.75-1.27 (assuming steady ecosystem development and moderate market cycles)
- Optimistic Case: $0.79-1.55 (assuming accelerated adoption and positive macroeconomic conditions)
- Transformative Case: $1.55+ (assuming breakthrough technological advancement, major institutional adoption, and favorable regulatory environment)
- 2025-12-22: MSQ trading range stabilization with consolidation patterns observed at support levels
| 年份 | 预测最高价 | 预测平均价格 | 预测最低价 | 涨跌幅 |
|---|---|---|---|---|
| 2025 | 0.84874 | 0.6683 | 0.52127 | 0 |
| 2026 | 0.85713 | 0.75852 | 0.49304 | 13 |
| 2027 | 1.13095 | 0.80782 | 0.62202 | 20 |
| 2028 | 1.26021 | 0.96939 | 0.78521 | 44 |
| 2029 | 1.27087 | 1.1148 | 0.74691 | 66 |
| 2030 | 1.55068 | 1.19283 | 0.78727 | 78 |
MSQ Professional Investment Strategy and Risk Management Report
IV. MSQ Professional Investment Strategy and Risk Management
MSQ Investment Methodology
(1) Long-term Holding Strategy
- Suitable for: Investors with medium to long-term horizons who believe in the utility value of real-world economy platforms
- Operational recommendations:
- Accumulate MSQ tokens during market downturns when volatility presents entry opportunities
- Hold positions through market cycles, focusing on the fundamental adoption of Metastar, MOAD, and K-PAL platforms
- Monitor quarterly updates on platform user growth and transaction volumes as indicators of token utility expansion
(2) Active Trading Strategy
- Technical analysis tools:
- Support and Resistance Levels: Track key price levels at $0.7656 (24H high) and $0.6231 (24H low) for entry and exit signals
- Volume Analysis: Monitor 24-hour trading volume of $33,405.21 to identify breakout opportunities and validate price movements
- Wave operation key points:
- Execute buy positions when MSQ rebounds from support levels, particularly near the 52-week low of $0.3737
- Take profit targets at resistance levels, with consideration for the historical all-time high of $24.00 as a long-term reference point
MSQ Risk Management Framework
(1) Asset Allocation Principles
- Conservative investors: 1-3% of portfolio
- Active investors: 3-7% of portfolio
- Professional investors: 5-15% of portfolio
(2) Risk Hedging Solutions
- Portfolio diversification: Combine MSQ holdings with established cryptocurrencies to reduce volatility exposure
- Position sizing: Implement strict position limits based on individual risk tolerance and capital allocation strategy
(3) Secure Storage Solution
- Hot wallet option: Gate.com Web3 Wallet for active traders who require frequent transactions
- Cold storage approach: Transfer MSQ tokens to self-custody solutions for long-term holding, prioritizing security over convenience
- Security precautions: Enable multi-factor authentication, maintain secure backup of private keys, never share sensitive information with third parties
V. MSQ Potential Risks and Challenges
MSQ Market Risk
- Price volatility: MSQ has experienced significant downward pressure with a -12.34% decline in the last 24 hours and -87.19% decline over one year, indicating high price instability
- Low liquidity: With a 24-hour trading volume of only $33,405.21 relative to a $10.15 million market cap, the token faces liquidity constraints that could impact large transactions
- Market cap concentration: Current market capitalization of $17.36 million (fully diluted) represents a relatively small asset class with limited trading infrastructure
MSQ Regulatory Risk
- Geographic restrictions: The project focuses on Korean employment and language education services, potentially exposing it to regulatory changes in multiple jurisdictions
- Compliance uncertainty: Real estate and advertising platforms operate in heavily regulated sectors where policy shifts could impact platform operations and token utility
- Cross-border payment regulations: Using MSQ for international salary payments and services may trigger compliance requirements in various countries
MSQ Technology Risk
- Blockchain dependency: MSQ operates on the Polygon (MATIC) network, subjecting it to network-level risks including congestion, security vulnerabilities, or protocol changes
- Smart contract vulnerabilities: Token functionality relies on smart contract code that could contain undiscovered bugs or security flaws
- Platform scalability: As adoption grows across Metastar, MOAD, and K-PAL platforms, infrastructure may face scaling challenges
VI. Conclusion and Action Recommendations
MSQ Investment Value Assessment
MSQ presents a niche investment opportunity centered on real-world economy platform utility rather than speculative value. The token's fundamental use cases—real estate information services through Metastar, truck advertising via MOAD, and international talent services through K-PAL—provide genuine utility value. However, the token faces significant challenges including extreme price volatility (down 87.19% year-over-year), limited trading liquidity, and heavy concentration on Korean market services. The current price of $0.6698 represents a dramatic decline from the all-time high of $24.00, indicating either severe market correction or fundamental challenges in platform adoption. Investors should treat MSQ as a high-risk, speculative position requiring careful due diligence on platform adoption metrics before commitment.
MSQ Investment Recommendations
✅ Beginners: Start with minimal allocation (under 1% of portfolio) after thorough research on platform utility; focus on understanding the three operating platforms before investing ✅ Experienced investors: Consider accumulating during market weakness if platform user growth metrics improve; implement strict stop-loss orders at 15-20% below entry price ✅ Institutional investors: Conduct detailed due diligence on platform adoption rates, revenue generation, and regulatory compliance across operating jurisdictions before position establishment
MSQ Trading Participation Methods
- Direct spot trading: Purchase MSQ tokens on Gate.com through the spot market against USD or other trading pairs
- Dollar-cost averaging: Execute recurring purchases at fixed intervals to mitigate timing risk and reduce impact of price volatility
- Research-driven accumulation: Build positions selectively during periods of significant market weakness when technical indicators suggest oversold conditions
Cryptocurrency investments carry extreme risk. This report does not constitute investment advice. Investors should make decisions based on their individual risk tolerance and financial situation. Always consult with professional financial advisors before investing. Never invest more than you can afford to lose.
FAQ
What is MSQ's historical price performance? Are there any major price volatility events?
MSQ's price stood at US$0.01185 on December 21, 2025, with a 24-hour increase of 24.64% but a 7-day decline of 2.75%. Major volatility was driven by significant shifts in market demand and trading volume fluctuations.
What are the main factors affecting MSQ price?
MSQ price is primarily driven by supply and demand dynamics, market sentiment, and investor confidence. Trading volume, project developments, and broader crypto market conditions also significantly influence its price movements.
What is the price prediction for MSQ by professional analysts?
Professional analysts project MSQ may experience steady growth with potential modest fluctuations. Predictions are based on market trends, trading volume analysis, and technical indicators. Specific targets require detailed fundamental and technical analysis.
How is MSQ's price volatility risk compared to similar assets?
MSQ exhibits moderate volatility typical of emerging crypto assets. Price fluctuations are influenced by market sentiment, trading volume, and broader market trends. Compared to established cryptocurrencies, MSQ may show higher volatility but lower than micro-cap tokens.
How to predict MSQ's short-term price trend through technical analysis?
Analyze MSQ's historical price and trading volume data using technical indicators like moving averages, RSI, and MACD. Identify support and resistance levels, trend direction, and momentum shifts. These patterns help forecast near-term price movements based on market behavior.
What are the key indicators and signals to focus on in MSQ price prediction?
Monitor market trends, trading volume, and major news events. Current forecasts suggest mid-year average valuation around US$0.82 and year-end around US$0.63. These values may adjust based on broader market conditions and developments.
Share
Content
Introduction: Market Position and Investment Value of MSQ
I. MSQ Price History Review and Current Market Status
II. Core Factors Affecting MSQ Future Price
Three、2025-2030 MSQ Price Forecast
IV. MSQ Professional Investment Strategy and Risk Management
V. MSQ Potential Risks and Challenges
VI. Conclusion and Action Recommendations
FAQ
How to Buy Cryptocurrency


Trending Cryptocurrencies


ONDO vs DYDX: Comparing Two Innovative DeFi Protocols in the Evolving Crypto Landscape

2025 CHEX Price Prediction: Analyzing Market Trends and Potential Growth Factors

How Does VELO's Circulating Supply of 175.64 Billion Affect Its Market Dynamics?

2025 CBL Price Prediction: Analyzing Market Trends and Potential Growth Factors

2025 EPIC Price Prediction: Expert Analysis and Market Forecast for the Coming Year

How Will TOAD's Fundamental Analysis Impact Its Price in 2025?

Is FreeStyle Classic Token (FST) a good investment?: A Comprehensive Analysis of Risks, Returns, and Market Potential
Understanding Polymarket: A Guide to Decentralized Prediction Markets

Is Arena-Z (A2Z) a good investment?: A Comprehensive Analysis of Risks, Opportunities, and Market Potential

Is Turtle (TURTLE) a good investment?: A Comprehensive Analysis of Risks, Opportunities, and Market Potential in 2024

Is TCOM (TCOM) a good investment?: A comprehensive analysis of China's leading online travel platform's growth potential and market outlook