2025 PIEVERSE Price Prediction: Expert Analysis and Market Forecast for the Next Year

Introduction: Market Position and Investment Value of PIEVERSE
Pieverse (PIEVERSE) is an agent-native, compliant payment protocol stack designed to build foundational payment infrastructure for Web3. Since its launch in November 2025, Pieverse has established itself as a critical solution bridging blockchain technology with real-world compliance requirements. As of December 2025, PIEVERSE has achieved a market capitalization of approximately $66.46 million, with a circulating supply of 175 million tokens trading at approximately $0.3798. This innovative asset, recognized for its "compliance-first" approach to Web3 payments, is increasingly playing a pivotal role in enabling seamless, auditable transactions through on-chain verifiable invoices, receipts, and checks.
This article will provide a comprehensive analysis of PIEVERSE's price movements and market trends through 2030, incorporating historical data, market supply and demand dynamics, ecosystem development, and macroeconomic factors. Our analysis aims to deliver professional price forecasts and practical investment strategies for stakeholders seeking to understand PIEVERSE's growth potential in the evolving Web3 payment infrastructure landscape.
I. PIEVERSE Price History Review and Current Market Status
PIEVERSE Historical Price Movement Trajectory
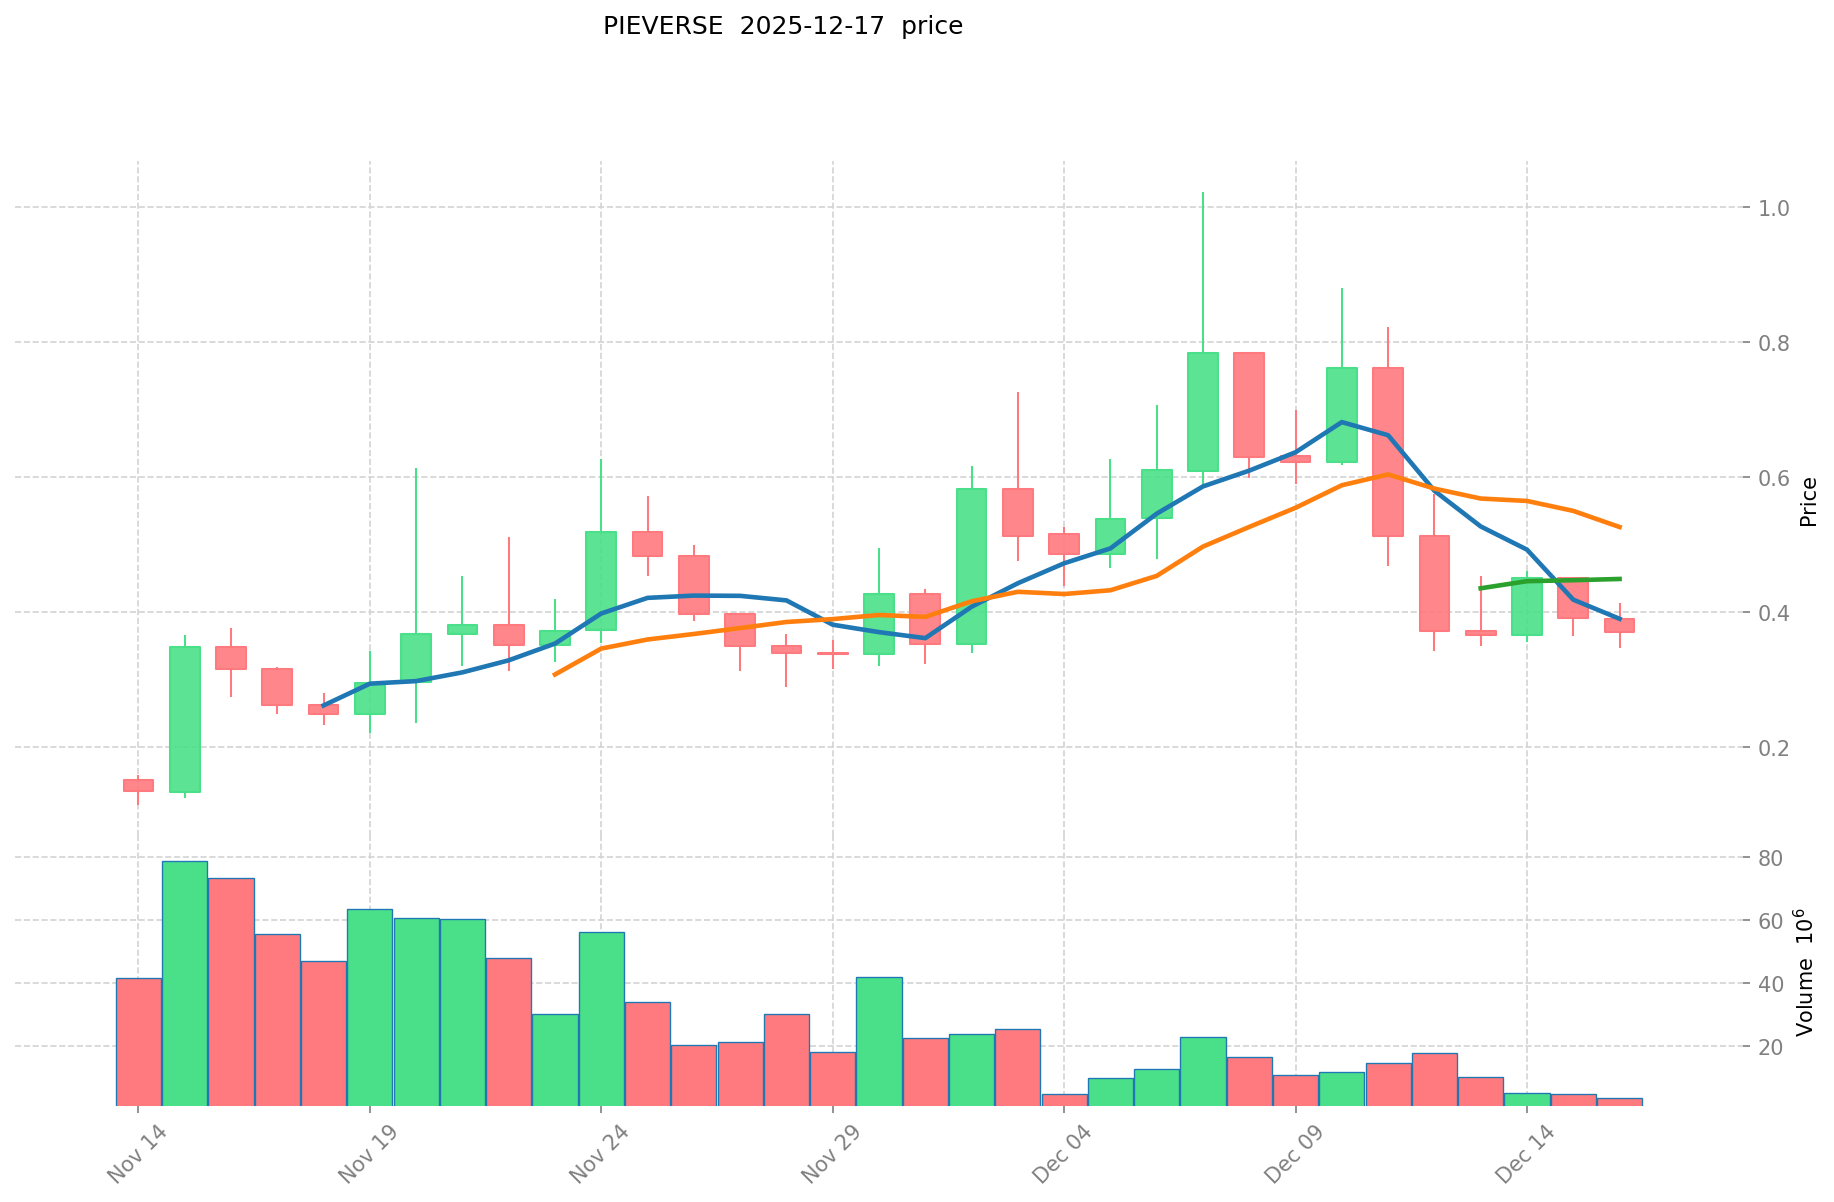
Based on available data as of December 18, 2025, PIEVERSE has demonstrated significant price volatility since its launch:
- November 14, 2025: All-time low (ATL) recorded at $0.11286, marking the lowest point in the token's trading history
- December 7, 2025: All-time high (ATH) reached at $1.02251, representing a substantial rally of approximately 806% from the ATL
- Recent period: Prices have moderated from peak levels, currently trading at $0.37977
PIEVERSE Current Market Status
As of December 18, 2025 at 06:26:37 UTC, PIEVERSE exhibits the following market characteristics:
Price Performance:
- Current price: $0.37977
- 24-hour trading range: $0.35563 - $0.40033
- 1-hour change: +0.77%
- 24-hour change: +4.36%
- 7-day change: -49.98%
- 30-day change: +44.15%
- 1-year change: +62.47%
Market Capitalization:
- Market cap (circulating supply basis): $66,459,750.00
- Fully diluted valuation (FDV): $379,770,000.00
- Market cap to FDV ratio: 17.5%
- Market dominance: 0.012%
Supply Metrics:
- Circulating supply: 175,000,000 PIEVERSE (17.5% of total supply)
- Total supply: 1,000,000,000 PIEVERSE
- Max supply: 1,000,000,000 PIEVERSE
- Number of holders: 24,452
- Listed on 17 exchanges
Trading Activity:
- 24-hour trading volume: $1,755,498.87
- Volume-to-market cap ratio indicates moderate liquidity conditions
Network Distribution:
- PIEVERSE operates as BEP-20 (on Binance Smart Chain) and ERC-20 (on Ethereum) tokens, enabling multi-chain functionality
Click to view current PIEVERSE market price
PIEVERSE Market Sentiment Index
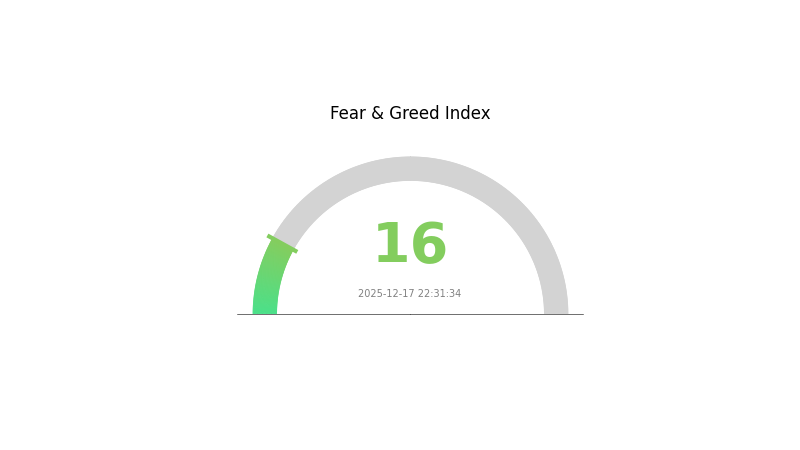
2025-12-17 Fear and Greed Index: 16 (Extreme Fear)
Click to view the current Fear & Greed Index
The crypto market is currently experiencing extreme fear, with the index standing at just 16 points. This indicates heightened investor anxiety and significant pessimism across digital asset markets. During such periods, risk-averse traders typically reduce positions while contrarian investors may identify potential buying opportunities. Market volatility tends to increase under extreme fear conditions. On Gate.com, traders can monitor this sentiment indicator in real-time to make more informed trading decisions and better understand overall market psychology during turbulent periods.
PIEVERSE Holding Distribution
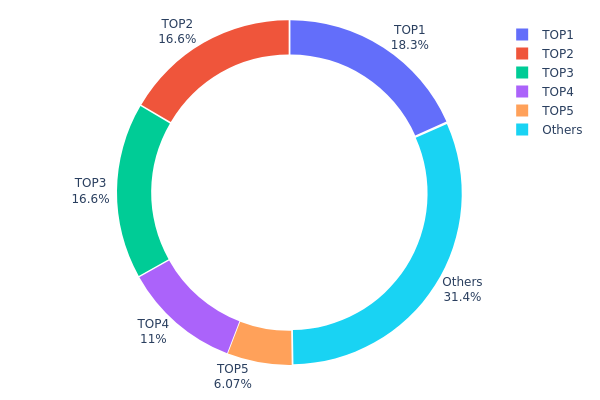
The address holding distribution map illustrates the concentration of token ownership across the top holders within the PIEVERSE ecosystem. This metric serves as a critical indicator of tokenomics health, market structure stability, and potential systemic risks associated with large-scale asset concentration. By analyzing the distribution patterns of the top addresses against the total circulating supply, market participants can assess the degree of decentralization and evaluate vulnerability to coordinated selling pressure or market manipulation.
Current analysis of PIEVERSE's holding distribution reveals a moderate concentration profile, with the top five addresses collectively controlling approximately 68.55% of the total token supply. The leading address holds 18.32% of all tokens, followed by two addresses holding 16.56% each, establishing a relatively balanced upper tier. This distribution pattern suggests a measured concentration level rather than extreme centralization. The remaining 31.45% of tokens dispersed across other addresses indicates a substantial portion of the token base exists beyond the major holders, providing a degree of organic market participation.
The concentration observed in PIEVERSE's top holder distribution carries meaningful implications for market dynamics. While the collective dominance of the top five addresses at 68.55% warrants attention, the absence of a single ultra-dominant holder mitigates immediate systemic risks. The relatively even distribution among the top three holders suggests reduced singular control over price action and liquidity dynamics. However, the significant cumulative stake of major stakeholders could potentially create conditions for coordinated market movements during periods of volatility. This structure reflects a blockchain ecosystem with concentrated institutional or early-stage participation, typical of emerging token projects, while the distribution among dispersed addresses indicates growing democratization of token ownership as the protocol matures.
Click to view current PIEVERSE Holding Distribution
| Top | Address | Holding Qty | Holding (%) |
|---|---|---|---|
| 1 | 0x82a4...bdb441 | 166000.00K | 18.32% |
| 2 | 0xa8bc...8d84dd | 150000.00K | 16.56% |
| 3 | 0xdef6...d89ef4 | 150000.00K | 16.56% |
| 4 | 0x0df0...64990e | 100000.00K | 11.04% |
| 5 | 0xef1f...f4dff0 | 55000.00K | 6.07% |
| - | Others | 284784.99K | 31.45% |
II. Core Factors Influencing PIEVERSE's Future Price
Exchange Listing Dynamics
-
Spot Exchange Listing: PIEVERSE has not yet been listed on major spot trading exchanges. Market analysis indicates that listing on major exchanges is a critical catalyst for price appreciation. Following successful spot exchange launches, the token's performance and price stability will be key determinants of long-term value.
-
Historical Pattern: As a newly emerged token that has not experienced significant price rallies, PIEVERSE's trajectory will largely depend on exchange listing announcements and subsequent market reception.
-
Current Impact: The project team is currently accumulating tokens (吸籌), with high probability of price appreciation following spot exchange listings on platforms like Gate.com. However, price momentum sustainability remains contingent upon market stability post-launch.
Market Sentiment and Project Development
-
Project Momentum: PIEVERSE's future price is primarily influenced by project development progress, market demand, and investor confidence. The token's value proposition and ecosystem expansion will play crucial roles in determining price direction.
-
Market Psychology: Current market sentiment shows cautious optimism, with traders recognizing the early-stage nature of the project. Long-term value formation requires demonstrated utility and ecosystem growth rather than speculative rallies.
III. PIEVERSE Price Forecast for 2025-2030
2025 Outlook
- Conservative Forecast: $0.22-$0.27
- Neutral Forecast: $0.29-$0.38
- Optimistic Forecast: $0.45-$0.53 (requires sustained market momentum and increased adoption)
2026-2028 Mid-term Outlook
- Market Phase Expectation: Recovery and consolidation phase with gradual upward trajectory, characterized by stabilization of price floor and expansion of average trading range.
- Price Range Predictions:
- 2026: $0.40-$0.50 (19% upside potential)
- 2027: $0.32-$0.50 (25% upside potential)
- 2028: $0.42-$0.63 (29% upside potential)
- Key Catalysts: Ecosystem expansion, increased partnerships, improved tokenomic mechanics, and broader market sentiment recovery
2029-2030 Long-term Outlook
- Base Case Scenario: $0.51-$0.74 (47% upside by 2029, assuming steady adoption and market participation)
- Optimistic Scenario: $0.64-$0.91 (70% upside by 2030, assuming accelerated ecosystem development and institutional interest)
- Transformative Scenario: $0.91+ (assuming breakthrough in use cases, significant partnership announcements, and mainstream adoption)
- Dec 18, 2025: PIEVERSE trading at $0.38 (mid-range neutral positioning)
| 年份 | 预测最高价 | 预测平均价格 | 预测最低价 | 涨跌幅 |
|---|---|---|---|---|
| 2025 | 0.52981 | 0.38116 | 0.21726 | 0 |
| 2026 | 0.50103 | 0.45549 | 0.40083 | 19 |
| 2027 | 0.50217 | 0.47826 | 0.31565 | 25 |
| 2028 | 0.62748 | 0.49022 | 0.42159 | 29 |
| 2029 | 0.73768 | 0.55885 | 0.50855 | 47 |
| 2030 | 0.91405 | 0.64826 | 0.36303 | 70 |
Pieverse (PIEVERSE) Professional Investment Analysis Report
I. Project Overview
Basic Information
Pieverse is an agent-native, compliant payment protocol stack designed to build foundational payment infrastructure for Web3. As of December 18, 2025, the project demonstrates the following market characteristics:
| Metric | Value |
|---|---|
| Current Price | $0.37977 |
| Market Cap | $66,459,750 |
| Fully Diluted Valuation | $379,770,000 |
| Circulating Supply | 175,000,000 PIEVERSE |
| Total Supply | 1,000,000,000 PIEVERSE |
| 24h Trading Volume | $1,755,498.87 |
| Market Dominance | 0.012% |
| Token Holders | 24,452 |
| Market Ranking | #428 |
Core Mission and Value Proposition
Pieverse addresses a critical gap in Web3 infrastructure by creating a seamless bridge between blockchain technology and real-world compliance requirements. The protocol's core objectives include:
- On-Chain Verification: Implementing timestamped, verifiable invoices, receipts, and checks to ensure transaction auditability
- Compliance Integration: Connecting blockchain data with regulatory requirements such as tax reporting and financial audits
- Protocol Expansion: Rolling out integrations including the x402b extension for HTTP web payments and the Timestamping Alliance for cross-project utility
II. Market Performance Analysis
Price Dynamics
Recent Price Performance (as of December 18, 2025):
- 1-Hour Change: +0.77% (+$0.00290)
- 24-Hour Change: +4.36% (+$0.01587)
- 7-Day Change: -49.98% (-$0.37947)
- 30-Day Change: +44.15% (+$0.11632)
- 1-Year Change: +62.47% (+$0.14602)
Historical Price Levels:
- All-Time High: $1.02251 (December 7, 2025)
- All-Time Low: $0.11286 (November 14, 2025)
- 24h High: $0.40033
- 24h Low: $0.35563
Market Observations
The 7-day decline of approximately 50% from recent highs indicates significant volatility following the December 7 peak. However, the 30-day positive performance of +44.15% suggests underlying bullish sentiment over a broader timeframe. The circulating supply represents only 17.5% of total supply, indicating substantial dilution potential as tokens gradually enter circulation.
III. Technical and Operational Analysis
Blockchain Integration
Pieverse operates on multiple blockchain networks:
- BSC (Binance Smart Chain): Contract Address 0x0e63b9c287e32a05e6b9ab8ee8df88a2760225a9
- Ethereum: Contract Address 0x0e63b9c287e32a05e6b9ab8ee8df88a2760225a9
Liquidity and Exchange Presence
- Trading Venues: 17 cryptocurrency exchanges
- Available on Gate.com: Yes, official listing with active trading pairs
IV. Pieverse Professional Investment Strategy and Risk Management
Pieverse Investment Methodology
(1) Long-Term Holding Strategy
- Target Investors: Infrastructure-focused investors with 18+ month investment horizons, those seeking exposure to Web3 payment infrastructure development
- Operating Recommendations:
- Establish core positions during high-volatility phases when valuations are depressed relative to protocol fundamentals
- Dollar-cost averaging over 6-12 months to mitigate entry point risk
- Store PIEVERSE tokens securely using Gate.com Web3 Wallet for non-custodial asset management
(2) Active Trading Strategy
-
Technical Analysis Tools:
- Relative Strength Index (RSI): Monitor overbought (>70) and oversold (<30) conditions; current volatility suggests RSI extremes may precede reversals
- Moving Average Convergence: Use 20-day and 50-day exponential moving averages to identify trend direction; price action relative to these levels indicates momentum strength
-
Range Trading Key Points:
- Execute buy orders near support levels ($0.35-$0.36 range based on recent 24h lows)
- Take partial profits during rebounds toward $0.40-$0.42 resistance zones
- Manage position sizing to limit individual trade exposure to 2-3% of portfolio capital
Pieverse Risk Management Framework
(1) Asset Allocation Principles
- Conservative Investors: 1-3% portfolio allocation
- Active Investors: 3-7% portfolio allocation
- Professional Investors: 7-15% portfolio allocation
(2) Risk Mitigation Approaches
- Volatility Hedging: Utilize options or inverse positions on correlated assets when PIEVERSE shows extended overbought conditions
- Stablecoin Reserves: Maintain 30-50% of allocated capital in USDT or USDC to capitalize on sudden price corrections
(3) Secure Storage Solutions
- Non-Custodial Wallet: Gate.com Web3 Wallet for direct self-custody of PIEVERSE tokens with full private key control
- Exchange Custody: Maintain only active trading amounts on Gate.com spot or futures accounts
- Security Best Practices: Enable two-factor authentication (2FA), use hardware-level security keys where possible, never share seed phrases or private keys, regularly verify wallet addresses before transactions
V. Potential Risks and Challenges
Pieverse Market Risks
- High Volatility: 49.98% weekly decline demonstrates extreme price swings; recent peak-to-current drawdown of >63% from ATH indicates limited price stability
- Token Dilution Pressure: Current circulation represents only 17.5% of total supply; future token releases could suppress price appreciation and increase seller pressure
- Liquidity Concentration: $1.75M 24-hour volume across 17 exchanges may insufficient for large institutional orders without significant slippage
Pieverse Regulatory Risks
- Compliance Framework Uncertainty: As a compliance-focused payment protocol, Pieverse operates in heavily regulated market segments; evolving financial services regulations across jurisdictions could impact adoption
- Geographic Restrictions: Payment infrastructure projects face jurisdiction-specific licensing requirements that may limit market expansion
- Tax Classification Ambiguity: Regulatory treatment of Pieverse tokens remains unclear; potential reclassification as securities could trigger compliance obligations
Pieverse Technical Risks
- Protocol Adoption Risk: Core value depends on merchant and platform adoption of Pieverse payment infrastructure; limited current evidence of mainstream integration
- Integration Complexity: x402b extension and Timestamping Alliance success depends on third-party adoption; technical barriers or competing standards could limit utility
- Smart Contract Risk: Bugs or vulnerabilities in protocol contracts could compromise transaction integrity or asset security
VI. Conclusion and Action Recommendations
Pieverse Investment Value Assessment
Pieverse presents a differentiated value proposition within Web3 infrastructure by addressing the critical intersection of blockchain technology and real-world regulatory compliance. The protocol's focus on verifiable invoices, receipts, and timestamping mechanisms addresses genuine market demands from institutional and enterprise users. However, the project remains in relatively early adoption phases with significant execution risk. Recent price volatility—including a ~50% weekly decline from all-time highs—reflects both speculative behavior and genuine market uncertainty regarding protocol adoption rates and token economics.
The current market structure reveals concentration risks: high supply dilution potential combined with moderate trading volumes suggests price movements may be driven by limited capital flows rather than fundamental shifts in protocol adoption metrics.
Pieverse Investment Recommendations
✅ Beginners: Start with minimal positions (0.5-1% portfolio allocation) using dollar-cost averaging over 6-month periods. Focus on educational research regarding payment infrastructure requirements before scaling exposure.
✅ Experienced Investors: Employ range-trading strategies within the $0.35-$0.42 band while maintaining core positions for longer-term infrastructure thesis. Implement 2-3% position sizing per trade with strict stop-loss discipline.
✅ Institutional Investors: Conduct due diligence on merchant adoption metrics, partnership pipeline, and protocol transaction volumes before significant allocations. Consider staged entry over quarters to monitor adoption trajectories before major commitments.
Pieverse Trading Participation Methods
- Spot Trading on Gate.com: Execute direct purchases of PIEVERSE using market, limit, or conditional orders; utilize spot wallets for active trading capital
- Strategic Accumulation: Establish positions during high-volatility phases using gate.com's advanced order types to optimize entry pricing
- Portfolio Integration: Allocate PIEVERSE as a thematic position within broader Web3 infrastructure or fintech exposure, ensuring position sizing remains proportionate to individual risk tolerance
Cryptocurrency investment carries extreme risk. This report does not constitute investment advice. Investors must make decisions based on personal risk tolerance and should consult professional financial advisors. Never invest capital you cannot afford to lose completely. PIEVERSE tokens may experience 50%+ drawdowns within single weeks. Conduct independent research before any investment decision.
FAQ
Will pi coin reach $100?
Pi reaching $100 would require a market cap of approximately $670.8 billion. While possible with significant adoption and ecosystem growth, this represents substantial appreciation from current levels and depends on broader cryptocurrency market expansion.
How much will 1 pi be worth in 2025?
In 2025, 1 pi is expected to be worth between $0.30 and $0.70. This prediction is based on future market trends and network utility development.
Will pi coin reach 500$?
Yes, Pi Coin could potentially reach $500 by 2030 with widespread adoption and strong market demand. Following the Open Mainnet launch, increased trading volume and real-world use cases will be key factors in achieving this price target.
Will Pepe Coin reach $1 dollar?
Unlikely. With 420.69 trillion circulating supply, reaching $1 would require a $420.69 trillion market cap—economically impossible. Realistic peak projection is $0.00005 to $0.0001 during strong bull cycles.
Share
Content
Introduction: Market Position and Investment Value of PIEVERSE
I. PIEVERSE Price History Review and Current Market Status
II. Core Factors Influencing PIEVERSE's Future Price
III. PIEVERSE Price Forecast for 2025-2030
I. Project Overview
II. Market Performance Analysis
III. Technical and Operational Analysis
IV. Pieverse Professional Investment Strategy and Risk Management
V. Potential Risks and Challenges
VI. Conclusion and Action Recommendations
FAQ
How to Buy Cryptocurrency


Trending Cryptocurrencies


XZXX: A Comprehensive Guide to the BRC-20 Meme Token in 2025

Bitcoin Fear and Greed Index: Market Sentiment Analysis for 2025

Top Crypto ETFs to Watch in 2025: Navigating the Digital Asset Boom

5 ways to get Bitcoin for free in 2025: Newbie Guide

Bitcoin Market Cap in 2025: Analysis and Trends for Investors

2025 Bitcoin Price Prediction: Trump's Tariffs' Impact on BTC

Unlocking Flash Loan Opportunities for DeFi Arbitrage
Examining How the BTC/USDT Pair Operates on Trading Platforms

P2P Platform Now Accepts Afghan Afghanis for Trading

Guide to Participating and Claiming Rewards from SEI Network Airdrop

Công Nghệ Blockchain: Tìm Hiểu Hoạt Động Và Ứng Dụng
