2025 SHDW Price Prediction: Expert Analysis and Market Forecast for Shadow Token's Growth Potential


Introduction: SHDW's Market Position and Investment Value
Shadow Token (SHDW), a decentralized storage application built on and optimized for Solana, has established itself as a key infrastructure asset for both web2 and web3 users since its launch. As of December 2025, SHDW boasts a market capitalization of approximately $7.85 million, with a circulating supply of around 169.05 million tokens, currently trading at $0.04646. This innovative storage solution is increasingly playing a critical role in the Solana ecosystem and the broader decentralized storage landscape.
This comprehensive analysis will examine SHDW's price trajectory through 2025-2030, integrating historical patterns, market supply and demand dynamics, ecosystem development progress, and macroeconomic factors to provide investors with professional price forecasts and practical investment strategies.
I. SHDW Price History Review and Current Market Status
SHDW Historical Price Evolution
- March 2024: SHDW reached its all-time high (ATH) of $4.00, representing the peak valuation for the token since its launch.
- August 2019: The project was published at an initial price of $1.73, marking the beginning of SHDW's market journey.
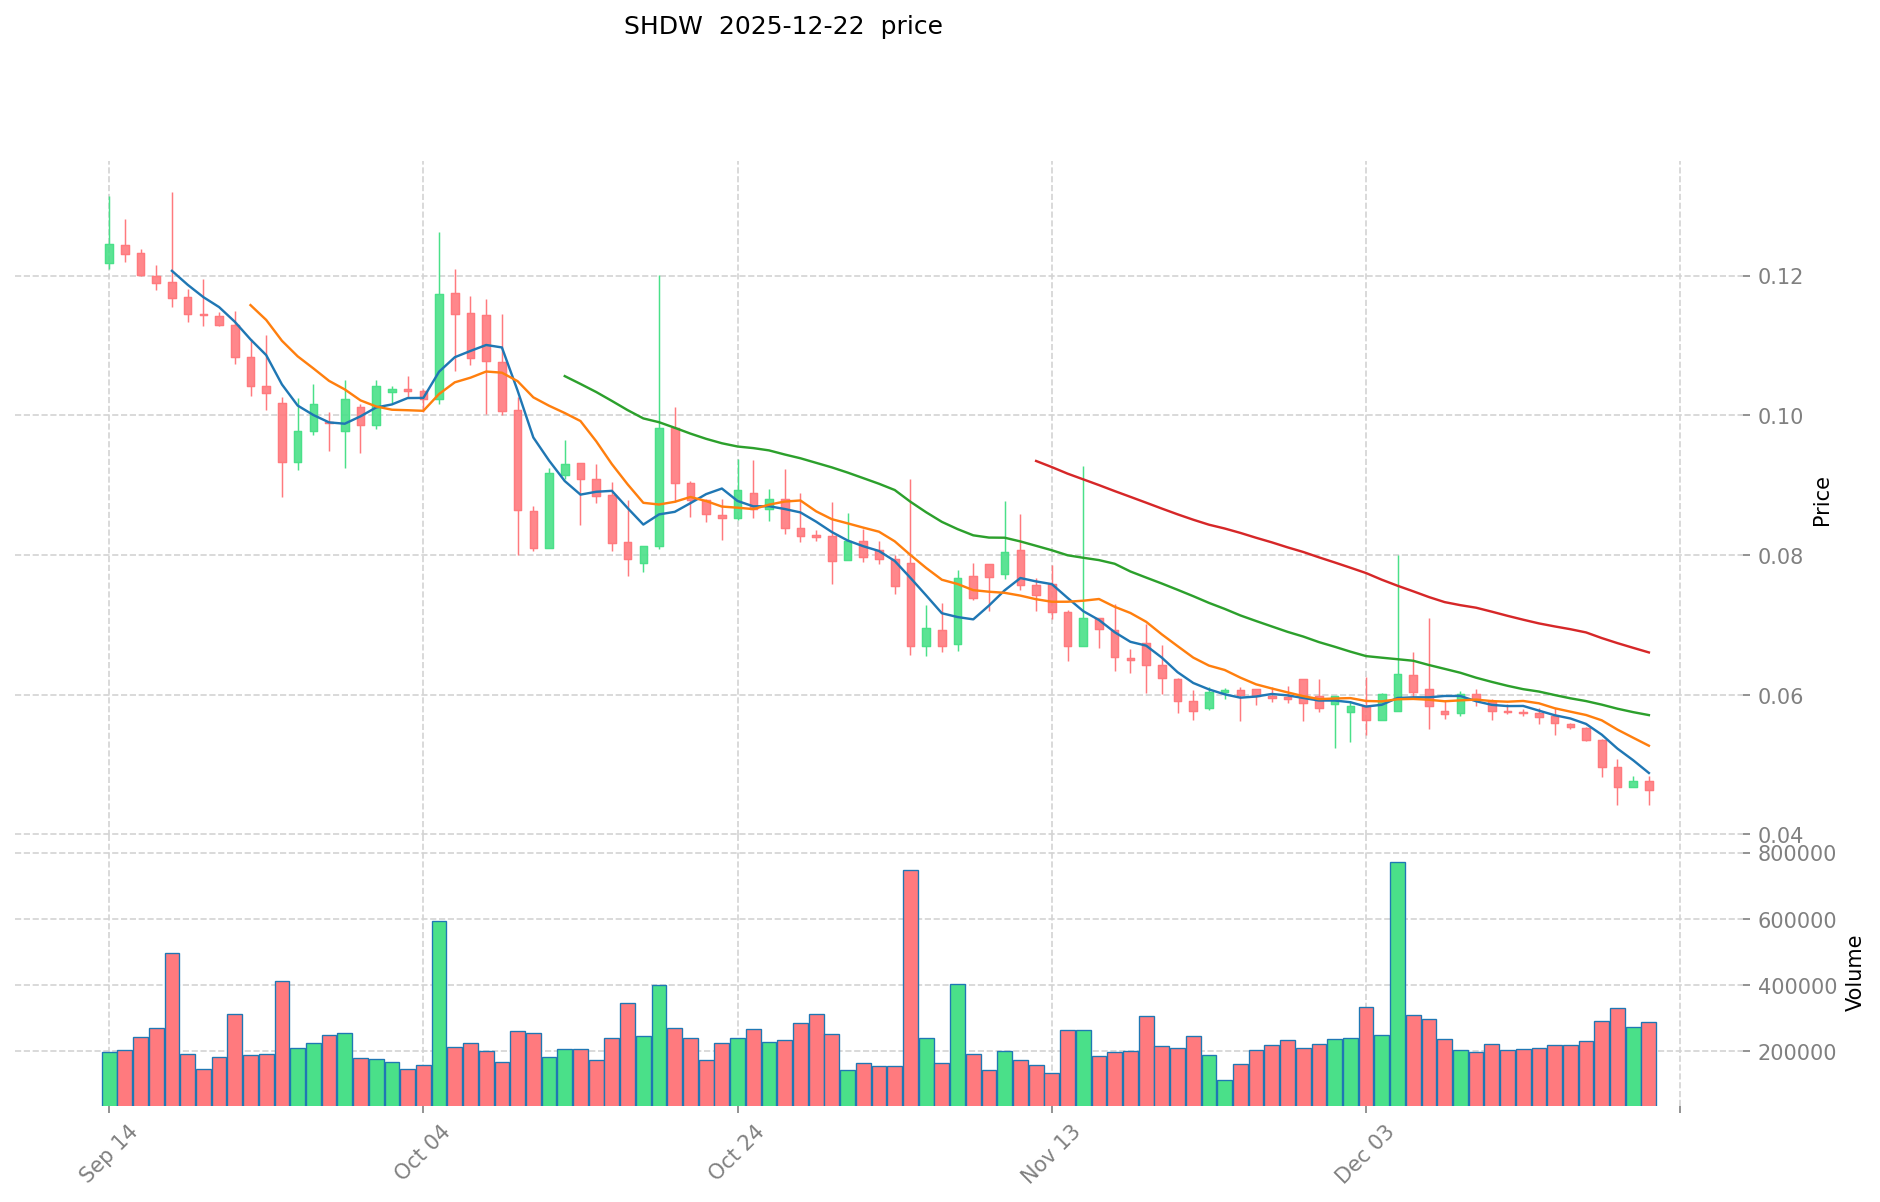
- December 2025: SHDW declined significantly, reaching a new all-time low (ATL) of $0.04415 on December 21, 2025, reflecting a substantial 92.16% year-over-year decline.
SHDW Current Market Status
As of December 22, 2025, Shadow Token (SHDW) is trading at $0.04646, reflecting a modest 24-hour gain of 1.99%. However, the token exhibits significant weakness across broader timeframes, with a 7-day decline of -18.85% and a 30-day loss of -20.76%. The 1-hour performance shows a minor pullback of -0.24%.
Shadow Token maintains a market capitalization of approximately $7.85 million with a circulating supply of 169,054,256.94 SHDW tokens out of a total supply of 169,058,243 tokens. The fully diluted valuation stands at $7.85 million, with circulating tokens representing 99.98% of total supply. The token commands a market share of 0.00024% in the broader cryptocurrency market and currently ranks 1,306th by market capitalization.
The 24-hour trading volume totals $12,586.22, with the token trading within a daily range of $0.04415 to $0.04839. SHDW is held by 87,518 token holders and trades on 4 exchanges, including Gate.com.
Market sentiment indicators suggest extreme fear conditions, with the broader market environment characterized by significant risk aversion affecting asset valuations across the sector.
Click to view current SHDW market price
SHDW Market Sentiment Indicator
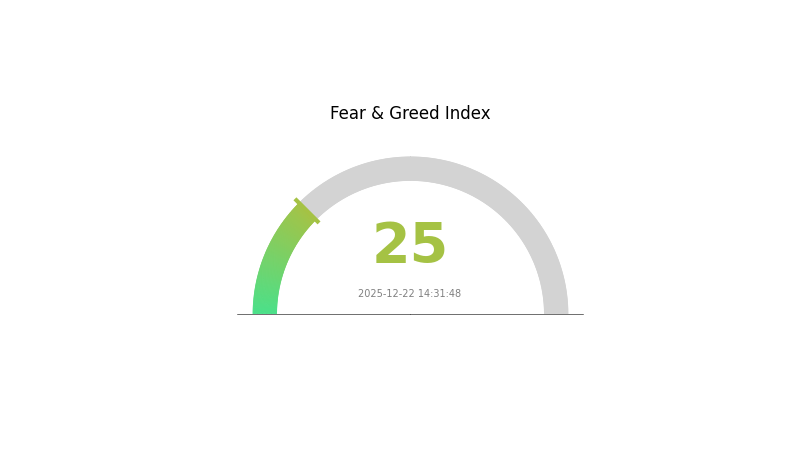
2025-12-22 Fear and Greed Index: 25 (Extreme Fear)
Click to view current Fear & Greed Index
The crypto market is currently experiencing extreme fear, with the Fear and Greed Index dropping to 25. This indicates significant market pessimism and investor anxiety about near-term price movements. During periods of extreme fear, experienced traders often identify potential buying opportunities, as market sentiment tends to be overly pessimistic. However, volatility remains elevated, and risk management is crucial. Monitor market developments closely on Gate.com to stay informed about SHDW and other digital assets as the market navigates this challenging sentiment phase.
SHDW Holdings Distribution
An address holdings distribution chart illustrates how token supplies are distributed across different wallet addresses on the blockchain. This metric serves as a critical indicator for assessing token concentration, market structure health, and potential manipulation risks. By analyzing the top holders and their percentage ownership, investors and analysts can evaluate the decentralization level and stability of a project's token economy.
The current SHDW distribution data reveals a moderate concentration pattern with notable institutional presence. The top holder controls 20.55% of total supply, followed by the second-largest holder with 6.31%, representing a significant gap between the leading address and secondary holders. The top five addresses collectively account for 41.21% of the token supply, while the remaining 58.79% is distributed among other addresses. This distribution structure suggests that while there is concentration at the top tier, the majority of tokens are held by a more dispersed group of smaller holders, which mitigates extreme centralization risks.
From a market structure perspective, the concentration pattern presents a balanced risk profile. The dominant position of the largest holder warrants attention regarding potential price impact and market influence, though the substantial portion held by other addresses provides a degree of resistance against unilateral market manipulation. The relatively healthy distribution beyond the top five addresses indicates a reasonably diversified holder base, which supports longer-term market stability and reduces the likelihood of sudden large-scale liquidations that could destabilize token price dynamics. This composition reflects a token ecosystem with adequate decentralization characteristics while maintaining sufficient institutional participation to support market liquidity and infrastructure development.
Click to view current SHDW holdings distribution

| Top | Address | Holding Qty | Holding (%) |
|---|---|---|---|
| 1 | EbQHXL...oKR1Jy | 34755.09K | 20.55% |
| 2 | 9fxmQ9...ecNAMc | 10667.77K | 6.31% |
| 3 | Bjnfpy...XcXVvn | 9550.05K | 5.64% |
| 4 | 7WwKrC...NsJjSt | 8196.59K | 4.84% |
| 5 | 46BtRi...wJ3QDa | 6544.79K | 3.87% |
| - | Others | 99339.97K | 58.79% |
Core Factors Influencing SHDW's Future Price
Supply Mechanism
-
Token Lockup by Network Operators: Operators locking SHDW as collateral will reduce circulating supply, providing upward price support.
-
Current Impact: Supply dynamics play a significant role in SHDW's price trajectory. Changes in token circulation resulting from operator participation in the network can influence future price performance.
Macroeconomic Environment
-
Monetary Policy Impact: Global monetary conditions are expected to enter a rate-cutting cycle in the coming years. Historical precedent suggests this typically redirects capital flows from USD-centric markets toward emerging market assets with more attractive valuations, potentially benefiting SHDW amid broader crypto market participation.
-
Institutional Capital Influx: The primary growth driver for SHDW involves institutional fund participation in the cryptocurrency market, which has increasingly shifted from retail-driven dynamics to institution-backed investment strategies.
Technology Development and Ecosystem Building
- shdwDrive Storage Network: Monitoring shdwDrive's storage capacity and operator participation metrics is essential for assessing SHDW's ecosystem health and adoption trajectory.
Three. SHDW Price Forecast for 2025-2030
2025 Outlook
- Conservative Forecast: $0.03662 - $0.04635
- Neutral Forecast: $0.04635
- Optimistic Forecast: $0.06628 (requiring sustained demand for decentralized storage solutions)
2026-2028 Medium-term Outlook
- Market Stage Expectation: Gradual recovery phase with increasing adoption of shadow infrastructure and growing institutional interest in decentralized storage ecosystems.
- Price Range Predictions:
- 2026: $0.0535 - $0.07772
- 2027: $0.04557 - $0.07908
- 2028: $0.06282 - $0.09642
- Key Catalysts: Expansion of decentralized storage adoption, improvements in network performance and security, strategic partnerships, and mainstream recognition of privacy-focused solutions.
2029-2030 Long-term Outlook
- Base Case Scenario: $0.07965 - $0.11524 (assuming steady ecosystem development and moderate market growth)
- Optimistic Scenario: $0.09499 - $0.13498 (assuming accelerated adoption of decentralized infrastructure and favorable regulatory environment)
- Transformative Scenario: Above $0.13498 (in case of breakthrough technological innovations, major enterprise adoption, or paradigm shift in decentralized storage market leadership)
Note: Price forecasts are subject to market volatility and various macroeconomic factors. Users are advised to conduct thorough research and consider risk management strategies when trading on platforms like Gate.com. These predictions should not be considered as financial advice.
| 年份 | 预测最高价 | 预测平均价格 | 预测最低价 | 涨跌幅 |
|---|---|---|---|---|
| 2025 | 0.06628 | 0.04635 | 0.03662 | 0 |
| 2026 | 0.07772 | 0.05632 | 0.0535 | 21 |
| 2027 | 0.07908 | 0.06702 | 0.04557 | 44 |
| 2028 | 0.09642 | 0.07305 | 0.06282 | 57 |
| 2029 | 0.11524 | 0.08473 | 0.07965 | 82 |
| 2030 | 0.13498 | 0.09999 | 0.09499 | 115 |
SHDW Investment Strategy and Risk Management Report
IV. SHDW Professional Investment Strategy and Risk Management
SHDW Investment Methodology
(1) Long-term Holding Strategy
- Target Investors: Crypto enthusiasts focused on decentralized storage infrastructure and Solana ecosystem participants
- Operation Recommendations:
- Accumulate SHDW during market downturns, particularly leveraging the 92.16% year-over-year decline as a potential accumulation opportunity
- Maintain positions through network development cycles and product adoption milestones
- Dollar-cost averaging strategy to mitigate volatility exposure given the significant price volatility (-18.85% over 7 days)
(2) Active Trading Strategy
- Technical Analysis Tools:
- Volatility Indicators: Monitor the 24-hour price range ($0.04415 to $0.04839) to identify breakout opportunities
- Support and Resistance Levels: Track historical lows ($0.04415) and all-time highs ($4.00) for entry and exit points
- Wave Trading Key Points:
- Capitalize on short-term momentum shifts, noting the positive 1.99% 24-hour performance
- Establish stop-loss orders below the 24-hour low to manage downside risk
SHDW Risk Management Framework
(1) Asset Allocation Principles
- Conservative Investors: 0.5% to 1% of total portfolio allocation
- Active Investors: 1% to 3% of total portfolio allocation
- Professional Investors: 3% to 5% of total portfolio allocation
(2) Risk Hedging Solutions
- Stablecoin Pairing: Maintain USDT or USDC positions equivalent to 30-50% of SHDW holdings to hedge against sharp downturns
- Portfolio Diversification: Balance SHDW exposure with other Solana ecosystem tokens to reduce concentration risk
(3) Secure Storage Solutions
- Hot Wallet Solution: Gate Web3 wallet for frequent trading and liquidity management
- Cold Storage Approach: Transfer long-term SHDW holdings to hardware wallets for enhanced security
- Security Considerations: Enable two-factor authentication, use hardware security keys, and maintain secure backup of recovery phrases offline
V. SHDW Potential Risks and Challenges
SHDW Market Risk
- Extreme Price Volatility: SHDW has declined 92.16% over the past year, indicating severe price instability and potential for further depreciation
- Low Trading Volume: With only $12,586 in 24-hour volume, the token exhibits low liquidity, making large trades difficult without significant price impact
- Market Capitalization Risk: At $7.85 million, SHDW ranks 1,306th by market cap, positioning it as a micro-cap asset with limited institutional support
SHDW Regulatory Risk
- Decentralized Storage Compliance: Regulatory frameworks for decentralized storage applications remain unclear across jurisdictions, creating uncertainty for long-term viability
- Solana Network Dependency: Regulatory actions targeting Solana or changes to its operational status could directly impact SHDW utility and value
- Securities Classification: Potential reclassification of storage tokens could trigger regulatory complications or delisting from exchanges
SHDW Technical Risk
- Smart Contract Vulnerability: As an SPL token on Solana, SHDW is subject to smart contract risks and potential exploits affecting the broader ecosystem
- Network Congestion: Solana network failures or congestion events could compromise Shadow Token's decentralized storage operations
- Development Abandonment: Limited social engagement and project visibility raise concerns about sustained development and community support
VI. Conclusion and Action Recommendations
SHDW Investment Value Assessment
Shadow Token operates as a decentralized storage solution for web2 and web3 users on the Solana network. While the project addresses a significant market need, its substantial price decline (92.16% year-over-year), low trading volume, and limited market capitalization present considerable challenges. The token's utility depends heavily on adoption rates of Shadow's storage platform and continued development momentum. Current market conditions suggest elevated risk relative to potential returns, making this suitable primarily for speculative investors with high risk tolerance and deep conviction in the decentralized storage thesis.
SHDW Investment Recommendations
✅ Beginners: Avoid direct SHDW positions until market conditions stabilize; consider researching the Shadow protocol and Solana ecosystem fundamentals before committing capital
✅ Experienced Investors: Consider small speculative positions (0.5-2% of portfolio) only after conducting thorough due diligence on the project's technical development and adoption metrics
✅ Institutional Investors: Conduct comprehensive analysis of Shadow Token's competitive positioning within the decentralized storage market before making allocation decisions
SHDW Trading Participation Methods
- Direct Purchase: Acquire SHDW through Gate.com's spot trading markets using USDT or SOL trading pairs
- Dollar-Cost Averaging: Execute scheduled purchases over extended periods to reduce timing risk
- Limit Orders: Utilize limit buy orders near historical support levels ($0.04415) to improve entry pricing
Cryptocurrency investments carry extreme risk. This report is not investment advice. Investors should make decisions based on their risk tolerance and conduct thorough due diligence. Consult professional financial advisors before investing. Never invest more capital than you can afford to lose completely.
FAQ
What is shdw crypto?
SHDW is the utility token powering the Shadow dePIN ecosystem, providing decentralized storage, compute, and network services to users worldwide.
What is the future of Shadow Coin?
By 2026, Shadow Coin is projected to reach a minimum value of $0.043993504 and an average value of $0.045994838 per coin, driven by growing adoption and positive market trends in the Web3 ecosystem.
What factors influence SHDW price predictions?
SHDW price predictions are influenced by market trends, cryptocurrency market performance, project development progress, trading volume, investor sentiment, and macroeconomic factors affecting the broader digital asset ecosystem.
Is SHDW a good investment for long-term holders?
SHDW shows strong long-term potential with predicted 5% returns by 2026. Its growing ecosystem and solid fundamentals make it attractive for patient investors seeking gradual wealth accumulation.
Share
Content
Introduction: SHDW's Market Position and Investment Value
I. SHDW Price History Review and Current Market Status
Supply Mechanism
Macroeconomic Environment
Technology Development and Ecosystem Building
2025 Outlook
2026-2028 Medium-term Outlook
2029-2030 Long-term Outlook
IV. SHDW Professional Investment Strategy and Risk Management
V. SHDW Potential Risks and Challenges
VI. Conclusion and Action Recommendations
FAQ
How to Buy Cryptocurrency


Trending Cryptocurrencies


Is Nosana (NOS) a good investment?: A Comprehensive Analysis of Market Potential, Tokenomics, and Future Prospects

How to convert SOL to USD: Real-time Solana price calculator

2025 POPCAT Price Prediction: Exploring Future Market Trends and Investment Potential in the Digital Feline Economy

2025 RAYPrice Prediction: Analyzing Growth Factors and Market Potential for RAY Token in the Coming Years

2025 RAY Price Prediction: Will This Layer-1 Protocol Reach New Heights in the Evolving DeFi Landscape?

2025 BOMEPrice Prediction: Navigating Market Trends and Investment Opportunities in a Volatile Economy
Guide to Purchasing Tether (USDT) with INR in India

Can Shiba Inu's Price Hit 1 Rupee? Future Predictions for SHIB
Bitcoin Rainbow Chart: Summary and Applications
Effortless NFT Minting Solutions for Solana and Beyond
Understanding Sand Coin (SAND): A Comprehensive Guide