2025 TRADE Price Prediction: Expert Analysis and Market Forecast for the Coming Year

Introduction: Market Position and Investment Value of TRADE
Polytrade (TRADE), a blockchain-based decentralized protocol designed to transform accounts receivable financing, has established itself as a bridge connecting buyers, sellers, insurance companies, and investors since its launch in 2021. As of 2025, TRADE has achieved a market capitalization of approximately $5,941,000 with a circulating supply of 100,000,000 tokens, currently trading at around $0.05941. This innovative asset, recognized for its role in simplifying real-world asset financing and delivering seamless trading experiences, is increasingly playing a critical role in modernizing accounts receivable financing for the blockchain ecosystem.
This article will provide a comprehensive analysis of TRADE's price dynamics from 2025 through 2030, integrating historical price patterns, market supply-demand dynamics, ecosystem development, and macroeconomic factors to deliver professional price forecasts and actionable investment strategies for investors.
Polytrade (TRADE) Market Analysis Report
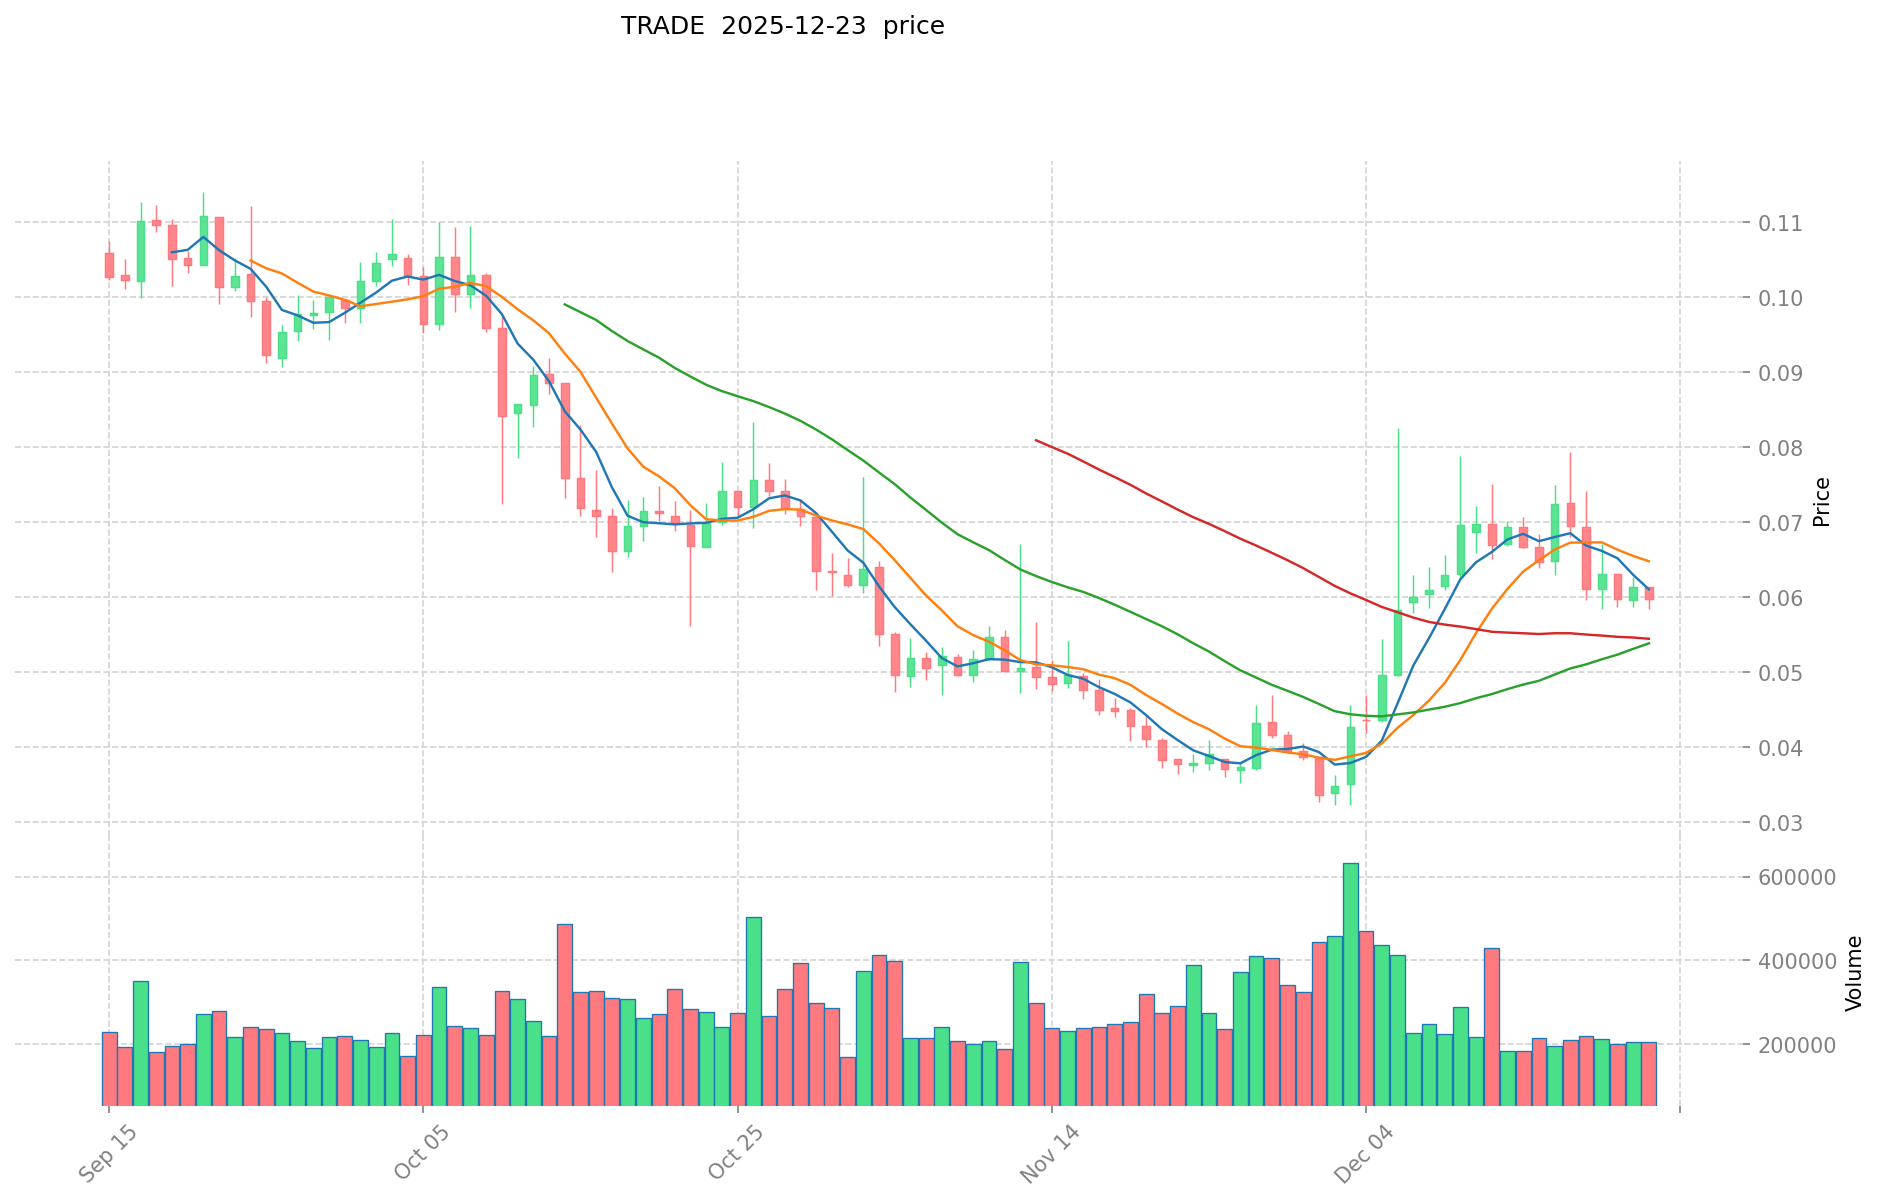
I. TRADE Price History Review and Current Market Status
TRADE Historical Price Evolution Trajectory
- April 2024: All-time high (ATH) reached at $3.03, representing the peak valuation period for the token.
- December 2025: All-time low (ATL) recorded at $0.03285692 on December 3, 2025, marking a significant decline from historical peaks.
TRADE Current Market Performance
As of December 23, 2025, TRADE is trading at $0.05941, reflecting a market capitalization of $5,941,000 with a fully diluted valuation (FDV) also standing at $5,941,000. This indicates that all 100,000,000 tokens in the total supply are currently in circulation, representing 100% of the circulating ratio.
Over the past 24 hours, TRADE has experienced a -1.59% decline, with the token fluctuating between $0.05833 (24-hour low) and $0.06086 (24-hour high). The hourly performance shows a marginal +0.22% gain, while the 7-day period exhibits more pronounced weakness with a -8.49% pullback. However, the 30-day timeframe presents a contrasting picture, with TRADE recording a +57.74% increase from its recent lows.
On a longer-term basis, the token has deteriorated significantly over the past year, posting a -89.83% decline from its 12-month high. The trading volume over the last 24 hours stands at approximately $12,339.99694, indicating moderate liquidity activity. TRADE maintains a market dominance of 0.00018%, reflecting its relatively small position within the broader cryptocurrency market. The token is ranked 1442 by market capitalization and is accessible across three cryptocurrency exchanges, with a holder base of 3,893 addresses.
Click to view current TRADE market price
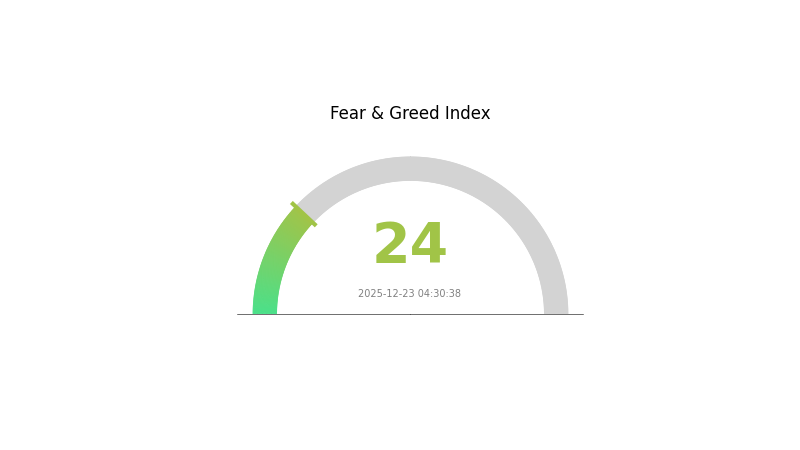
TRADE Market Sentiment Index
2025-12-23 Fear and Greed Index: 24(Extreme Fear)
Click to view current Fear & Greed Index
The cryptocurrency market is experiencing extreme fear, with the Fear and Greed Index dropping to 24. This indicates severe market pessimism and widespread investor anxiety. Such extreme fear levels often present contrarian opportunities for long-term investors, as excessive panic selling may create potential entry points. However, caution remains warranted as downward momentum could persist. Monitor key support levels closely and consider dollar-cost averaging strategies to manage risk during this volatile period.
TRADE Holdings Distribution
The holdings distribution map illustrates how TRADE tokens are distributed across different blockchain addresses, serving as a critical indicator of token concentration and decentralization. By analyzing the proportion of tokens held by major addresses, we can assess market structure integrity, potential manipulation risks, and the overall health of the token ecosystem.
The current distribution data reveals a significant concentration concern for TRADE. The leading address (0x40ec...5bbbdf) controls 67.27% of the total supply, representing an extraordinarily high level of centralization. When combined with the second and third largest holders accounting for 8.25% and 4.23% respectively, the top three addresses collectively command 79.75% of all TRADE tokens. This extreme concentration substantially deviates from a healthy decentralized distribution model and raises considerable governance and market stability concerns. The remaining addresses, including the fourth and fifth largest holders and other participants, collectively hold only 20.25% of the supply, indicating a highly skewed distribution pattern.
Such pronounced token concentration presents notable risks to market dynamics and ecosystem governance. The dominant holder possesses disproportionate influence over price discovery, liquidity provision, and protocol decision-making. A sudden liquidation or strategic movement by the primary address could trigger significant price volatility and market disruption. Furthermore, this centralized structure undermines the decentralization principles fundamental to blockchain networks and may limit the token's long-term adoption potential. The current distribution suggests that TRADE remains in an early or concentrated distribution phase, with substantial risk exposure dependent on the actions and intentions of a small number of major stakeholders.
Click to view current TRADE holdings distribution
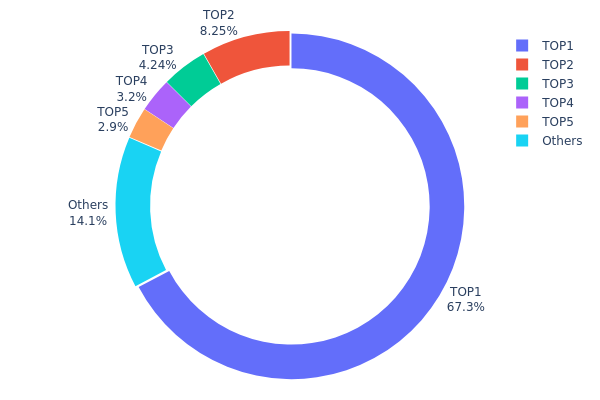
| Top | Address | Holding Qty | Holding (%) |
|---|---|---|---|
| 1 | 0x40ec...5bbbdf | 67275.04K | 67.27% |
| 2 | 0x42ae...82108e | 8251.61K | 8.25% |
| 3 | 0x5207...22a9f8 | 4239.34K | 4.23% |
| 4 | 0xcd98...e7ff7e | 3200.00K | 3.20% |
| 5 | 0x0811...087f02 | 2900.00K | 2.90% |
| - | Others | 14134.01K | 14.15% |
II. Core Factors Influencing TRADE's Future Price
Supply and Demand Dynamics
-
Market Supply and Demand: The fundamental driver of TRADE's price movement is the interplay between market supply and demand. When market demand exceeds supply, prices typically rise; conversely, when supply outpaces demand, prices tend to decline. The current spot price also has a feedback effect on future market supply and demand structure trends.
-
Historical Patterns: Historical experience demonstrates that supply and demand changes directly determine subsequent price trajectories for trading assets. Understanding these patterns helps predict future price movements and market structure evolution.
-
Current Impact: As crypto assets remain relatively high-risk investments, TRADE's price is particularly sensitive to shifts in market sentiment and risk appetite, which influence supply and demand dynamics in the market.
Macroeconomic Environment
-
Monetary Policy Impact: Macroeconomic data including GDP, inflation rates, and unemployment figures, along with policy adjustments such as interest rate decisions and monetary policy changes, have direct effects on market movements. TRADE, as a crypto asset, responds to broader macroeconomic conditions and central bank policy expectations.
-
Geopolitical Factors: Policy changes and geopolitical events can significantly impact price movements. Tariff policies and international trade dynamics, for example, affect all asset classes including cryptocurrencies, particularly affecting high-risk assets like TRADE.
-
Market Sentiment: Market sentiment fluctuations, typically influenced by news, policy announcements, or sudden events, can lead to short-term dramatic price volatility. Investor sentiment analysis has become an important tool for determining market direction.
Three, 2025-2030 TRADE Price Forecast
2025 Outlook
- Conservative Forecast: $0.0409 - $0.05928
- Neutral Forecast: $0.05928
- Optimistic Forecast: $0.06106 (requires sustained market interest and positive ecosystem developments)
2026-2027 Medium-term Outlook
- Market Phase Expectations: Gradual recovery phase with increasing institutional adoption and platform expansion
- Price Range Predictions:
- 2026: $0.0349 - $0.0722
- 2027: $0.06288 - $0.08273
- Key Catalysts: Enhanced blockchain utility, ecosystem partnerships, increased trading volume on Gate.com and other platforms, market sentiment recovery
2028-2030 Long-term Outlook
- Base Case Scenario: $0.07446 - $0.08442 (assuming steady adoption and market normalization)
- Optimistic Scenario: $0.08712 - $0.09118 (assuming accelerated enterprise adoption and strengthened market fundamentals)
- Transformational Scenario: $0.09118+ (extreme favorable conditions including breakthrough technological innovations, mainstream institutional investment, and significant ecosystem expansion)
- Market Trajectory: TRADE demonstrates projected cumulative appreciation of approximately 42% by 2030, reflecting anticipated long-term value creation through network growth and utility expansion
| 年份 | 预测最高价 | 预测平均价格 | 预测最低价 | 涨跌幅 |
|---|---|---|---|---|
| 2025 | 0.06106 | 0.05928 | 0.0409 | 0 |
| 2026 | 0.0722 | 0.06017 | 0.0349 | 1 |
| 2027 | 0.08273 | 0.06619 | 0.06288 | 11 |
| 2028 | 0.08712 | 0.07446 | 0.03946 | 25 |
| 2029 | 0.08806 | 0.08079 | 0.0614 | 35 |
| 2030 | 0.09118 | 0.08442 | 0.05488 | 42 |
Polytrade (TRADE) Investment Strategy and Risk Management Report
I. Executive Summary
Polytrade (TRADE) is a blockchain-based decentralized protocol designed to transform accounts receivable financing by connecting buyers, sellers, insurance companies, and investors. As of December 23, 2025, TRADE is trading at $0.05941 with a market capitalization of $5,941,000 and a 24-hour trading volume of $12,339.99. The token has experienced significant volatility, with a year-to-date decline of 89.83% from its all-time high of $3.03 reached on April 1, 2024.
II. Polytrade Project Overview
Project Mission and Vision
Polytrade operates as a decentralized platform aimed at simplifying accounts receivable financing. The protocol seeks to provide real-world borrowers with low-interest and expedited financing services while enabling crypto lenders to access critical operational capital. The project bridges traditional finance with the cryptocurrency ecosystem by bringing insured real-world assets to the crypto market.
Technical Infrastructure
Blockchain Networks:
- Ethereum (ETH): Contract address 0x6e5970dbd6fc7eb1f29c6d2edf2bc4c36124c0c1
- Binance Smart Chain (BSC): Contract address 0x6ba7a8f9063c712c1c8cabc776b1da7126805f3b
- Polygon (MATIC): Contract address 0x692AC1e363ae34b6B489148152b12e2785a3d8d6
Token Economics:
- Current Price: $0.05941
- Circulating Supply: 100,000,000 TRADE
- Total Supply: 100,000,000 TRADE
- Maximum Supply: Unlimited
- Market Cap: $5,941,000
- Fully Diluted Valuation: $5,941,000
- Active Holders: 3,893
Market Performance
Price Trends:
- 1-hour change: +0.22%
- 24-hour change: -1.59%
- 7-day change: -8.49%
- 30-day change: +57.74%
- 1-year change: -89.83%
- All-Time High: $3.03 (April 1, 2024)
- All-Time Low: $0.03285692 (December 3, 2025)
Market Position:
- Global Ranking: #1,442
- Market Share: 0.00018%
- Trading on 3 exchanges
- 24-hour trading range: $0.05833 - $0.06086
III. Investment Strategy and Risk Management Framework
Investment Methodology for TRADE
(1) Long-Term Holding Strategy
-
Target Investors: Conservative investors focused on real-world asset tokenization exposure and those believing in DeFi infrastructure development for traditional finance integration.
-
Operational Recommendations:
- Dollar-cost averaging (DCA) approach: Invest fixed amounts at regular intervals to reduce timing risk
- Extended holding period: Minimum 12-24 months to allow the protocol ecosystem to mature and gain adoption
- Stake rewards monitoring: Track any staking or yield opportunities offered through the Polytrade protocol
-
Storage Solution: Utilize Gate.com Web3 Wallet for secure token custody with backup seed phrases stored offline in a secure location.
(2) Active Trading Strategy
-
Technical Analysis Tools:
- Support/Resistance Levels: Identify key price floors at $0.05-0.06 range and resistance at previous highs; use these for entry/exit signals
- Volume Analysis: Monitor 24-hour trading volume ($12,339.99) for breakout confirmation; increased volume suggests stronger directional moves
-
Swing Trading Key Points:
- Entry signals: Position when price touches identified support levels with volume confirmation
- Exit targets: Take profits at identified resistance levels or when 7-day moving average turns negative
Risk Management Framework for TRADE
(1) Asset Allocation Principles
- Conservative Investors: 1-3% of portfolio allocation
- Aggressive Investors: 3-7% of portfolio allocation
- Professional Investors: 5-10% of portfolio allocation with structured risk controls
(2) Risk Hedging Solutions
- Portfolio Diversification: Balance TRADE holdings with other blockchain infrastructure tokens to reduce concentration risk
- Stop-Loss Strategy: Implement hard stops at 15-20% below entry price to protect against catastrophic losses
(3) Secure Storage Solutions
- Hot Wallet Approach: Gate.com Web3 Wallet for frequent trading with limited holdings
- Cold Storage Strategy: For long-term holdings, maintain private keys offline with multi-signature backup protocols
- Security Considerations: Enable two-factor authentication on exchange accounts, use strong unique passwords, never share private keys, and regularly audit wallet permissions
IV. Potential Risks and Challenges
Market Risks
- Price Volatility: TRADE has experienced extreme volatility with an 89.83% year-to-date decline, indicating high sensitivity to market sentiment and liquidity conditions
- Limited Liquidity: With 24-hour volume of only $12,339.99, the token faces significant liquidity constraints that could amplify price movements during large trades
- Low Market Capitalization: The $5,941,000 market cap represents a very small market, making the project vulnerable to pump-and-dump scenarios and rapid devaluation
Regulatory Risks
- DeFi Compliance Uncertainty: As decentralized finance continues to face evolving regulatory scrutiny globally, Polytrade's accounts receivable financing model may face legal challenges
- Real-World Asset Tokenization: The intersection of RWA (Real-World Assets) and cryptocurrency remains largely unregulated in most jurisdictions, creating potential compliance issues
- Financial Services Classification: Regulatory authorities may classify Polytrade's activities as securities offerings or financial services, triggering stricter requirements
Technical Risks
- Smart Contract Vulnerability: Any undiscovered vulnerabilities in the Polytrade protocol's smart contracts could result in funds loss
- Oracle Risk: Accounts receivable financing relies on accurate real-world data feeds; manipulation or failures could compromise protocol integrity
- Cross-Chain Bridge Risk: Operations across Ethereum, BSC, and Polygon chains introduce additional technical complexities and potential failure points
V. Conclusion and Action Recommendations
Investment Value Assessment
Polytrade represents a speculative investment in an emerging DeFi protocol targeting real-world asset financing. The project addresses a significant market gap by connecting traditional accounts receivable markets with blockchain technology. However, the extreme price decline of 89.83% year-to-date, limited liquidity, and small market capitalization indicate a high-risk, early-stage venture. The 3,893 token holders suggest limited adoption and network effects remain underdeveloped.
Investment Recommendations
✅ Beginners: Start with minimal allocation (0.5-1% of crypto portfolio) only after thorough research. Use Gate.com platform for secure trading and begin with small test positions to understand market dynamics before scaling involvement.
✅ Experienced Investors: Consider 2-5% allocation with active monitoring of protocol updates and ecosystem development. Implement technical analysis strategies with clear stop-loss levels and diversify across multiple DeFi exposure channels.
✅ Institutional Investors: Conduct comprehensive due diligence on Polytrade's technological framework, team credentials, and regulatory landscape. Consider structured positions with derivative hedging and maintain regular risk assessment protocols.
Ways to Participate in TRADE Trading
- Spot Trading: Purchase TRADE directly through Gate.com's spot market with real-time price discovery
- Technical Analysis Trading: Execute swing trades based on support/resistance levels and volume confirmation signals
- Dollar-Cost Averaging: Execute systematic purchases at fixed intervals to accumulate positions while reducing timing risk
Cryptocurrency investments carry extreme risk. This report does not constitute investment advice. All investors should carefully consider their risk tolerance and personal financial situation before making investment decisions. It is strongly recommended to consult with professional financial advisors. Never invest more capital than you can afford to lose completely.
FAQ
What is the TRADE token? What are its main uses?
TRADE token is a digital asset issued for crypto trading platforms, primarily used for transaction fee discounts, rewards, and governance. It enhances user engagement and loyalty while providing trading benefits and ecosystem participation opportunities.
How to predict TRADE token price trends? What technical analysis methods can be used?
Predict TRADE price using technical analysis methods like moving averages and RSI indicators. Chart patterns such as golden cross and death cross provide useful signals for identifying potential price movements and trends.
How has TRADE token's historical price performance been? What are the main factors affecting its price?
TRADE token has experienced significant price volatility driven by market demand, trading volume, project development progress, and regulatory policies. Key factors include market sentiment shifts, technological innovations, and ecosystem growth metrics.
How accurate is AI or machine learning models in predicting TRADE token prices?
AI and machine learning models can enhance TRADE price prediction accuracy by detecting market patterns. However, accuracy depends on data quality, model complexity, and market volatility. Results vary based on specific applications and real-time conditions.
How does TRADE token's price volatility and risk compare to other major cryptocurrencies?
TRADE exhibits higher volatility than Bitcoin and Ethereum due to its lower market maturity. As an emerging token, it experiences more pronounced price swings influenced by market sentiment and trading activity, presenting greater risk but also higher potential returns for traders.
Share
Content
Introduction: Market Position and Investment Value of TRADE
I. TRADE Price History Review and Current Market Status
II. Core Factors Influencing TRADE's Future Price
Three, 2025-2030 TRADE Price Forecast
I. Executive Summary
II. Polytrade Project Overview
III. Investment Strategy and Risk Management Framework
IV. Potential Risks and Challenges
V. Conclusion and Action Recommendations
FAQ
How to Buy Cryptocurrency


Trending Cryptocurrencies


How Does Crypto Competitor Analysis Drive Market Share Growth in 2025?

What is SWCH: A Comprehensive Guide to Switched-On Communications and Hybrid Technology

Will Crypto Recover in 2025?

Pre-Market Crypto Trading: How to Get Early Access Before Tokens List
Why TRX Could Hit $1 Sooner Than You Think

What Is Avalanche (AVAX)?

Is CEEK Smart VR Token (CEEK) a good investment?: A Comprehensive Analysis of Market Potential, Risk Factors, and Future Prospects

Is Crown by Third Time Games (CRWN) a good investment?: A Comprehensive Analysis of Tokenomics, Market Potential, and Risk Factors

Is XDB CHAIN (XDB) a good investment?: A Comprehensive Analysis of Price Potential, Technology, and Market Viability in 2024
Is Clore.ai (CLORE) a good investment?: A Comprehensive Analysis of the GPU Computing Platform's Market Potential and Risk Factors
MicroStrategy Bitcoin Strategy: How Corporate Reserve Strategies Impact Crypto Markets