2025 U Price Prediction: Expert Analysis and Market Forecast for the Coming Year


Introduction: Union's Market Position and Investment Value
Union (U) stands as the leading zero-knowledge (ZK) interoperability Layer 1 blockchain, functioning as a settlement and liquidity layer for protocols and asset issuers. Since its inception, Union has established itself as a pioneering solution in the cross-chain ecosystem, distinguishing itself through its trustless architecture that eliminates dependencies on trusted third parties, oracles, multi-signatures, or MPC.
As of December 23, 2025, Union commands a market capitalization of approximately $28.68 million, with a circulating supply of 1.919 billion U tokens trading at $0.002868. This innovative "hyper-efficient ZK interop layer" is playing an increasingly critical role in enabling seamless asset issuance and scaling across thousands of chains without compromising security, efficiency, decentralization, or speed—positioning Union at the forefront of the cross-chain settlement revolution.
This article provides a comprehensive analysis of Union's price trajectory and market dynamics, integrating historical patterns, supply-demand mechanics, ecosystem developments, and macroeconomic factors to deliver professional price forecasts and actionable investment strategies for the period through 2030.
Union (U) Market Analysis Report
I. U Price History Review and Current Market Status
U Historical Price Trajectory
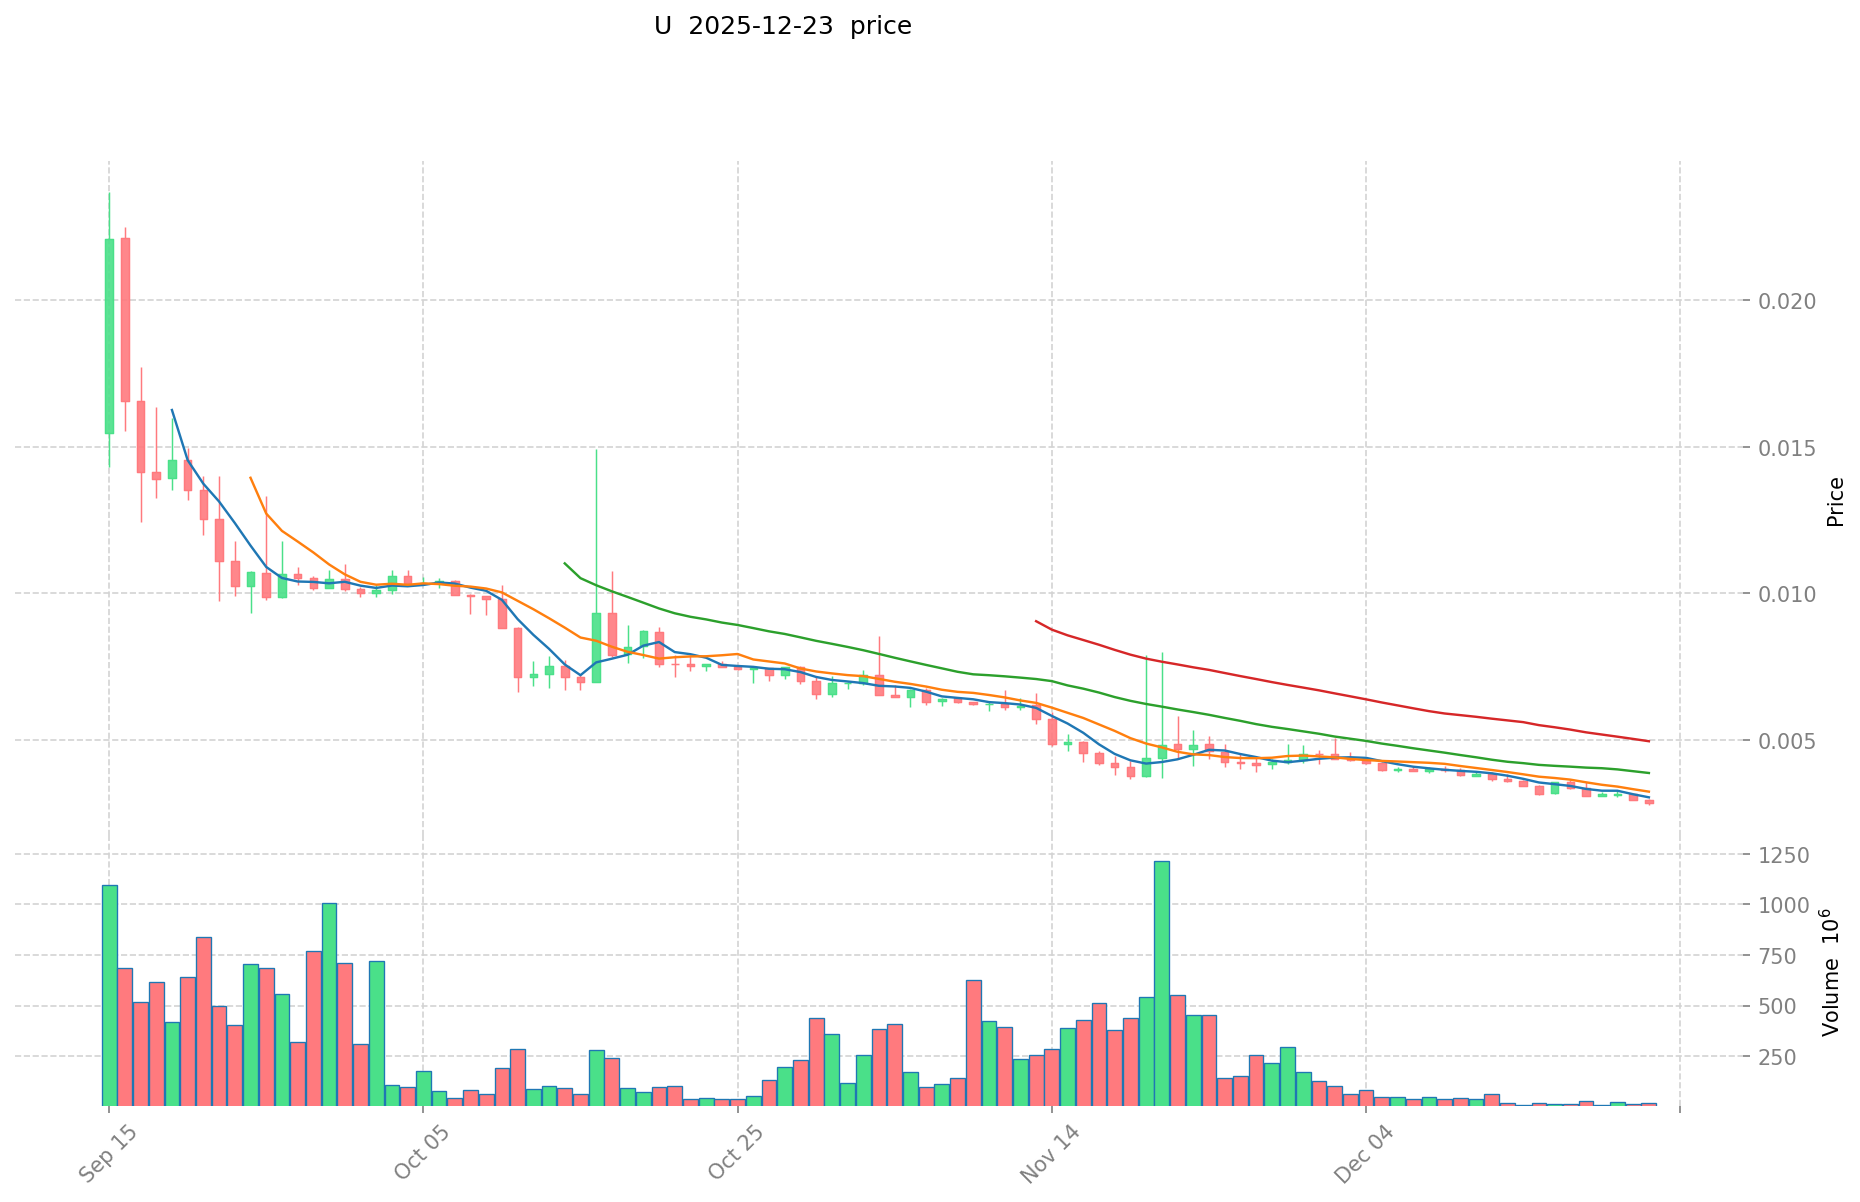
- September 4, 2025: All-time high (ATH) reached at $0.03651, representing peak market valuation during the token's trading history.
- December 22, 2025: All-time low (ATL) recorded at $0.00276, marking the lowest point in the token's price discovery process.
- December 23, 2025: Current price stands at $0.002868, reflecting a significant 89.40% decline over the past year.
U Current Market Condition
As of December 23, 2025, Union (U) is trading at $0.002868 with a 24-hour trading volume of $48,623.82. The token has experienced a marginal decline of 0.89% in the past 24 hours, though it gained 0.16% in the last hour. Over the 7-day period, U has declined 11.09%, with a more pronounced 37.06% decrease over the past 30 days.
The fully diluted valuation (FDV) stands at $28.68 million, with a circulating market capitalization of $5.50 million. The circulating supply comprises 1.92 billion U tokens out of a total supply of 10 billion tokens, representing 19.19% circulation. Union maintains a market dominance of 0.0009%, with 13 active trading pairs across exchanges and approximately 5,435 token holders.
Current market sentiment indicates "Extreme Fear," reflecting heightened volatility and risk aversion in the broader cryptocurrency market.
Click to view current U market price
U Market Sentiment Index
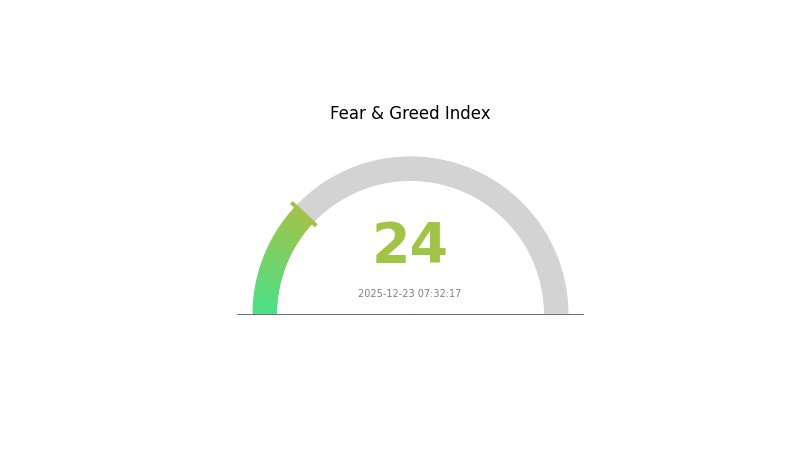
2025-12-23 Fear and Greed Index: 24 (Extreme Fear)
Click to view current Fear & Greed Index
The crypto market is currently experiencing extreme fear with an index reading of 24. This indicates significant market pessimism and heightened risk aversion among investors. During such periods, assets are often oversold, creating potential buying opportunities for contrarian investors. However, caution is advised as further downside movements remain possible. Monitor key support levels closely and consider dollar-cost averaging strategies to mitigate volatility risks. Extreme fear readings historically precede market recoveries, but patience and disciplined risk management are essential during this uncertain period.
U Holdings Distribution
Address holding distribution refers to the on-chain concentration of token ownership across different wallet addresses. This metric provides critical insights into the decentralization level, market structure, and potential systemic risks within the U ecosystem. By analyzing the top holders and their respective share of total supply, researchers can assess the degree of wealth concentration and evaluate the vulnerability of the asset to potential market manipulation or sudden liquidity shocks.
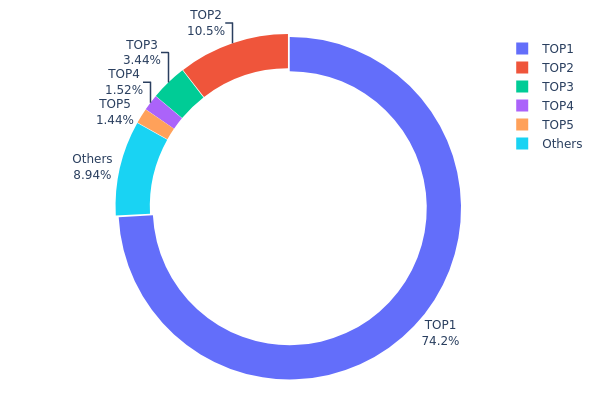
The current holding distribution data reveals a highly concentrated ownership structure, with significant concentration risk present in the U market. The top holder commands 74.16% of total supply, representing an extraordinarily dominant position that far exceeds typical decentralization benchmarks. The combined holdings of the top five addresses account for approximately 91.03% of all U tokens in circulation, leaving only 8.97% distributed among all other holders. This extreme concentration indicates a market structure dominated by a small number of large stakeholders, which raises substantial concerns regarding the asset's true decentralization credentials and governance resilience.
Such pronounced concentration creates meaningful implications for market dynamics and stability. The overwhelming control by a handful of addresses significantly amplifies the potential for price manipulation and introduces substantial liquidity concentration risks. A sudden liquidation or transfer decision by any of the top three holders could trigger substantial price volatility. Furthermore, the minimal distribution among smaller holders suggests limited retail participation and diffused stake-holding incentives, potentially reducing the ecosystem's organic growth trajectory and long-term sustainability. The current distribution pattern reflects a market structure that remains heavily dependent on major stakeholder confidence rather than broad-based community support.
Click to view current U Holdings Distribution
| Top | Address | Holding Qty | Holding (%) |
|---|---|---|---|
| 1 | 0xd31e...92c638 | 6459374.23K | 74.16% |
| 2 | 0x5fbe...1aeb03 | 913321.22K | 10.48% |
| 3 | 0x6fdb...f7abcf | 300001.00K | 3.44% |
| 4 | 0xf89d...5eaa40 | 132813.95K | 1.52% |
| 5 | 0xaf92...51f683 | 124996.23K | 1.43% |
| - | Others | 778925.19K | 8.97% |
II. Core Factors Influencing U's Future Price
Macroeconomic Environment
-
Market Sentiment and Regulatory Dynamics: Overall cryptocurrency market bullish or bearish sentiment, regulatory developments, institutional adoption rates, and broader macroeconomic factors all have significant impacts on individual token prices.
-
Institutional Investment and Market Adoption: Institutional investment participation and mainstream application adoption play important roles in shaping future valuations.
Three、2025-2030 U Price Forecast
2025 Outlook
- Conservative Forecast: $0.00229 - $0.00286
- Neutral Forecast: $0.00286 - $0.00343
- Optimistic Forecast: $0.00401 (requires sustained market momentum and positive sentiment)
2026-2027 Mid-term Outlook
- Market Stage Expectations: Gradual recovery phase with consolidation patterns, characterized by moderate volatility and incremental price appreciation
- Price Range Forecast:
- 2026: $0.00254 - $0.00367
- 2027: $0.00217 - $0.00430
- Key Catalysts: Ecosystem development progress, increased institutional adoption, market cycle recovery patterns, and regulatory clarity in major markets
2028-2030 Long-term Outlook
- Base Case Scenario: $0.00393 - $0.00562 (assuming steady market growth and continued development of underlying protocols)
- Optimistic Scenario: $0.00537 - $0.00597 (assuming accelerated adoption and positive macroeconomic conditions)
- Transformation Scenario: $0.00597+ (extreme favorable conditions including mainstream integration, significant technological breakthroughs, and sustained bull market cycle)
Note: These forecasts are based on historical trend analysis and market modeling. Actual price movements may vary significantly based on market conditions, regulatory developments, and macroeconomic factors. Investors should conduct their own research and consider risk management strategies when trading on platforms such as Gate.com.
| 年份 | 预测最高价 | 预测平均价格 | 预测最低价 | 涨跌幅 |
|---|---|---|---|---|
| 2025 | 0.00401 | 0.00286 | 0.00229 | 0 |
| 2026 | 0.00367 | 0.00343 | 0.00254 | 19 |
| 2027 | 0.0043 | 0.00355 | 0.00217 | 23 |
| 2028 | 0.00562 | 0.00393 | 0.00271 | 36 |
| 2029 | 0.00597 | 0.00477 | 0.00253 | 66 |
| 2030 | 0.00558 | 0.00537 | 0.00446 | 87 |
Union (U) Token: Professional Investment Strategy and Risk Management Report
IV. U Professional Investment Strategy and Risk Management
U Investment Methodology
(1) Long-term Holding Strategy
-
Target Investor Profile: Long-term blockchain infrastructure believers, risk-tolerant investors with 2-5 year investment horizons, and those seeking exposure to zero-knowledge interoperability innovation.
-
Operational Recommendations:
- Dollar-Cost Averaging (DCA): Establish regular purchasing schedules across different market cycles to reduce timing risk and average entry costs. Given U's 19.19% circulation ratio, accumulated positions can be built systematically over time.
- Milestone-Based Accumulation: Increase position sizes when Union achieves protocol milestones, such as expanding supported chain numbers or achieving technical upgrades in cross-chain settlement efficiency.
- Storage Solution: Transfer acquired tokens to secure storage upon reaching significant holdings. Utilize Gate.com's Web3 Wallet for seamless access to DeFi opportunities while maintaining personal custody. Ensure private keys are backed up securely offline for critical holdings.
(2) Active Trading Strategy
-
Technical Analysis Tools:
- Support and Resistance Levels: Monitor historical price zones ($0.00276 as recent support from ATL on December 22, 2025; $0.03651 as resistance from ATH on September 4, 2025) to identify optimal entry and exit points.
- Moving Averages and Trend Indicators: Apply 7-day and 30-day moving average crossovers to confirm trend direction. Given the 30-day decline of -37.059% and 7-day decline of -11.09%, trend-following strategies require careful calibration.
-
Swing Trading Key Points:
- Volatility Window Exploitation: Identify ranging periods and trade between support-resistance bands when major directional catalysts are absent.
- News-Driven Entries: Position ahead of potential announcements regarding new chain integrations, protocol partnerships, or technical implementations that could drive sentiment reversal.
U Risk Management Framework
(1) Asset Allocation Principles
- Conservative Investors: 1-3% maximum allocation of total portfolio to Union. This reflects the token's mid-cap volatility and emerging technology risks while maintaining speculative exposure.
- Aggressive Investors: 5-10% allocation, suitable for those with high risk tolerance and conviction in zero-knowledge interoperability solutions' long-term potential.
- Professional Investors: Up to 15% as part of a diversified blockchain infrastructure allocation, with additional hedging strategies employed.
(2) Risk Hedging Solutions
- Stablecoin Reserve Strategy: Maintain 50-70% of allocated capital in stablecoins during high volatility periods, such as the current bear phase. This provides dry powder for strategic accumulation on price dips while reducing drawdown exposure.
- Correlation Analysis: Monitor U's price movements relative to broader blockchain adoption indices and layer-1 performance metrics. Employ diversification across other interoperability solutions or infrastructure tokens to reduce single-project concentration risk.
(3) Secure Storage Solution
- Hot Wallet Approach: Gate.com's Web3 Wallet is recommended for active traders and frequent users, enabling instant liquidity and participation in ecosystem opportunities while maintaining competitive security standards.
- Cold Storage Protocol: For holdings exceeding 6-12 month trading reserves, transfer tokens to a personal hardware-secured wallet. Implement multi-signature schemes where technically feasible for substantial holdings.
- Security Considerations:
- Never share private keys or seed phrases; use reputable security practices to prevent phishing attacks.
- Enable multi-factor authentication on Gate.com accounts managing U positions.
- Regularly audit wallet transactions and verify smart contract interactions before token approvals.
V. Union (U) Potential Risks and Challenges
U Market Risk
- Liquidity Risk: With a 24-hour trading volume of $48,623.82 and market cap of $5.50 million, Union exhibits limited liquidity. Large position entries or exits could experience significant slippage, particularly during low-volume periods.
- Price Volatility: U has experienced extreme volatility, declining 89.40% year-over-year and 37.059% over the past 30 days. Such dramatic price swings create substantial liquidation risks for leveraged positions and can trigger emotional decision-making among retail investors.
- Market Concentration Risk: With only 5,435 token holders and a relatively small active trading base, U remains susceptible to whale manipulation and coordinated selling pressure from large stakeholders.
U Regulatory Risk
- Token Classification Uncertainty: Regulatory clarity on whether Union functions as a utility token, security, or infrastructure protocol remains undefined across major jurisdictions. Changes in classification could impact listing eligibility on major platforms and overall market accessibility.
- Cross-Chain Compliance: As an interoperability protocol enabling asset movement across thousands of chains, Union faces evolving regulatory frameworks regarding bridged asset responsibility, anti-money laundering (AML) compliance, and counter-terrorist financing (CTF) obligations.
- Jurisdictional Enforcement: Different geographic regions may impose conflicting regulations on Union's operations or token usage, creating operational uncertainty and potential compliance costs that could impact token economics.
U Technical Risk
- Zero-Knowledge Proof Implementation Risk: While Union's core innovation lies in eliminating trusted third parties through ZK proofs, implementation vulnerabilities in cryptographic protocols could undermine security claims and require critical protocol upgrades with uncertain timelines.
- Scalability Execution Risk: Achieving promised sub-second cross-chain settlement across thousands of chains remains technically unproven at scale. Failure to deliver on these performance targets could diminish competitive advantages relative to alternative interoperability solutions.
- Smart Contract Vulnerabilities: Bugs or exploits in Union's smart contracts deployed across multiple chains could trigger significant token loss, reputation damage, and emergency protocol interventions that negatively impact token value.
VI. Conclusion and Action Recommendations
U Investment Value Assessment
Union represents a technically ambitious zero-knowledge interoperability solution addressing a critical infrastructure gap in blockchain ecosystems. The project's differentiation through trustless, oracle-free cross-chain mechanisms offers genuine innovation potential. However, the current market context presents significant challenges: U has experienced severe price decline (-89.40% year-over-year), maintains limited liquidity, exhibits nascent adoption with only 5,435 holders, and faces unproven technical execution at scale.
The token's circulating-to-total supply ratio of 19.19% suggests potential long-term dilution pressure, while current market capitalization of $5.50 million reflects investor skepticism regarding near-term commercialization. Investment in Union should be approached as exposure to emerging blockchain infrastructure technology rather than near-term appreciation, with clear understanding that protocol success timelines remain uncertain.
U Investment Recommendations
✅ Newcomers: Begin with a minimal exploratory position (0.5-2% of dedicated crypto allocation) established through Gate.com's trading platform. Use this to build familiarity with cross-chain mechanisms and Union's development progress before expanding exposure. Dollar-cost averaging over 3-6 months reduces timing risk during this volatile period.
✅ Experienced Investors: Establish core infrastructure holdings (3-8% allocation) if convinced of zero-knowledge interoperability's long-term necessity. Combine buy-and-hold core positions with 20-30% trading allocation for tactical swing trades around identified support-resistance zones. Monitor on-chain metrics and developer activity indicators closely.
✅ Institutional Investors: Consider Union as a 5-15% allocation within broader blockchain infrastructure sleeve, contingent on completed technical audits, partnership announcements, and demonstrated scaling progress. Implement structured dollar-cost averaging programs and maintain hedging positions against protocol execution risk.
U Trading Participation Methods
- Spot Trading on Gate.com: Execute direct buy/sell transactions of U tokens with full custody and immediate settlement. Gate.com's user-friendly interface provides competitive trading pairs and real-time market data for position management.
- Limit Order Strategy: Place pre-set buy orders at historical support levels ($0.00276 area) and sell orders at resistance zones ($0.01-$0.02 range) to automate disciplined trading without emotional intervention.
- Portfolio Rebalancing: Periodically review U allocation against changing risk parameters, protocol developments, and broader market conditions. Use Gate.com's trading tools to efficiently adjust positions while minimizing transaction costs.
Cryptocurrency investments carry extreme risk and volatility. This report does not constitute investment advice. Investors must carefully assess their individual risk tolerance, financial situation, and investment objectives before committing capital to Union or any digital asset. Professional financial consultation is strongly recommended. Never invest funds exceeding your personal loss tolerance threshold.
FAQ
Is U stock a good buy?
U stock shows strong fundamentals with positive analyst consensus. Market data indicates bullish sentiment, making it an attractive buying opportunity for investors seeking growth exposure in the technology sector.
What factors influence U price predictions?
U price predictions are influenced by market volatility, trading volume, economic indicators, and company fundamentals. Beta coefficients and value premiums also significantly impact price movements and market sentiment.
What is the historical price performance of U?
U has demonstrated solid performance with notable volatility. As of recent data, U traded between $34.79 and $37.28, closing at $36.72. The asset shows consistent trading activity with substantial volume, reflecting strong market interest and liquidity in the U ecosystem.
What are the risks associated with investing in U?
Investing in U involves market volatility, potential capital loss, and inflation risk. Price fluctuations can be significant due to market conditions. Regulatory changes and liquidity variations may also impact your investment. Consider your risk tolerance before investing.
Share
Content
Introduction: Union's Market Position and Investment Value
I. U Price History Review and Current Market Status
II. Core Factors Influencing U's Future Price
2025 Outlook
2026-2027 Mid-term Outlook
2028-2030 Long-term Outlook
IV. U Professional Investment Strategy and Risk Management
V. Union (U) Potential Risks and Challenges
VI. Conclusion and Action Recommendations
FAQ
How to Buy Cryptocurrency


Trending Cryptocurrencies


Viction's Whitepaper Logic: Driving 75.6% Growth with Zero-Gas Innovations in 2025

What is LA: The Ultimate Guide to Los Angeles' Culture and Attractions
2025 LA Price Prediction: Analyzing Future Market Trends and Investment Opportunities in Los Angeles Real Estate
Is Union (U) a Good Investment?: Analyzing Performance, Growth Potential and Market Position in Today's Economy

What Is Horizen (ZEN) and How Does Its Cross-Chain Technology Work?

ZK vs ETH: The Battle for Scalability in the Blockchain Arena

1000CAT Coin: Khám Phá Loại Tiền Điện Tử Mới và Cách Sở Hữu
What Factors Drive Crypto Price Volatility and How to Analyze Support and Resistance Levels?

What Are the Compliance and Regulatory Risks of AXL Token in 2025?

Easy Steps to Purchase Ripple (XRP) in Israel Using Your Credit Card Online
Top 10 Cryptocurrencies Primed for Significant Growth in 2025 | Insights from Industry Experts