2025 VSC Price Prediction: Expert Analysis and Market Forecast for Viscoin's Future Value


Introduction: VSC's Market Position and Investment Value
Vyvo Smart Chain (VSC) is a comprehensive blockchain infrastructure designed to bridge IoT device users and institutions, enabling users to reclaim ownership of their data. Since its launch in 2023, VSC has established itself as a pioneering solution in decentralized data health management. As of December 2025, VSC has achieved a market capitalization of approximately $29.16 million, with a circulating supply of around 4.46 billion tokens, currently trading at $0.001457 per token. This innovative asset is playing an increasingly critical role in revolutionizing health data management through blockchain technology, directly connecting users and researchers while enabling users to earn rewards from wearable device-generated data.
This article will provide a comprehensive analysis of VSC's price trends from 2025 to 2030, integrating historical patterns, market supply and demand dynamics, ecosystem development, and macroeconomic factors to deliver professional price forecasts and practical investment strategies for investors.
Vyvo Smart Chain (VSC) Market Analysis Report
I. VSC Price History Review and Current Market Status
VSC Current Market Performance
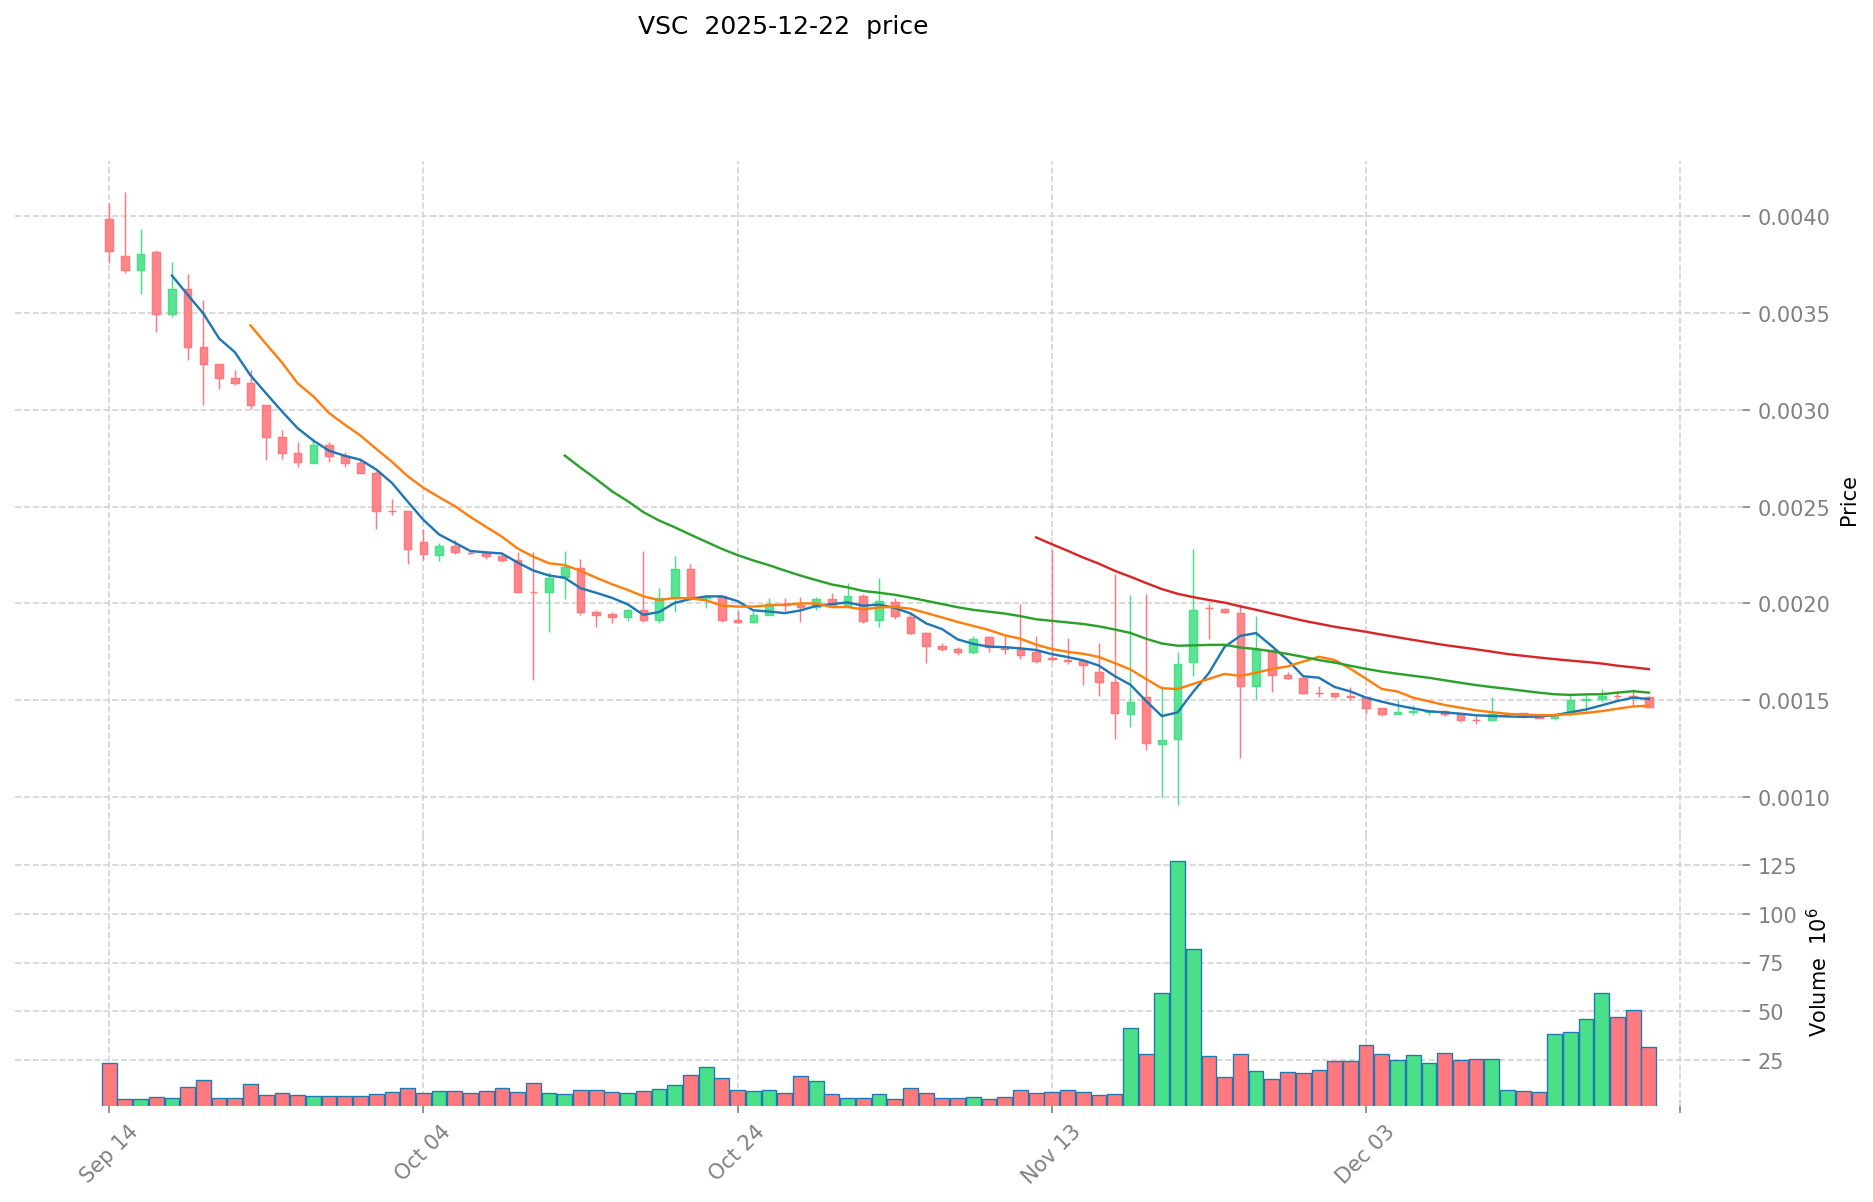
As of December 23, 2025, VSC is trading at $0.001457, reflecting significant volatility and long-term depreciation. The token has experienced substantial downward pressure, with a 1-year decline of -87.38%, indicating sustained bearish market conditions.
Key Price Metrics:
- Current Price: $0.001457
- 24-Hour Change: -1.08% ($0.001449 - $0.001471 range)
- 7-Day Change: +2.11%
- 30-Day Change: -26.22%
- 1-Year Change: -87.38%
Historical Price Extremes:
- All-Time High: $0.04196 (reached on March 9, 2024)
- All-Time Low: $0.000956 (reached on November 21, 2025)
- Current Distance from ATH: -96.53% decline
Market Capitalization and Liquidity
VSC maintains a market capitalization of approximately $6.5 million based on circulating supply, with a fully diluted valuation of $29.16 million. The 24-hour trading volume stands at $52,073.56, indicating limited liquidity in the market. The token ranks #1,393 by market capitalization.
Supply Metrics:
- Circulating Supply: 4,461,017,894 VSC (22.29% of total supply)
- Total Supply: 20,014,165,805 VSC
- Market Cap to FDV Ratio: 22.29%
Market Sentiment
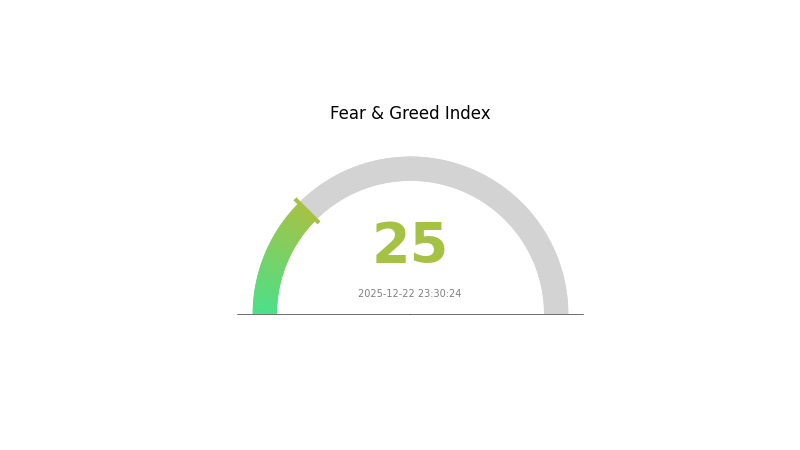
Current market sentiment reflects extreme fear, with a VIX reading of 25 as of December 22, 2025, suggesting heightened market volatility and investor anxiety across the broader cryptocurrency landscape.
Click to view current VSC market price
VSC Market Sentiment Index
2025-12-22 Fear and Greed Index: 25 (Extreme Fear)
Click to view the current Fear & Greed Index
The cryptocurrency market is experiencing extreme fear, with the Fear and Greed Index dropping to 25. This indicates that market participants are highly anxious about price movements and future trends. During periods of extreme fear, experienced investors often view market downturns as buying opportunities, while conservative investors may choose to reduce positions and wait for stabilization. It is recommended to monitor market dynamics closely on Gate.com and make investment decisions based on your risk tolerance and investment strategy.
VSC Holdings Distribution
The address holdings distribution represents a critical on-chain metric that illustrates how VSC tokens are dispersed across wallet addresses. This distribution pattern serves as a fundamental indicator of network decentralization, market concentration, and potential vulnerability to coordinated price movements. By analyzing the proportion of tokens held by top addresses relative to total circulating supply, we can assess the degree of wealth concentration and evaluate the resilience of the token's market structure.
Unfortunately, the provided dataset appears to be empty, containing no address holdings information. Without concrete data on the top holders and their respective token quantities, a comprehensive assessment of VSC's current concentration characteristics cannot be conducted. To properly evaluate whether the token exhibits excessive concentration, assess the potential for market manipulation, and determine the overall decentralization status of the network, complete holdings distribution data would be required.
For a thorough analysis of VSC's on-chain holder distribution and market structure health, investors and analysts are encouraged to access detailed holdings information through professional blockchain analysis tools and market data platforms.
Click to view current VSC holdings distribution

| Top | Address | Holding Qty | Holding (%) |
|---|
II. Core Factors Affecting VSC's Future Price
Market Sentiment and Investor Confidence
-
Investor Sentiment Impact: Investor emotions and confidence directly influence VSC/USD price movements. Market sentiment plays a crucial role in cryptocurrency price trends.
-
Cryptocurrency Investment Trends: Investment trends in the broader cryptocurrency market significantly impact VSC price dynamics, as the token's value is interconnected with overall digital finance investment patterns.
Regulatory Environment
-
Government Policy Influence: Government policies and regulations on cryptocurrencies directly affect market acceptance and adoption rates, thereby determining VSC's market value and accessibility.
-
Regulatory Compliance: Changes in regulatory frameworks across different jurisdictions can impact investor confidence and institutional participation in the VSC ecosystem.
Digital Finance Dynamics
-
Market Acceptance: The overall acceptance and adoption of digital finance solutions influence VSC's positioning and long-term price trajectory in the cryptocurrency market.
-
Competitive Landscape: VSC's price is affected by developments within the broader digital finance and cryptocurrency ecosystem, including competitive offerings and technological advancements.
Three、2025-2030 VSC Price Forecast
2025 Outlook
- Conservative Forecast: $0.00125-$0.00145
- Neutral Forecast: $0.00145-$0.00170
- Optimistic Forecast: $0.00197 (requires sustained market momentum and positive ecosystem developments)
2026-2027 Mid-term Outlook
- Market Stage Expectation: Consolidation phase with gradual recovery, characterized by increased adoption and ecosystem expansion
- Price Range Forecast:
- 2026: $0.00094-$0.00183
- 2027: $0.00156-$0.00232
- Key Catalysts: Protocol upgrades, institutional adoption acceleration, market sentiment recovery, and increasing trading volume on major platforms like Gate.com
2028-2030 Long-term Outlook
- Base Case: $0.00117-$0.00299 (assuming moderate ecosystem growth and stable market conditions)
- Optimistic Scenario: $0.00192-$0.00402 (assuming significant adoption acceleration and positive regulatory environment)
- Transformative Scenario: $0.00299-$0.00402 (under conditions of breakthrough technological achievements, mass market adoption, and favorable macroeconomic trends)
- 2030-12-31: VSC anticipated to reach $0.00402 (projected maximum price scenario reflecting cumulative 103% appreciation from baseline)
| 年份 | 预测最高价 | 预测平均价格 | 预测最低价 | 涨跌幅 |
|---|---|---|---|---|
| 2025 | 0.00197 | 0.00145 | 0.00125 | 0 |
| 2026 | 0.00183 | 0.00171 | 0.00094 | 17 |
| 2027 | 0.00232 | 0.00177 | 0.00156 | 21 |
| 2028 | 0.00299 | 0.00205 | 0.00117 | 40 |
| 2029 | 0.0034 | 0.00252 | 0.00149 | 72 |
| 2030 | 0.00402 | 0.00296 | 0.00192 | 103 |
Vyvo Smart Chain (VSC) Professional Investment Strategy and Risk Management Report
IV. VSC Professional Investment Strategy and Risk Management
VSC Investment Methodology
(1) Long-term Holding Strategy
-
Target Investors: Long-term believers in decentralized health data infrastructure and IoT blockchain adoption, with a 2-5 year investment horizon.
-
Operational Recommendations:
- Establish a core position during market downturns, utilizing dollar-cost averaging (DCA) to reduce timing risk and build positions gradually over 6-12 months.
- Monitor VSC ecosystem development, including partnerships with healthcare institutions and wearable device manufacturers, to validate the project's real-world adoption potential.
- Set realistic expectations given the 87.38% one-year decline, understanding that recovery requires significant ecosystem maturation and user adoption milestones.
-
Storage Solution:
- Utilize Gate.com Web3 Wallet for secure self-custody of VSC tokens, enabling direct participation in the VSC ecosystem while maintaining full control of private keys.
- Implement multi-signature wallet configurations for holdings exceeding $10,000 to enhance security against unauthorized access.
(2) Active Trading Strategy
-
Technical Analysis Tools:
- Support/Resistance Levels: Track the 24H range ($0.001449 - $0.001471) and all-time low reference point ($0.000956) as critical technical indicators for entry and exit decision-making.
- Volume Analysis: Monitor the 24H trading volume ($52,073.56) relative to historical averages to identify potential breakout opportunities and confirm trend reversals.
-
Swing Trading Key Points:
- Enter positions during 7-day uptrends (current +2.11% movement) with stop-losses set 5-8% below entry prices to protect against false breakouts.
- Exit partial positions during 20-30% gains above purchase price to lock in profits and reduce downside exposure in this highly volatile asset.
VSC Risk Management Framework
(1) Asset Allocation Principles
- Conservative Investors: 1-2% portfolio allocation maximum, treating VSC as a speculative satellite position within a diversified cryptocurrency portfolio.
- Active Investors: 3-5% portfolio allocation, suitable for investors with moderate risk tolerance and the ability to actively monitor market conditions.
- Professional Investors: 5-10% allocation, only for experienced investors with sophisticated hedging strategies and deep understanding of the VSC ecosystem.
(2) Risk Hedging Solutions
- Portfolio Diversification: Balance VSC holdings with established blockchain projects and stablecoins to reduce single-asset concentration risk and volatility exposure.
- Position Sizing with Stop-Losses: Implement disciplined stop-loss orders at 15-20% below entry prices and take-profit levels at 25-50% gains to systematically manage downside and protect capital.
(3) Secure Storage Solutions
- Hot Wallet Solution: Gate.com Web3 Wallet for active trading and frequent transactions, providing convenient access while maintaining reasonable security standards for smaller holdings.
- Cold Storage Approach: Transfer majority holdings to offline storage or hardware-secured solutions for long-term preservation, reducing exposure to exchange hacks or platform vulnerabilities.
- Security Precautions: Enable two-factor authentication on all trading accounts, use unique passwords for each platform, avoid sharing recovery phrases, and conduct regular security audits of all wallet addresses holding VSC tokens.
V. VSC Potential Risks and Challenges
VSC Market Risks
- Extreme Price Volatility: VSC has experienced an 87.38% one-year decline and trades near all-time lows ($0.000956 on 2025-11-21 vs. ATH of $0.04196 on 2024-03-09), indicating severe market uncertainty and potential further depreciation.
- Low Liquidity and Trading Volume: Daily trading volume of only $52,073.56 with a $6.5 million market cap suggests limited market depth, making large trades difficult to execute without significant slippage and price impact.
- Market Sentiment Deterioration: The negative one-year performance and diminished market interest (ranked #1393 by market cap) indicate reduced investor confidence and potential difficulty in attracting new capital during downturns.
VSC Regulatory Risks
- Healthcare Data Compliance Uncertainty: Operating at the intersection of blockchain, healthcare data, and wearable devices exposes VSC to evolving HIPAA, GDPR, and regional healthcare regulations that could impose operational constraints or costly compliance requirements.
- Cryptocurrency Regulatory Tightening: Increased global scrutiny of cryptocurrency projects, particularly those involving personal health data, could result in delisting from exchanges, restricted trading, or legal challenges to VSC's business model.
- Cross-Border Privacy Jurisdiction Conflicts: Managing decentralized health data across multiple countries with varying privacy laws creates regulatory complexity and potential enforcement challenges that could impede ecosystem expansion.
VSC Technical Risks
- Blockchain Network Stability: As a mainnet-based system, VSC faces risks of network congestion, transaction processing delays, or technical failures that could compromise user experience and adoption rates.
- Smart Contract Vulnerabilities: Health data monetization platforms require robust smart contract security; any discovered vulnerabilities could lead to fund loss, user data exposure, or complete platform compromise.
- Limited Technological Differentiation: The VSC network must continuously innovate to maintain competitive advantages against larger blockchain platforms and established healthcare technology providers offering similar functionalities.
VI. Conclusion and Action Recommendations
VSC Investment Value Assessment
Vyvo Smart Chain operates in a compelling but highly speculative niche combining IoT wearable data, healthcare research, and blockchain technology. While the project's core value proposition—enabling users to monetize health data while maintaining privacy—addresses genuine market needs, the severe 87.38% one-year decline and minimal trading liquidity indicate significant execution challenges and limited near-term catalysts. VSC's success depends critically on achieving measurable ecosystem adoption, establishing partnerships with healthcare institutions and device manufacturers, and navigating complex regulatory environments. Current market conditions suggest extreme caution, with VSC representing a high-risk, long-term speculative bet rather than a near-term investment opportunity.
VSC Investment Recommendations
✅ Beginners: Limit exposure to 1% of portfolio maximum as educational speculation; focus on understanding the health data monetization thesis before committing capital. Consider paper trading VSC first to evaluate your conviction level.
✅ Experienced Investors: Allocate 2-5% with strict stop-losses and position sizing discipline; actively monitor ecosystem development announcements, partnership milestones, and adoption metrics to assess whether the project is executing on its vision.
✅ Institutional Investors: Conduct thorough due diligence on regulatory compliance frameworks, healthcare data partnerships, and technical architecture before considering any allocation; establish clear milestone-based investment triggers aligned with ecosystem validation.
VSC Trading Participation Methods
- Gate.com Spot Trading: Purchase VSC tokens directly through Gate.com's spot trading interface for long-term holdings or active trading strategies, utilizing limit orders to execute at predetermined prices and minimize slippage costs.
- Gate.com Wallet Integration: Transfer purchased VSC to Gate.com Web3 Wallet for secure self-custody while maintaining flexibility for future trading or ecosystem participation as the network matures.
- Dollar-Cost Averaging (DCA): Implement systematic monthly purchases of small VSC amounts through Gate.com regardless of price fluctuations, reducing the impact of extreme volatility and average down during market weakness.
Cryptocurrency investment carries extreme risk. This report does not constitute financial advice. Investors must make decisions based on their risk tolerance and financial situation. Consult professional financial advisors before investing. Never invest capital you cannot afford to lose completely.
FAQ
Will vet reach $1?
Based on current projections, VET is unlikely to reach $1 soon. Analysts predict a maximum of $0.28 by 2030, requiring over 40x growth from current levels.
Does Velo crypto have a future?
Yes, Velo has strong potential. With growing adoption in decentralized finance, strategic partnerships, and increasing trading volume, VELO is positioned for expansion. Market analysts project solid growth trajectory through 2025 and beyond, making it a promising long-term asset.
Will VeChain hit $2?
Yes, VeChain (VET) reached $2 on December 22, 2025. Crypto analyst Raidenx predicted this milestone, citing VET's unique project attributes and strong fundamentals as key drivers for this significant price rally.
Can VeChain reach $3?
Yes, VeChain could potentially reach $3 in the long term. Current predictions suggest a range from $3 to $0.36, reflecting VeChain's potential to disrupt supply chain technology and enterprise adoption.
Share
Content
Introduction: VSC's Market Position and Investment Value
I. VSC Price History Review and Current Market Status
II. Core Factors Affecting VSC's Future Price
Three、2025-2030 VSC Price Forecast
IV. VSC Professional Investment Strategy and Risk Management
V. VSC Potential Risks and Challenges
VI. Conclusion and Action Recommendations
FAQ
How to Buy Cryptocurrency


Trending Cryptocurrencies


2025 CFX Price Prediction: Analyzing Growth Potential and Market Factors for Conflux Network Token

2025 GRT Price Prediction: Analyzing Graph Protocol's Future Value Trajectory and Market Potential

2025 XLM Price Prediction: Stellar's Potential Surge in the Evolving Crypto Landscape

2025 OCTA Price Prediction: Analyzing Market Trends and Growth Potential in the Digital Asset Space

2025 SLC Price Prediction: Analyzing Market Trends and Potential Growth Factors

Is DIMO (DIMO) a good investment?: Analyzing the potential and risks of this decentralized mobility token
How Has LIGHT Crypto Price Volatility Changed From $0.244507 Peak to Current Levels in 2025?
PIXEL vs HBAR: A Comprehensive Comparison of Two Emerging Blockchain Tokens and Their Market Performance

What Is LUNC (Terra Luna Classic) Market Overview: Price, Trading Volume, and Market Cap in 2025?
How Does Kaspa (KAS) Price Volatility Impact Your Trading Strategy at $0.048?

How Does Crypto Competitive Benchmarking Analysis Drive Market Share Growth in 2025?