# Article Introduction
This comprehensive analysis examines WatBird (WAT) token's market dynamics and price forecasts through 2031, providing investors with data-driven insights into this TON blockchain-based meme token. The article delivers professional WAT price predictions, investment strategies, and risk management frameworks tailored for beginners, experienced traders, and institutional investors. By analyzing WAT's 94.26% annual decline, micro-cap status, and community-driven ecosystem potential, the guide addresses critical investment decisions for those seeking exposure to Telegram-based Web3 applications. Structured across market fundamentals, price forecasts, investment methodologies, and risk assessments, this resource equips readers with actionable strategies for trading WAT on Gate and other platforms. Ideal for cryptocurrency investors evaluating early-stage tokens, the article emphasizes disciplined portfolio allocation and security protocols essential for navigating WAT's extreme volatility a
Introduction: WAT's Market Position and Investment Value
WatBird (WAT) is a community-first token built on the TON blockchain and backed by TON Ventures, representing a meme-powered IP initiative designed to build the next major Web3 brand. Since its launch in September 2024, WAT has established itself within the Telegram ecosystem, leveraging casual gaming and meme culture to attract millions of daily active users. As of January 5, 2026, WAT has achieved a market capitalization of $688,396.97, with a circulating supply of approximately 6.59 billion tokens trading at $0.000009877 per unit. This innovative asset, recognized as a "community-driven meme token," is playing an increasingly significant role in expanding the broader WatBird Universe ecosystem toward onboarding the next 100 million users.
This article provides a comprehensive analysis of WAT's price trends and market dynamics for 2026, integrating historical performance patterns, market supply-demand dynamics, ecosystem development, and macro-economic factors to deliver professional price forecasts and actionable investment strategies for investors seeking exposure to this emerging digital asset.
I. WAT Price History Review and Current Market Status
WAT Historical Price Trajectory
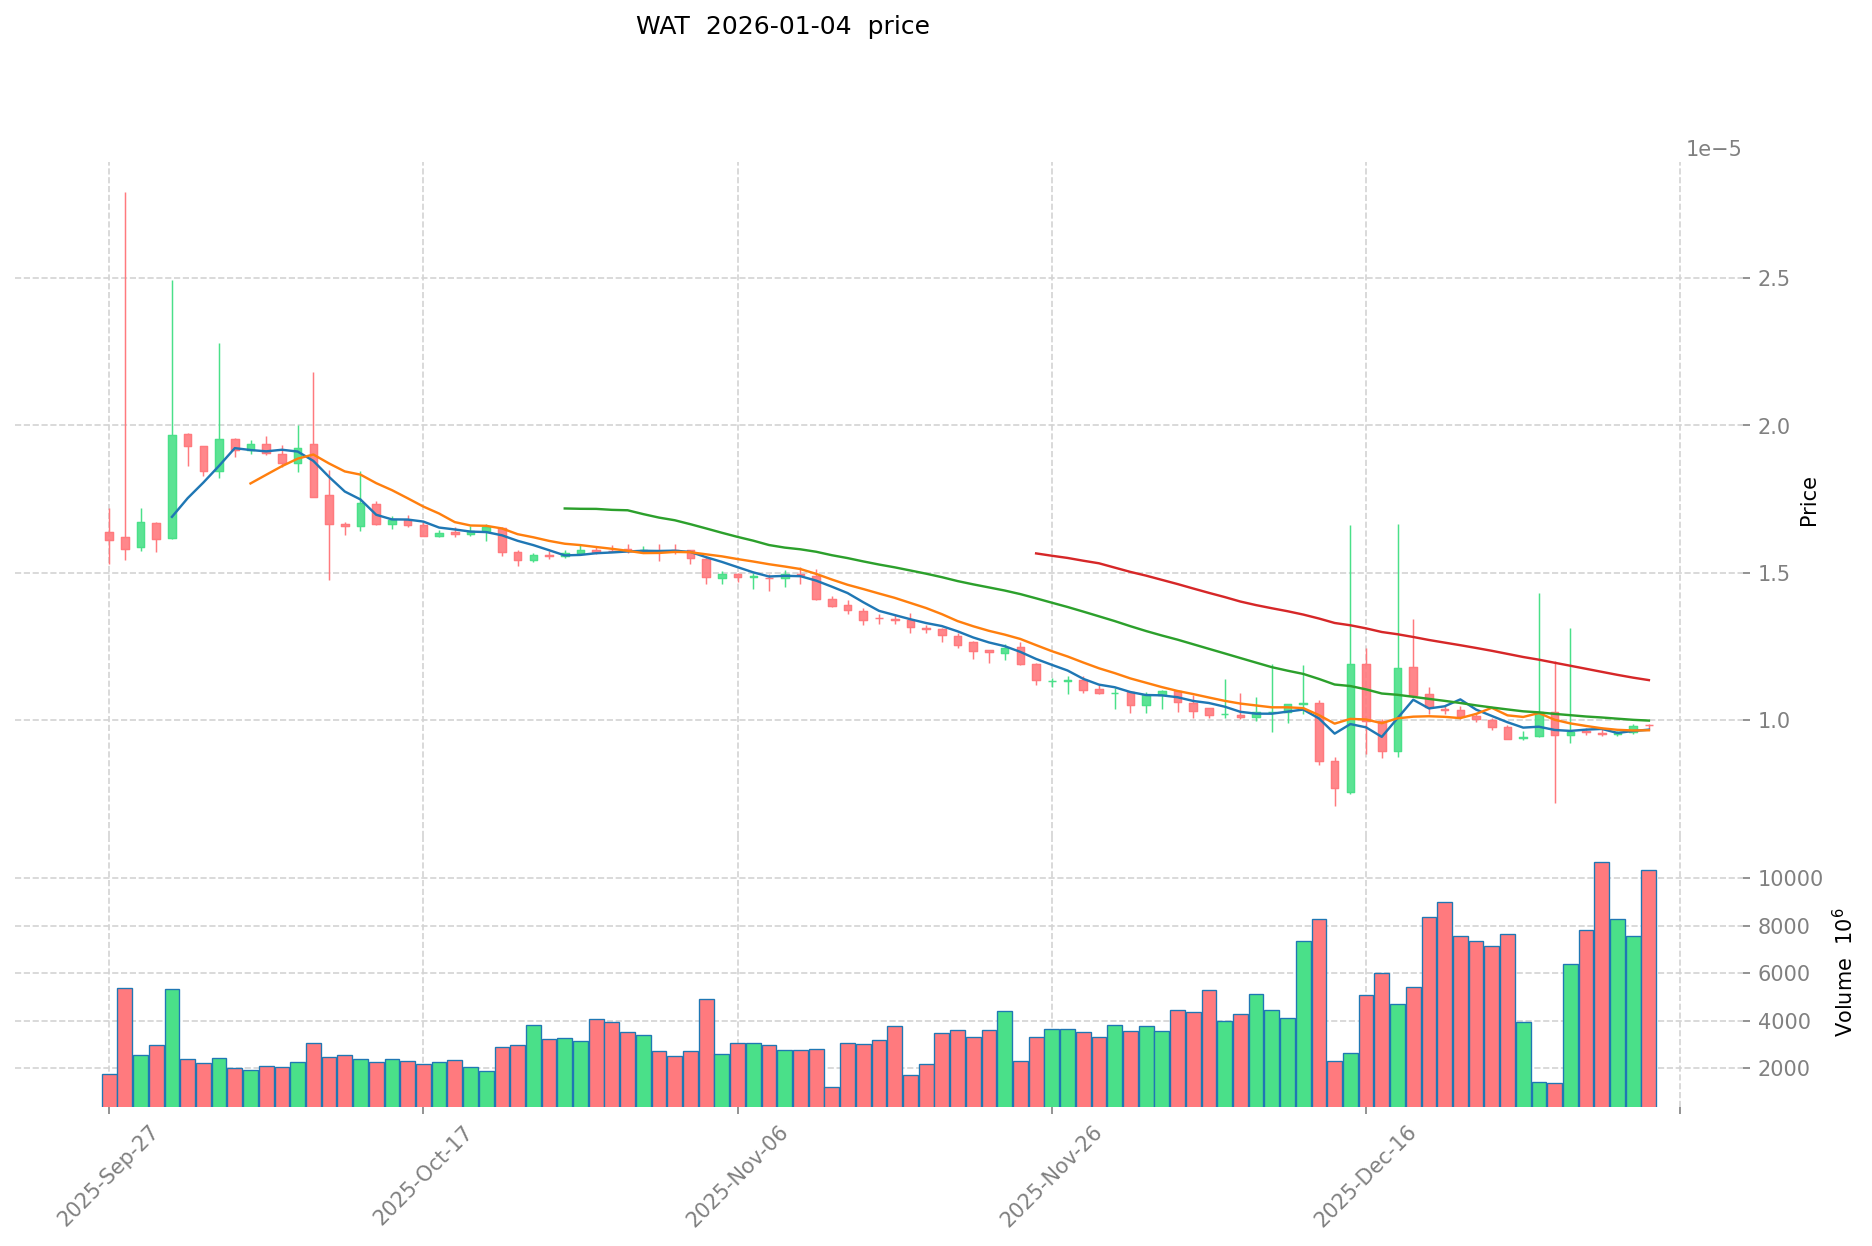
WatBird (WAT) reached its all-time high (ATH) of $0.00217 on September 23, 2024, marking the peak of investor enthusiasm since its launch. The token subsequently experienced significant volatility, declining substantially over the following months. By December 14, 2025, WAT touched its all-time low (ATL) of $0.000007084, representing a dramatic correction of approximately 99.67% from its peak value. Over the one-year period, the token has declined by 94.26%, reflecting considerable downward pressure on valuation.
WAT Current Market Dynamics
As of January 5, 2026, WAT is trading at $0.000009877, with a 24-hour trading volume of $133,542.69. The token demonstrates modest short-term momentum, gaining 0.74% over the past 24 hours, though it shows weakness in intermediate timeframes with a 7-day decline of 4.42% and a 30-day decline of 4.02%.
The fully diluted market capitalization stands at $688,396.97, with a circulating market cap of $65,053.51. WAT has a circulating supply of 6,586,363,636 tokens out of a total and maximum supply of 69,696,969,696 tokens, representing approximately 9.45% circulation ratio. The token maintains a market dominance of 0.000020%, indicating minimal influence on the broader cryptocurrency market. With 221,888 token holders distributed across 2 exchanges, WAT maintains an active but limited trading ecosystem.
Click to view current WAT market price
WAT Market Sentiment Index
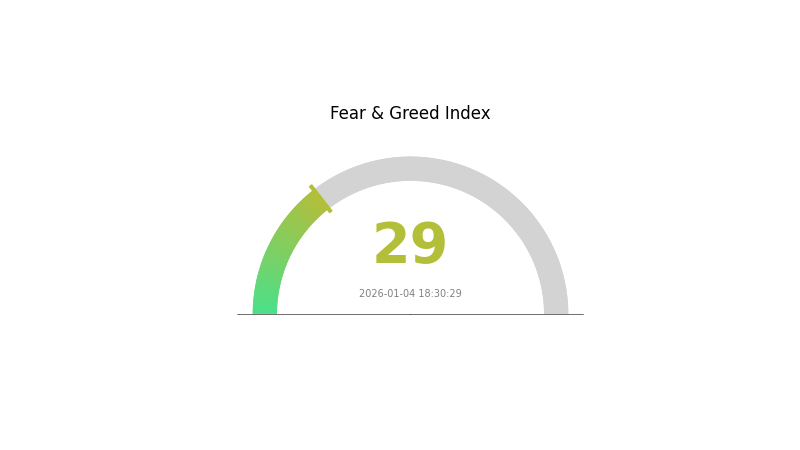
2026-01-04 Fear and Greed Index: 29 (Fear)
Click to view current Fear & Greed Index
The cryptocurrency market is currently experiencing a fear sentiment with an index reading of 29. This indicates that market participants are predominantly risk-averse, with investor confidence subdued. During such periods, volatility typically increases as traders adopt defensive positions. For long-term investors, extreme fear can present accumulation opportunities, as prices often reflect pessimistic market conditions. Those monitoring Gate.com's market data tools can better understand current sentiment dynamics and adjust their strategies accordingly.
WAT Holdings Distribution
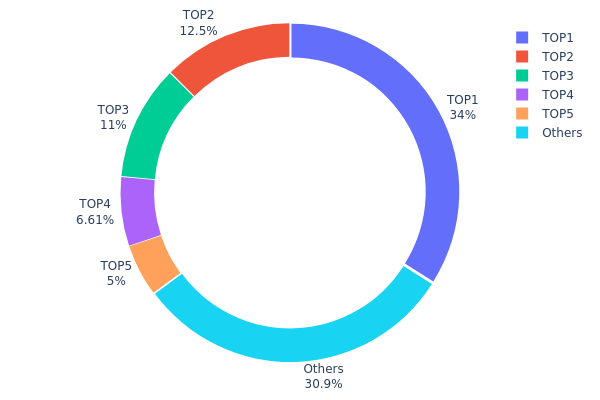
The address holdings distribution map illustrates the concentration of WAT tokens across different wallet addresses on the blockchain, representing the degree of decentralization and wealth concentration within the network. This metric is crucial for assessing market structure risks, including potential price manipulation threats and network governance dynamics.
WAT's current holdings distribution exhibits moderate to elevated concentration characteristics. The top five addresses collectively control approximately 69.08% of the total token supply, with the leading address alone accounting for 33.98% of all circulating WAT tokens. This concentration level raises concerns regarding potential market manipulation risks and reduced decentralization. The second-tier holders (addresses 2-5) maintain substantial positions ranging from 5.00% to 12.50%, indicating that control remains distributed among a limited number of entities rather than a diverse holder base.
The remaining holders, classified as "Others," comprise 30.92% of the total supply spread across numerous addresses, suggesting a long-tail distribution pattern. This bifurcated structure reveals that while minority holders exist, the majority of WAT's liquidity and governance power remains concentrated in the hands of a few major stakeholders. Such concentration patterns typically correlate with higher price volatility and increased susceptibility to coordinated selling pressure or market-moving decisions from major holders. The current distribution structure underscores the importance of monitoring whale activity and institutional accumulation patterns to assess future market stability and price discovery mechanisms.
Click to view current WAT holdings distribution
| Top |
Address |
Holding Qty |
Holding (%) |
| 1 |
UQAZJ6...iljLMs |
23683480.43K |
33.98% |
| 2 |
UQAbhM...0d1t87 |
8714196.27K |
12.50% |
| 3 |
UQARIM...7_obFt |
7666666.67K |
11.00% |
| 4 |
UQA1OM...lNR2dx |
4603872.34K |
6.60% |
| 5 |
UQCMqD...WZkNcK |
3484848.48K |
5.00% |
| - |
Others |
21543905.51K |
30.92% |
II. Core Factors Affecting WAT's Future Price
Macroeconomic Environment
- Market Sentiment Impact: WAT's price movements are influenced by broader cryptocurrency market sentiment, which can shift rapidly based on investor confidence and risk appetite.
- Cryptocurrency Market Regulatory Developments: Regulatory changes and policy developments affecting the cryptocurrency market play a significant role in price determination.
- International Price Dynamics: As a cryptocurrency asset, WAT is affected by global economic conditions and international market trends, particularly through supply and demand factors influenced by international prices and domestic economic conditions.
Recent Price Movement Context
The notable price decline of 32.34% observed in July 2025 reflects potential shifts in market sentiment, which may have been triggered by broader macroeconomic trends or regulatory developments impacting the cryptocurrency sector.
III. WAT Price Forecast for 2026-2031
2026 Outlook
- Conservative Forecast: $0.00001
- Base Case Forecast: $0.00001
- Optimistic Forecast: $0.00001
2027-2029 Mid-term Outlook
- Market Stage Expectation: Early accumulation phase with gradual price discovery and increasing market participation
- Price Range Forecast:
- 2027: $0.00001 - $0.00002 (estimated +12% upside)
- 2028: $0.00001 - $0.00002 (estimated +36% cumulative growth)
- 2029: $0.00001 - $0.00002 (estimated +66% cumulative growth)
- Key Catalysts: Ecosystem development, increased adoption metrics, potential partnerships, and enhanced utility applications
2030-2031 Long-term Outlook
- Base Case: $0.00001 - $0.00002 (assumes steady but moderate ecosystem development and mainstream adoption barriers remain)
- Optimistic Case: $0.00002 - $0.00003 (assumes successful protocol upgrades and expanded use cases)
- Bullish Case: $0.00003 (assumes transformative developments including major institutional adoption, breakthrough technological innovation, or significant macroeconomic tailwinds)
- 2031-12-31: WAT potentially reaches $0.00003 (representing approximately 111% cumulative appreciation from 2026 levels, contingent on favorable market conditions)
| 年份 |
预测最高价 |
预测平均价格 |
预测最低价 |
涨跌幅 |
| 2026 |
0.00001 |
0.00001 |
0.00001 |
0 |
| 2027 |
0.00002 |
0.00001 |
0.00001 |
12 |
| 2028 |
0.00002 |
0.00001 |
0.00001 |
36 |
| 2029 |
0.00002 |
0.00002 |
0.00001 |
66 |
| 2030 |
0.00002 |
0.00002 |
0.00001 |
81 |
| 2031 |
0.00003 |
0.00002 |
0.00001 |
111 |
WAT Investment Strategy and Risk Management Report
IV. WAT Professional Investment Strategy and Risk Management
WAT Investment Methodology
(1) Long-term Holding Strategy
- Target Investors: Community-focused participants who believe in the WatBird Universe expansion and Telegram-based gaming ecosystem growth
- Operation Recommendations:
- Accumulate WAT during market downturns, particularly given the -94.26% annual decline, to build positions at lower valuations
- Monitor community growth metrics and casual gaming adoption as leading indicators of token utility expansion
- Participate in platform developments related to the WatBird Universe roadmap expansion toward 100M users
(2) Active Trading Strategy
- Technical Analysis Tools:
- Volatility Indicators: Monitor 24-hour and 7-day price fluctuations (currently -4.42% over 7 days) to identify swing trading opportunities
- Volume Analysis: Track the 24-hour trading volume of $133,542.69 relative to market cap to assess liquidity conditions
- Swing Trading Key Points:
- Position sizing should account for the token's micro-cap status (market cap: $65,053.51) and limited exchange presence (2 exchanges)
- Use limit orders on Gate.com to establish positions during identified support levels given low daily volume
WAT Risk Management Framework
(1) Asset Allocation Principles
- Conservative Investors: 0.5-1% of portfolio maximum allocation
- Active Investors: 1-3% of portfolio allocation
- Professional Investors: 3-5% of portfolio allocation with hedging strategies
(2) Risk Hedging Solutions
- Position Sizing Discipline: Allocate only capital you can afford to lose completely, given WAT's micro-cap volatility and 94.26% annual decline
- Diversification Strategy: Balance WAT holdings with established TON ecosystem tokens to mitigate concentration risk
(3) Secure Storage Solutions
- Hot Wallet Solutions: Gate.com integrated Web3 wallet for active trading and regular transactions
- Cold Storage Approach: Transfer long-term holdings to self-custody solutions with multi-signature security protocols
- Security Precautions: Enable two-factor authentication on all exchange accounts, use unique passwords, never share private keys, verify contract addresses before transactions (confirmed TON address: EQCEqz2x3-Ub_EO4Y5798NNoqKw1tP_tJ6b9y-X0C4uvs8Zf)
V. WAT Potential Risks and Challenges
WAT Market Risks
- Extreme Volatility: The token experienced a -94.26% decline over one year and -4.42% over seven days, indicating significant price instability unsuitable for risk-averse investors
- Liquidity Constraints: Listed on only 2 exchanges with daily volume of $133,542.69 relative to $688,396.97 market cap, creating challenges for large position entries or exits
- Micro-cap Status: Total market cap of $65,053.51 makes WAT highly susceptible to manipulation and rapid depreciations
WAT Regulatory Risks
- Meme Token Classification: As a meme-powered IP, WAT may face regulatory scrutiny regarding token classification and utility determination across different jurisdictions
- TON Platform Dependency: Regulatory changes affecting the TON blockchain could directly impact WAT's operational environment
- Telegram Integration Risks: Heavy reliance on Telegram's platform for community and casual gaming expansion creates regulatory exposure if platform policies change
WAT Technology Risks
- Smart Contract Vulnerabilities: Limited information available regarding audit status and security reviews of the contract on TON blockchain
- Platform Dependency: Complete reliance on TON's infrastructure means any network disruptions or technical issues would directly affect WAT functionality
- Game Integration Risks: The casual gaming ecosystem component lacks detailed technical specifications regarding security, scalability, and user protection mechanisms
VI. Conclusion and Action Recommendations
WAT Investment Value Assessment
WAT presents a speculative opportunity targeting community-first investors interested in Telegram-based Web3 applications and meme-powered projects. The token benefits from TON Ventures backing and existing multi-million daily active user community, positioning it within the emerging casual gaming and social Web3 segment. However, the 94.26% annual price decline, micro-cap status, and limited exchange liquidity indicate WAT remains in early-stage development with substantial execution risk. The long-term value proposition depends critically on successful WatBird Universe expansion and the team's ability to convert Telegram's user base into sustained ecosystem adoption.
WAT Investment Recommendations
✅ Beginners: Treat WAT as an extremely high-risk experimental allocation (0.1-0.5% of portfolio) only if you have conviction in Telegram-based gaming and can accept complete capital loss. Start with minimal positions on Gate.com to understand market dynamics before considering increases.
✅ Experienced Investors: Consider WAT as part of a diversified TON ecosystem exposure strategy (1-3% allocation). Implement disciplined entry points during identified support levels and maintain strict stop-loss protocols given volatility patterns.
✅ Institutional Investors: Conduct comprehensive due diligence on WatBird's development roadmap, team credentials, and gaming partnership announcements before any allocation consideration. Require verified audit reports and technical documentation before institutional participation.
WAT Trading Participation Methods
- Direct Exchange Trading: Access WAT on Gate.com and other listed platforms using verified wallets
- Community Participation: Engage with the multi-million daily active user community through Telegram channels to monitor project developments
- Long-term Positioning: Establish positions aligned with WatBird Universe milestone achievements and casual gaming adoption metrics
Cryptocurrency investment carries extreme risk. This report does not constitute investment advice. Investors must make decisions based on their individual risk tolerance and should consult professional financial advisors. Never invest capital you cannot afford to lose entirely. WAT's micro-cap status and 94.26% annual decline represent severe volatility unsuitable for most investors.
FAQ
What is WAT coin? What are its uses and value?
WAT coin is a decentralized cryptocurrency designed for global payments and transactions. It offers users a peer-to-peer payment solution with blockchain technology. WAT's value derives from its utility in the Web3 ecosystem, network adoption, and transaction demand. The token aims to provide efficient cross-border transfers and decentralized financial services.
How to view WAT's real-time price and historical price trends?
You can view WAT's real-time price and historical price trends on crypto data platforms. Check opening price, highest price, closing price, and trading volume. Download historical data in CSV format for detailed analysis and tracking your investment performance over time.
What will be the WAT price prediction for 2024?
Based on market analysis, WAT was projected to rise 20-30% by end of 2024, potentially reaching 0.00115-0.00125 USD post-listing. By 2025, analysts predicted prices could reach 0.002-0.003 USD, driven by growing user adoption and strong investor backing from leading institutions.
What are the main factors affecting WAT price?
WAT price is primarily influenced by market demand, trading volume, network adoption, tokenomics, and market sentiment. Increased demand and higher trading activity typically drive price appreciation, while broader crypto market trends also play a significant role in price movements.
What are the advantages of WAT compared to other similar tokens?
WAT offers real utility demand from continuous workflow execution and tool calls. Its settlement mechanism ensures sustained market buy pressure. The distribution model guarantees ongoing liquidity and ecosystem growth.
What are the main risks to pay attention to when investing in WAT?
WAT investment risks include high volatility with annual decline of 94.24%, market liquidity fluctuations, regulatory uncertainty in crypto sector, and technology development risks. Use hardware wallets for security and only invest amount you can afford to lose.
WAT在哪些交易所可以买卖?
WAT can be traded on multiple digital currency exchanges. You can purchase and sell WAT on platforms like CoinW and BitMart. Available exchanges may vary over time, so please check official sources for the most current listing information.
What are professional analysts' views on WAT's future prospects?
Analysts maintain a positive outlook on WAT, citing strong fundamentals and solid growth potential. The token demonstrates healthy market metrics and institutional interest. Most analyst ratings recommend accumulation, reflecting confidence in WAT's long-term development trajectory and market adoption prospects.
* The information is not intended to be and does not constitute financial advice or any other recommendation of any sort offered or endorsed by Gate.