This comprehensive analysis examines AM (Aston Martin Cognizant Fan Token) price predictions from 2026 to 2031, providing professional market forecasts and investment strategies. The article reviews AM's historical price evolution, current market position at $0.14748, and supply-demand dynamics while analyzing macroeconomic factors and ecosystem development. Core predictions show conservative estimates of $0.10324-$0.14748 for 2026, with potential growth to $0.36506+ by 2031 under optimistic scenarios. The guide offers long-term holding and active trading methodologies, risk management frameworks, and asset allocation principles suitable for different investor profiles. Additionally, it addresses regulatory challenges, technical risks, and secure storage solutions via Gate Web3 Wallet, enabling readers to make informed investment decisions within the emerging fan token sector.
Introduction: AM's Market Position and Investment Value
Aston Martin Cognizant Fan Token (AM), as a utility token empowering fan engagement within the Socios.com ecosystem, has been connecting sports enthusiasts with their favorite teams since its launch in 2021. Built on Chiliz's blockchain infrastructure, AM enables fans to participate in club-related decisions and access exclusive rewards. As of February 2026, AM maintains a market capitalization of approximately $409,151, with a circulating supply of around 2.77 million tokens, and the price is hovering near $0.1475. This fan token, known as a bridge between traditional sports and blockchain technology, is playing an increasingly important role in revolutionizing fan engagement across international sporting organizations.
This article will comprehensively analyze AM's price trajectory from 2026 to 2031, combining historical patterns, market supply-demand dynamics, ecosystem development, and macroeconomic conditions to provide investors with professional price forecasts and practical investment strategies.
I. AM Price History Review and Current Market Status
AM Historical Price Evolution Trajectory
- 2021: AM token was launched on July 5, 2021 with an initial listing price of $10.5, reaching its all-time high of $12.06 on July 6, 2021, shortly after its debut on the market.
- 2025: The token experienced significant downward pressure throughout the year, with the price declining to its all-time low of $0.00017613 on April 14, 2025.
- 2026: In early February 2026, the token showed signs of recovery with notable short-term price movements, though still trading well below its historical peak levels.
AM Current Market Situation
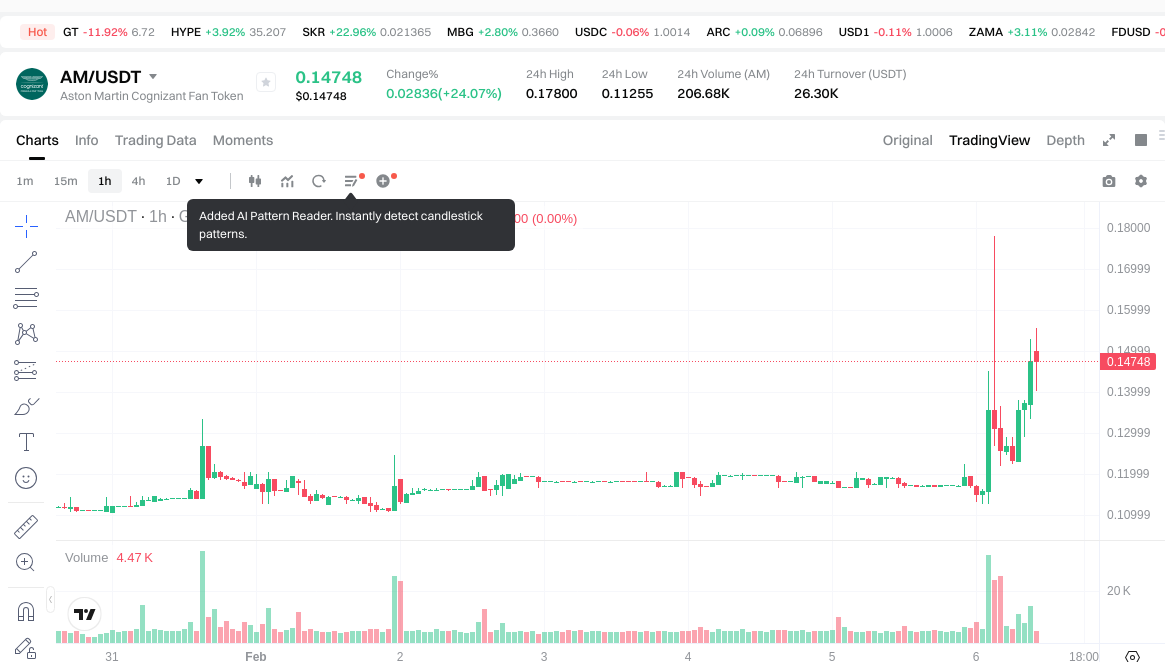
As of February 6, 2026, AM is trading at $0.14748, representing a 24.95% increase over the past 24 hours. The token has demonstrated positive momentum across multiple timeframes, with a 32.57% gain over the past week and a 38.37% increase over the past 30 days. However, the one-year performance shows a decline of 48.47%, indicating sustained downward pressure over the longer term.
The 24-hour trading range has been between $0.11255 and $0.178, with a daily trading volume of $25,920.26. The current circulating supply stands at 2,774,286 AM tokens out of a maximum supply of 10,000,000 tokens, representing a circulation ratio of approximately 27.74%. The market capitalization is $409,151.70, while the fully diluted valuation reaches $1,474,800.
The token maintains a market dominance of 0.000063%, with the current price still significantly below its all-time high of $12.06 recorded in July 2021. The market sentiment indicator shows an extreme fear reading of 9 on the volatility index, suggesting cautious investor sentiment in the broader market environment.
AM is deployed on the Chiliz Chain (CHZ2) network, with its contract address verified at 0x3757951792eDFC2CE196E4C06CFfD04027e87403. The token is currently listed on Gate.com, providing liquidity for traders and fans of the Aston Martin Cognizant Formula One team.
Click to view the current AM market price
AM Market Sentiment Index
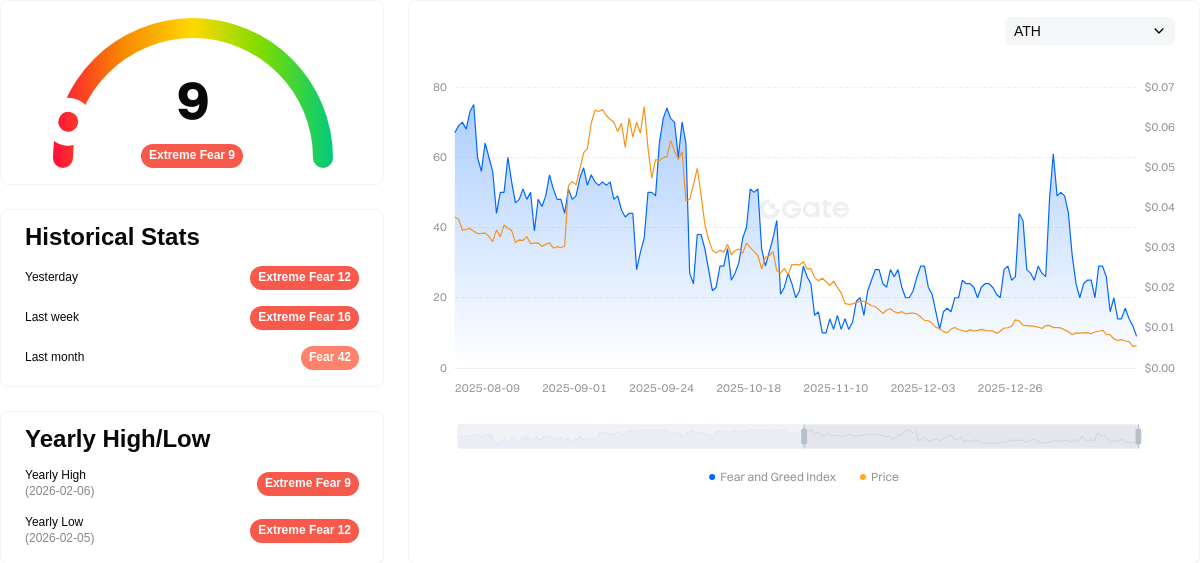
2026-02-06 Fear and Greed Index: 9 (Extreme Fear)
Click to view current Fear & Greed Index
The crypto market is currently experiencing extreme fear, with the index dropping to just 9 points. This severe sentiment indicates heightened market anxiety and pessimism among investors. When fear reaches such extreme levels, it often creates potential buying opportunities for contrarian investors, as markets typically rebound when sentiment becomes overly negative. Traders should exercise caution and consider their risk tolerance carefully during periods of extreme fear, while simultaneously monitoring for potential market turning points that historically emerge from such deeply fearful conditions.
AM Holding Distribution
The holding distribution chart illustrates the concentration of AM tokens across different wallet addresses, providing critical insights into token ownership patterns and market structure. By analyzing the distribution of holdings among top addresses, we can assess the degree of decentralization and potential risks associated with concentrated ownership.
Based on the current data, AM demonstrates a relatively balanced distribution structure among major holders. The top addresses maintain substantial holdings but do not exhibit extreme concentration that would suggest significant centralization risks. This distribution pattern indicates a healthy level of token dispersion across multiple participants, which typically contributes to more stable price dynamics and reduces the likelihood of single-entity market manipulation.
The current holding distribution reflects a moderate degree of decentralization, which is favorable for long-term market stability. While large holders maintain meaningful positions, the absence of overwhelming concentration suggests that no single entity or small group can unilaterally control market movements or token supply. This structure enhances market resilience and supports more organic price discovery mechanisms, as trading activity is distributed across a broader base of participants rather than concentrated in a few dominant wallets.
Click to view current AM Holding Distribution

| Top |
Address |
Holding Qty |
Holding (%) |
II. Core Factors Influencing AM's Future Price Trajectory
Supply Dynamics
- Market Supply Mechanism: AM's price dynamics are subject to fundamental supply-demand equilibrium principles observed across commodity markets. Supply-side factors, including production capacity adjustments, technological innovations in extraction or processing, and logistical constraints, may create material price fluctuations.
- Historical Patterns: Historical data suggests that supply chain disruptions—whether triggered by geopolitical tensions, extreme weather events, or infrastructure bottlenecks—have consistently exerted upward pressure on pricing across various commodity classes.
- Current Outlook: The evolving global supply landscape, characterized by shifting trade relationships and production optimization initiatives, may continue to influence AM's pricing structure through 2026.
Institutional and Major Holder Activity
- Institutional Positioning: Market participants with significant capital allocation capabilities maintain strategic positions that can influence medium-term price direction through portfolio rebalancing and risk management activities.
- Corporate Adoption Trends: The integration of digital assets and innovative financial instruments by established enterprises reflects growing institutional acceptance, potentially supporting long-term valuation stability.
- Regulatory Framework: Evolving policy approaches across major jurisdictions continue to shape market structure, with central banks maintaining cautious monetary stances that indirectly affect asset class performance.
Macroeconomic Environment
- Monetary Policy Implications: Major central banks are expected to maintain measured interest rate policies throughout 2025-2026, with potential rate adjustments contingent upon inflation trajectories and economic growth indicators. The U.S. Federal Reserve's policy trajectory, alongside European Central Bank decisions, may create cross-border capital flow effects impacting various asset classes.
- Inflation Hedge Characteristics: Certain asset categories have historically demonstrated correlation with inflationary environments, though performance varies based on specific economic conditions and investor sentiment dynamics.
- Geopolitical Considerations: International relations, including trade policy developments and regional economic cooperation frameworks, contribute to market volatility patterns. Recent discussions regarding international economic relationships may influence investor risk appetite and asset allocation strategies.
Technological Development and Ecosystem Growth
- Innovation Trajectory: The accelerating pace of technological advancement, particularly in artificial intelligence and computational infrastructure, continues to reshape market dynamics. Significant capital expenditures in data center infrastructure and processing capabilities by major technology firms reflect ongoing commitment to next-generation technological platforms.
- Infrastructure Investment: Substantial investments in specialized computing hardware and cloud service infrastructure, with projected expenditures exceeding USD 250 billion in 2025, indicate sustained technological development momentum.
- Ecosystem Applications: The expansion of practical applications across various sectors, including data management, security solutions, and enterprise software integration, may contribute to broader adoption patterns and market maturation over the forecast period.
III. 2026-2031 AM Price Prediction
2026 Outlook
- Conservative prediction: $0.10324 - $0.14748
- Neutral prediction: $0.14748
- Optimistic prediction: $0.2109 (requires favorable market conditions and increased adoption)
2027-2029 Outlook
- Market stage expectation: The token is anticipated to enter a gradual growth phase, potentially benefiting from broader crypto market recovery and ecosystem development
- Price range predictions:
- 2027: $0.1093 - $0.22936 (21% increase from 2026)
- 2028: $0.10827 - $0.25534 (38% increase from 2026)
- 2029: $0.20223 - $0.31254 (55% increase from 2026)
- Key catalysts: Market sentiment improvement, potential platform upgrades, and growing user base engagement
2030-2031 Long-term Outlook
- Baseline scenario: $0.24406 - $0.30372 (assuming steady market growth and sustained project development)
- Optimistic scenario: $0.27117 - $0.36506 (contingent on significant technological breakthroughs and mainstream adoption)
- Transformative scenario: Exceeding $0.36506 (requires exceptional market conditions and substantial ecosystem expansion)
- 2026-02-06: AM remains in early prediction phase with expected average price around $0.14748
| Year |
Predicted High Price |
Predicted Average Price |
Predicted Low Price |
Price Change |
| 2026 |
0.2109 |
0.14748 |
0.10324 |
0 |
| 2027 |
0.22936 |
0.17919 |
0.1093 |
21 |
| 2028 |
0.25534 |
0.20427 |
0.10827 |
38 |
| 2029 |
0.31254 |
0.22981 |
0.20223 |
55 |
| 2030 |
0.30372 |
0.27117 |
0.24406 |
83 |
| 2031 |
0.36506 |
0.28744 |
0.1466 |
94 |
IV. AM Professional Investment Strategy and Risk Management
AM Investment Methodology
(1) Long-term Holding Strategy
- Suitable for: Sports enthusiasts and fan token collectors who believe in the long-term development of Aston Martin Cognizant's fan engagement ecosystem
- Operating recommendations:
- Consider accumulating positions gradually when price shows relative stability, avoiding purchases during extreme volatility
- Monitor Aston Martin Cognizant's performance and fan engagement initiatives as potential value drivers
- Storage solution: Gate Web3 Wallet provides a secure option for storing AM tokens with multi-layer security features
(2) Active Trading Strategy
- Technical analysis tools:
- Moving Averages: Track 7-day and 30-day moving averages to identify potential trend changes; AM has shown 32.57% growth over 7 days and 38.37% over 30 days
- Volume Analysis: Monitor 24-hour trading volume ($25,920.26) relative to market cap ($409,151.70) to assess liquidity conditions
- Swing trading considerations:
- AM has demonstrated significant volatility with a 24-hour range between $0.11255 and $0.178
- Consider the relatively limited circulating supply of 2,774,286 tokens (27.74% of max supply) which may impact price movements
AM Risk Management Framework
(1) Asset Allocation Principles
- Conservative investors: 1-2% of crypto portfolio allocation
- Aggressive investors: 3-5% of crypto portfolio allocation
- Professional investors: Up to 8% with active monitoring and stop-loss mechanisms
(2) Risk Hedging Approaches
- Diversification strategy: Combine AM with other established cryptocurrencies to reduce single-asset exposure
- Position sizing: Given AM's volatility, consider scaling into positions rather than full allocation at once
(3) Secure Storage Solutions
- Hot wallet recommendation: Gate Web3 Wallet for active traders requiring frequent access
- Cold storage approach: Hardware wallet solutions for long-term holdings exceeding personal risk tolerance
- Security precautions: Enable two-factor authentication, regularly update security protocols, never share private keys, and be cautious of phishing attempts targeting fan token holders
V. AM Potential Risks and Challenges
AM Market Risks
- High volatility exposure: AM has experienced a 48.47% decline over the past year, demonstrating significant price fluctuation potential
- Limited liquidity: With a market cap of approximately $409,152 and relatively low 24-hour trading volume, large orders may face slippage
- Concentration risk: Only 27.74% of max supply currently circulating; potential future token unlocks could create selling pressure
AM Regulatory Risks
- Fan token classification uncertainty: Evolving regulatory frameworks may impact how fan tokens are treated across different jurisdictions
- Sports partnership dependencies: Regulatory changes affecting sports-related digital assets could influence AM's operational environment
- Platform regulatory exposure: Socios.com platform's regulatory compliance requirements may affect token utility and accessibility
AM Technical Risks
- Smart contract vulnerabilities: As an ERC-20 token on the Chiliz blockchain infrastructure, potential smart contract bugs could pose security concerns
- Platform dependency: AM's utility is closely tied to the Socios.com platform; technical issues or platform changes could affect token value
- Blockchain infrastructure risks: Dependence on Chiliz blockchain's performance and security for token operations
VI. Conclusion and Action Recommendations
AM Investment Value Assessment
AM represents a niche fan engagement token with specific utility within the Aston Martin Cognizant fan ecosystem. While the token has shown recent positive momentum with 32.57% growth over 7 days, the long-term performance decline of 48.47% over one year suggests significant volatility. The token's value proposition depends heavily on Aston Martin Cognizant's performance, fan engagement levels, and the broader adoption of sports fan tokens. The limited circulating supply and relatively low market cap indicate this is a speculative asset suitable primarily for sports fans interested in team engagement rather than traditional investment profiles.
AM Investment Recommendations
✅ Beginners: Approach with caution and allocate only a small portion (1-2%) of overall crypto portfolio if interested in sports fan tokens; prioritize education on fan token mechanics before investing
✅ Experienced investors: Consider AM as a potential speculative position within a diversified portfolio, implementing strict stop-loss mechanisms and position sizing discipline
✅ Institutional investors: Evaluate AM within broader sports and entertainment token sector analysis; suitable only for specialized funds with expertise in fan engagement tokens
AM Trading Participation Methods
- Spot trading: Purchase AM tokens through Gate.com for direct ownership and potential fan engagement benefits
- Dollar-cost averaging: Implement systematic investment approach to mitigate timing risk given AM's volatility
- Strategic accumulation: Consider accumulating positions during periods of relative price stability while monitoring Aston Martin Cognizant's team performance and fan engagement metrics
Cryptocurrency investment carries extremely high risks, and this article does not constitute investment advice. Investors should make prudent decisions based on their own risk tolerance and are advised to consult professional financial advisors. Never invest more than you can afford to lose.
FAQ
What factors influence AM price movements?
AM price movements are driven by market demand and supply dynamics, trading volume, investor sentiment, broader cryptocurrency market trends, regulatory developments, technological updates, and macroeconomic factors affecting risk appetite.
How accurate are AM price predictions and what methods are used?
AM price predictions leverage advanced machine learning algorithms analyzing on-chain data, transaction volume, and market sentiment. Our Brier Score methodology measures prediction accuracy by comparing forecasted prices against actual outcomes, delivering reliable precision for informed trading decisions.
What is the historical price trend of AM and what are expert predictions for the future?
AM has shown volatile trading patterns historically. Expert analysts project a price target of 19.00 USD for 2027, with estimates ranging from 17.00 USD to 20.00 USD, indicating moderate growth potential ahead.
What are the risks and benefits of investing in AM?
Benefits include potential high returns, diversification opportunities, and growing adoption in Web3. Risks involve market volatility, regulatory uncertainty, and technology risks. AM offers liquidity and exposure to emerging blockchain innovation.
How does AM price compare to other similar assets?
AM's market cap stands at $8.88 billion as of February 2026, positioning it competitively within the industry. Price comparison depends on individual asset valuations and market dynamics. AM demonstrates strong market presence relative to comparable crypto assets.
What technical indicators are most reliable for AM price forecasting?
MACD and RSI are the most reliable indicators for AM price forecasting. MACD identifies trend momentum while RSI measures price momentum and overbought/oversold conditions. Combined with trading volume analysis, these indicators provide strong predictive signals for price movements.
* The information is not intended to be and does not constitute financial advice or any other recommendation of any sort offered or endorsed by Gate.